Meridional winds in m/s (contours; purple: southerly, orange: northerly winds, in (a–c, e–g) contours start at an absolute value of 3 m/s and increase/decrease by 3 respectively, in (d, h) contours start an absolute value of 0.5 and increase/decrease by steps of one) and near surface temperature anomalies filled contours during (a–c) wave-7 and (e–g) wave- 5 events relative to the respective climatology in the northern hemisphere summer (JJA) based on (a, e) ERA5 reanalysis (1960–2014), (b, f) historical (1960–2014) and (c, g) future (SSP5-8.5, 2045–2099) bias-adjusted output from CMIP6 simulations (four models). d, h) Difference in meridional winds and temperature response during wave events comparing historical and future patterns in four bias-adjusted CMIP6 models (for twelve non adjusted models see Fig. S6). Hatching shows statistical significance on a 95% confidence level (a, d, e, h) or 100% model agreement in sign (4 out of 4 models, b, c, f, g) While the phase positions and intensity of the wave patterns (line contour) are well represented in the models their surface imprint are considerably underestimated in historical simulations. Changes in the temperature response are identified over North America, Eurasia and East Asia (d, h). Graphic: Kornhuber, et al., 2023 / Nature Communications
Meridional winds in m/s (contours; purple: southerly, orange: northerly winds, in (aceg) contours start at an absolute value of 3 m/s and increase/decrease by 3 respectively, in (dh) contours start an absolute value of 0.5 and increase/decrease by steps of one) and near surface temperature anomalies filled contours during (ac) wave-7 and (eg) wave- 5 events relative to the respective climatology in the northern hemisphere summer (JJA) based on (ae) ERA5 reanalysis (1960–2014), (bf) historical (1960–2014) and (cg) future (SSP5-8.5, 2045–2099) bias-adjusted output from CMIP6 simulations (four models). dh) Difference in meridional winds and temperature response during wave events comparing historical and future patterns in four bias-adjusted CMIP6 models (for twelve non adjusted models see Fig. S6). Hatching shows statistical significance on a 95% confidence level (adeh) or 100% model agreement in sign (4 out of 4 models, bcfg) While the phase positions and intensity of the wave patterns (line contour) are well represented in the models their surface imprint are considerably underestimated in historical simulations. Changes in the temperature response are identified over North America, Eurasia and East Asia (dh). Graphic: Kornhuber, et al., 2023 / Nature Communications

By Kelly Macnamara
4 July 2023

(AFP) – The risks of harvest failures in multiple global breadbaskets have been underestimated, according to a study Tuesday that researchers said should be a “wake up call” about the threat climate change poses to our food systems.

Food production is both a key source of planet-warming emissions and highly exposed to the effects of climate change, with climate and crop models used to figure out just what the impacts could be as the world warms.

In the new research published in Nature Communications, researchers in the United States and Germany looked at the likelihood that several major food producing regions could simultaneously suffer low yields.

These events can lead to price spikes, food insecurity and even civil unrest, said lead author Kai Kornhuber, a researcher at Columbia University and the German Council on Foreign Relations.

By “increasing the concentration of greenhouse gases, we are entering this uncharted water where we are struggling to really have an accurate idea of what type of extremes we’re going to face,” he told AFP.

“We show that these types of concurring events are really largely underestimated.”

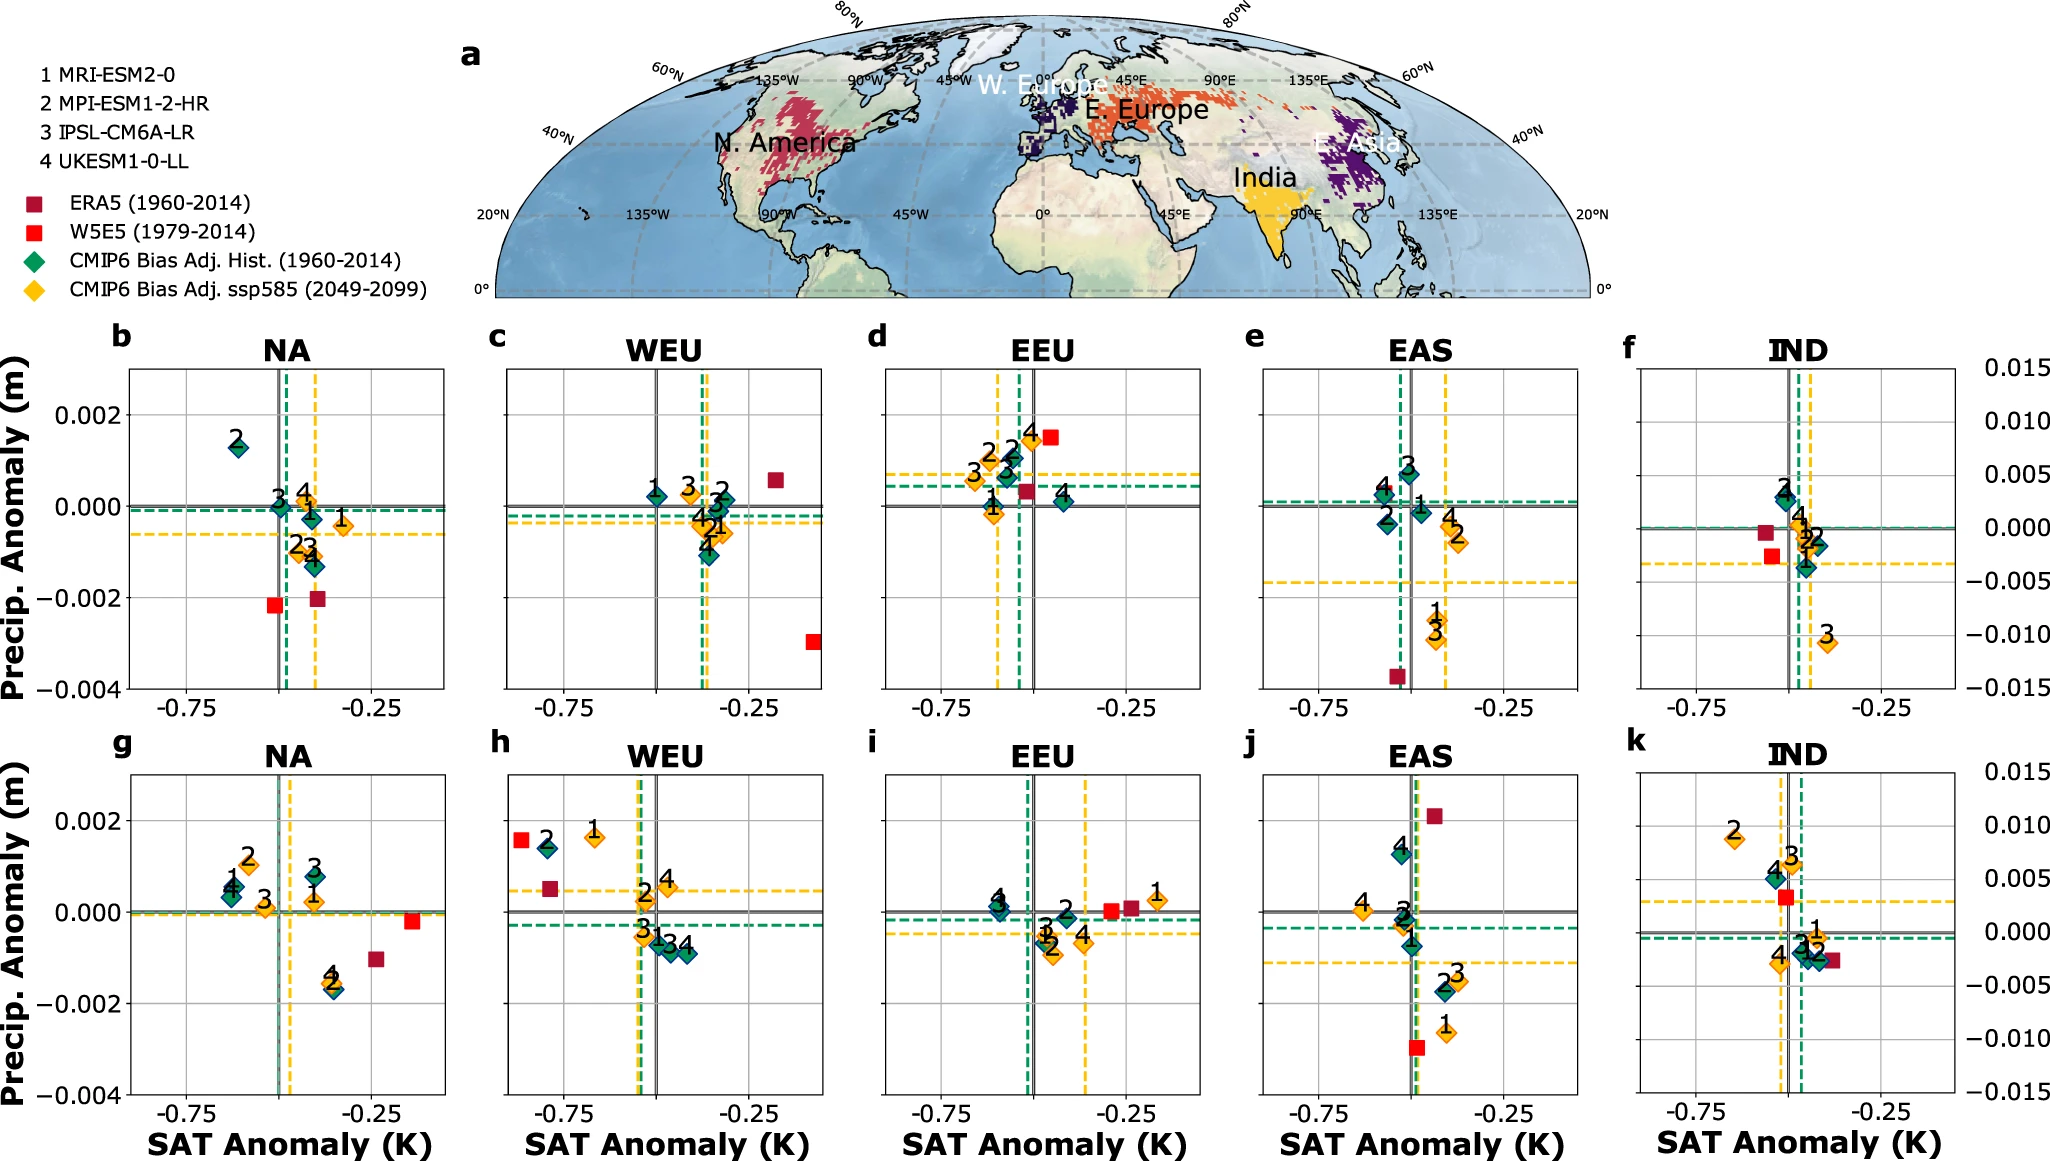
The study looked at observational and climate model data between 1960 and 2014, and then at projections for 2045 to 2099.

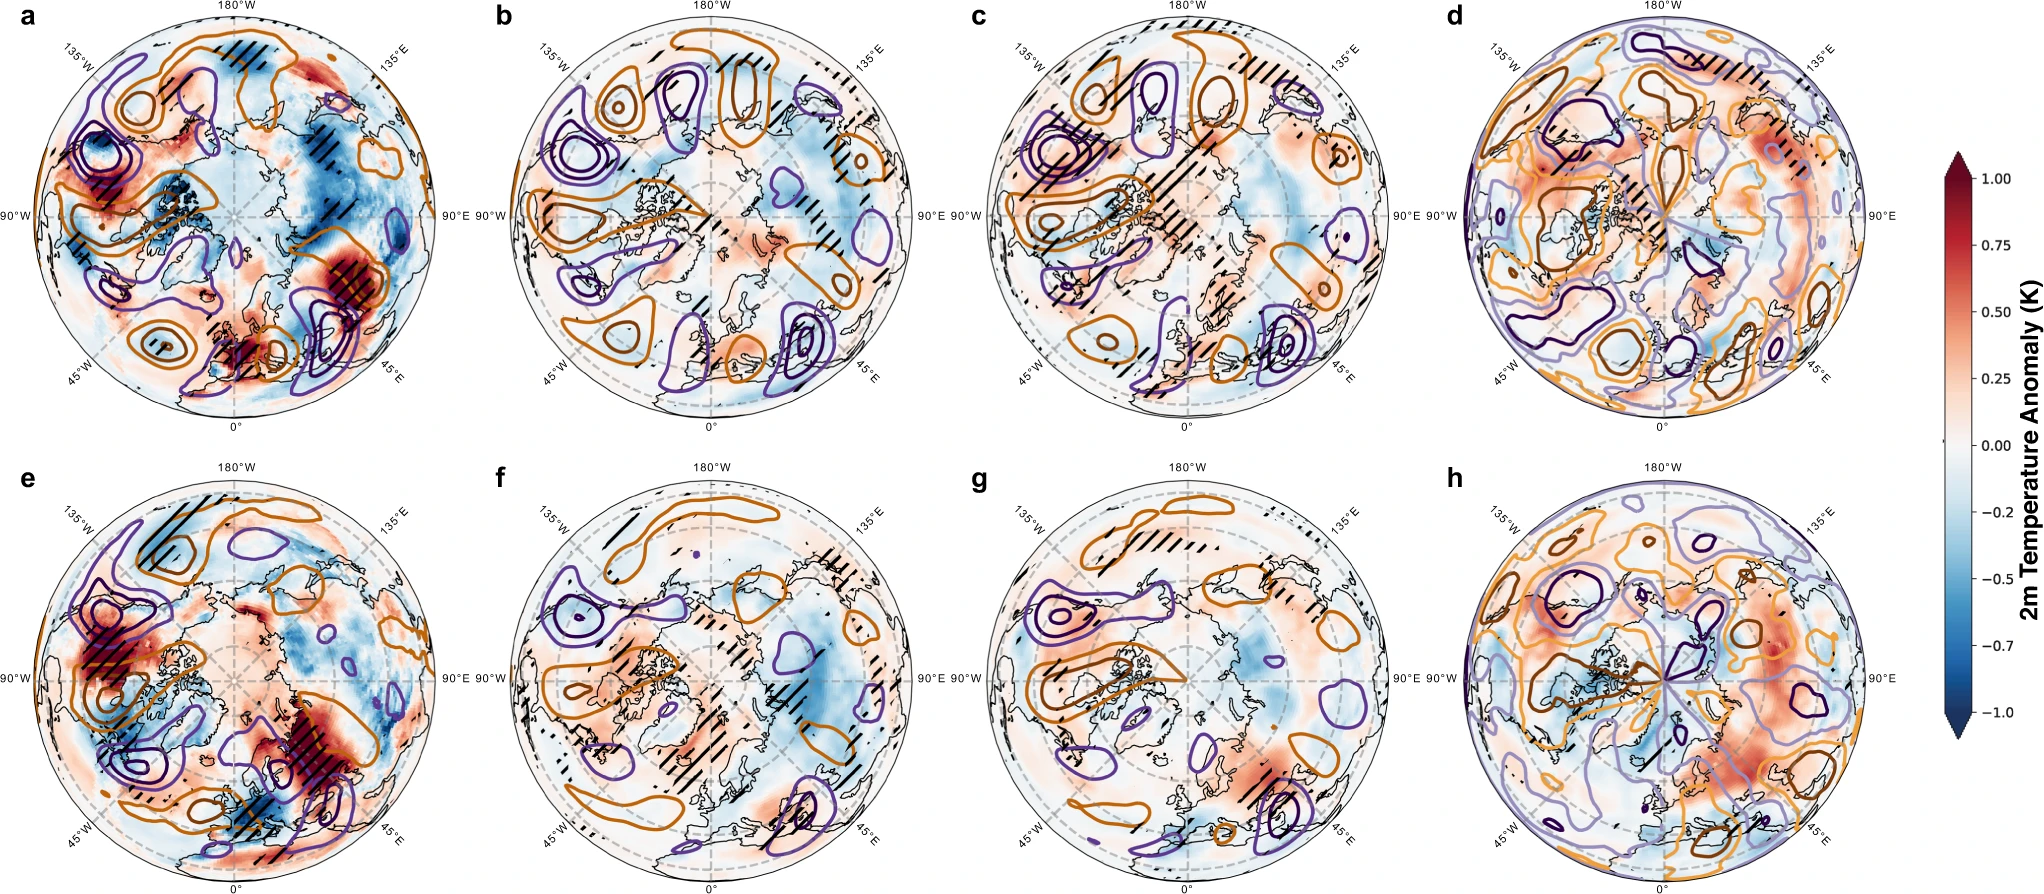
Researchers first looked at the impact of the jet stream—the air currents that drive weather patterns in many of the world’s most important crop producing regions.

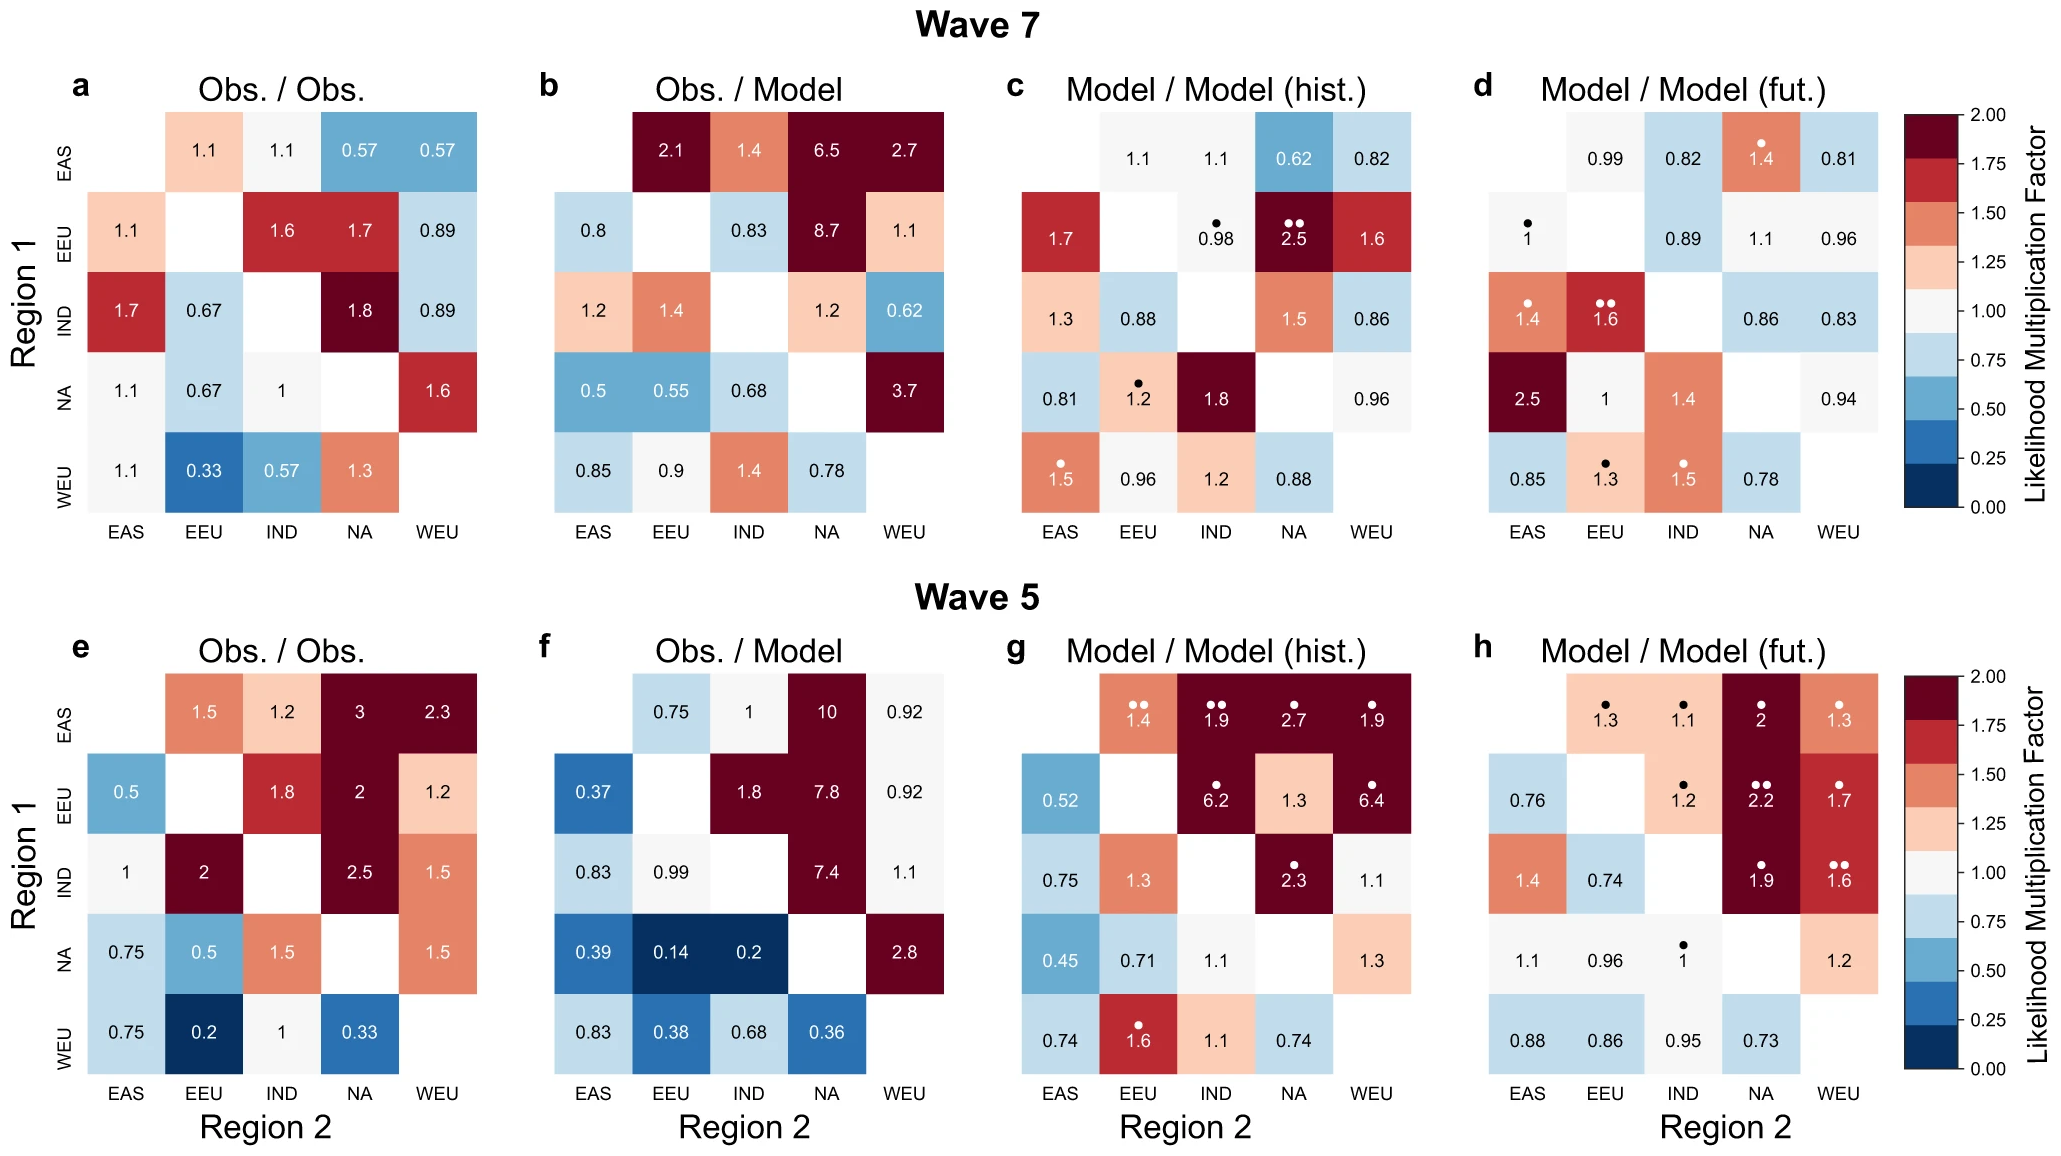
They found that a “strong meandering” of the jet stream, flowing in big wave shapes, has particularly significant impacts on key agricultural regions in North America, Eastern Europe, and East Asia, with a reduction in harvests of up to seven percent.

The researchers also found that this had been linked to simultaneous crop failures in the past.

One example was in 2010, when the fluctuations of the jet stream were linked to both extreme heat in parts of Russia and devastating floods in Pakistan, which both hurt crops, Kornhuber said.

a Major crop producing regions in the Northern Hemisphere mid-latitudes defined by a threshold of 25% harvested area per grid-point. Weekly mean temperature and aggregated precipitation anomalies averaged over the regions outlined in (a) for (b–f) wave-7 and (g–k) for wave-5. We compare two different reanalysis datasets ERA-5 (dark red,1960–2014) and W5E5 (red, 1979–2014) with bias-adjusted output from four CMIP6 models under historical (green, 1960–2014) and future (2045–2099, SSP5-8.5, yellow) conditions, whereas their mean values are shown as dashed lines. Note the different y-axis range for (k) and (f) compared to the other panels. Temperature anomalies are dominantly underestimated in the bias-adjusted output in WEU (wave-7, wave-5), EEU and NA (wave-5). Precipitation anomalies are underestimated in NA, WEU (wave-7). Kornhuber, et al., 2023 / Nature Communications
a Major crop producing regions in the Northern Hemisphere mid-latitudes defined by a threshold of 25% harvested area per grid-point. Weekly mean temperature and aggregated precipitation anomalies averaged over the regions outlined in (a) for (bf) wave-7 and (gk) for wave-5. We compare two different reanalysis datasets ERA-5 (dark red,1960–2014) and W5E5 (red, 1979–2014) with bias-adjusted output from four CMIP6 models under historical (green, 1960–2014) and future (2045–2099, SSP5-8.5, yellow) conditions, whereas their mean values are shown as dashed lines. Note the different y-axis range for (k) and (f) compared to the other panels. Temperature anomalies are dominantly underestimated in the bias-adjusted output in WEU (wave-7, wave-5), EEU and NA (wave-5). Precipitation anomalies are underestimated in NA, WEU (wave-7). Kornhuber, et al., 2023 / Nature Communications

Risk assessment

The study also looked at how well computer models assess these risks and found that while they are good at showing the atmospheric movement of the jet stream, they underestimate the magnitude of the extremes this produces on the ground.

Kornhuber said the study should be a “a wake up call in terms of our uncertainties” of the impacts of climate change on the food sector, with more frequent and intense weather extremes and increasingly complicated combinations of extremes.

“We need to be prepared for these types of complex climate risks in the future and the models at the moment seem to not capture this,” he said.

On Monday, United Nations’ human rights chief Volker Turk warned of a “truly terrifying” dystopian future of hunger and suffering as climate change-driven extremes hit crops, livestock, and crucial ecosystems.

He told a UN debate on the right to food that more than 828 million people faced hunger in 2021 and climate change could increase that by 80 million by mid-century, and slammed world leaders for short term thinking.

We may be underestimating the climate risk to crops: researchers


LMF of concurrent negative yield anomalies of combined wheat and maize yield in two regions for wave-7 (a–d) and wave-5 events pear year (e–h) (upper right corner). LMF for concurrent positive yield anomalies are provided in the lower left corner of each heatmap. a, e Values based on ERA-5 and FAO data (1960–2014, Obs./Obs.). b, f Values based on wave events from ERA-5 and yield anomalies from LPJmL driven by W5E5 (Obs/Model.). LMF values for concurrent low and high yields differ significantly for (a, b, e, f) (Figs. S12–S15). Averaged LMF values based on LPJmL driven by four bias-adjusted CMIP6 models separately are shown for (c, g) historical experiments (1960–2014) and (d, h) future projections (2045–2099, SSP5-8.5). Model agreement is provided by dots where one dot indicates an agreement (above or below a LMF value of one) among three out of four models while two dots indicate an agreement among all four models. Kornhuber, et al., 2023 / Nature Communications
LMF of concurrent negative yield anomalies of combined wheat and maize yield in two regions for wave-7 (ad) and wave-5 events pear year (eh) (upper right corner). LMF for concurrent positive yield anomalies are provided in the lower left corner of each heatmap. ae Values based on ERA-5 and FAO data (1960–2014, Obs./Obs.). bf Values based on wave events from ERA-5 and yield anomalies from LPJmL driven by W5E5 (Obs/Model.). LMF values for concurrent low and high yields differ significantly for (abef) (Figs. S12–S15). Averaged LMF values based on LPJmL driven by four bias-adjusted CMIP6 models separately are shown for (cg) historical experiments (1960–2014) and (dh) future projections (2045–2099, SSP5-8.5). Model agreement is provided by dots where one dot indicates an agreement (above or below a LMF value of one) among three out of four models while two dots indicate an agreement among all four models. Kornhuber, et al., 2023 / Nature Communications

Risks of synchronized low yields are underestimated in climate and crop model projections

ABSTRACT: Simultaneous harvest failures across major crop-producing regions are a threat to global food security. Concurrent weather extremes driven by a strongly meandering jet stream could trigger such events, but so far this has not been quantified. Specifically, the ability of state-of-the art crop and climate models to adequately reproduce such high impact events is a crucial component for estimating risks to global food security. Here we find an increased likelihood of concurrent low yields during summers featuring meandering jets in observations and models. While climate models accurately simulate atmospheric patterns, associated surface weather anomalies and negative effects on crop responses are mostly underestimated in bias-adjusted simulations. Given the identified model biases, future assessments of regional and concurrent crop losses from meandering jet states remain highly uncertain. Our results suggest that model-blind spots for such high-impact but deeply-uncertain hazards have to be anticipated and accounted for in meaningful climate risk assessments.

Risks of synchronized low yields are underestimated in climate and crop model projections