Glaciers and “zombie ice”: The planet is melting at both poles, research finds – “We are already into dangerous levels of greenhouse gases that will have consequences far beyond 10 inches of sea level rise”
By Matthew Rozsa
7 September 2022
(Salon) – That sea levels will rise as Earth’s ice melts is a prophecy that began to come true long ago, at the dawn of industrial civilization when humans began pumping vast amounts of greenhouse gases into the atmosphere. Yet the timeline for sea level rise is not yet fully understood, nor do we really know how close our coastal cities are to facing devastation from the concomitant floods or higher tides.
Now, a new pair of studies reveals one possible — even likely — pathway for which sea level rise might play out on Earth, and flood our coastal cities.
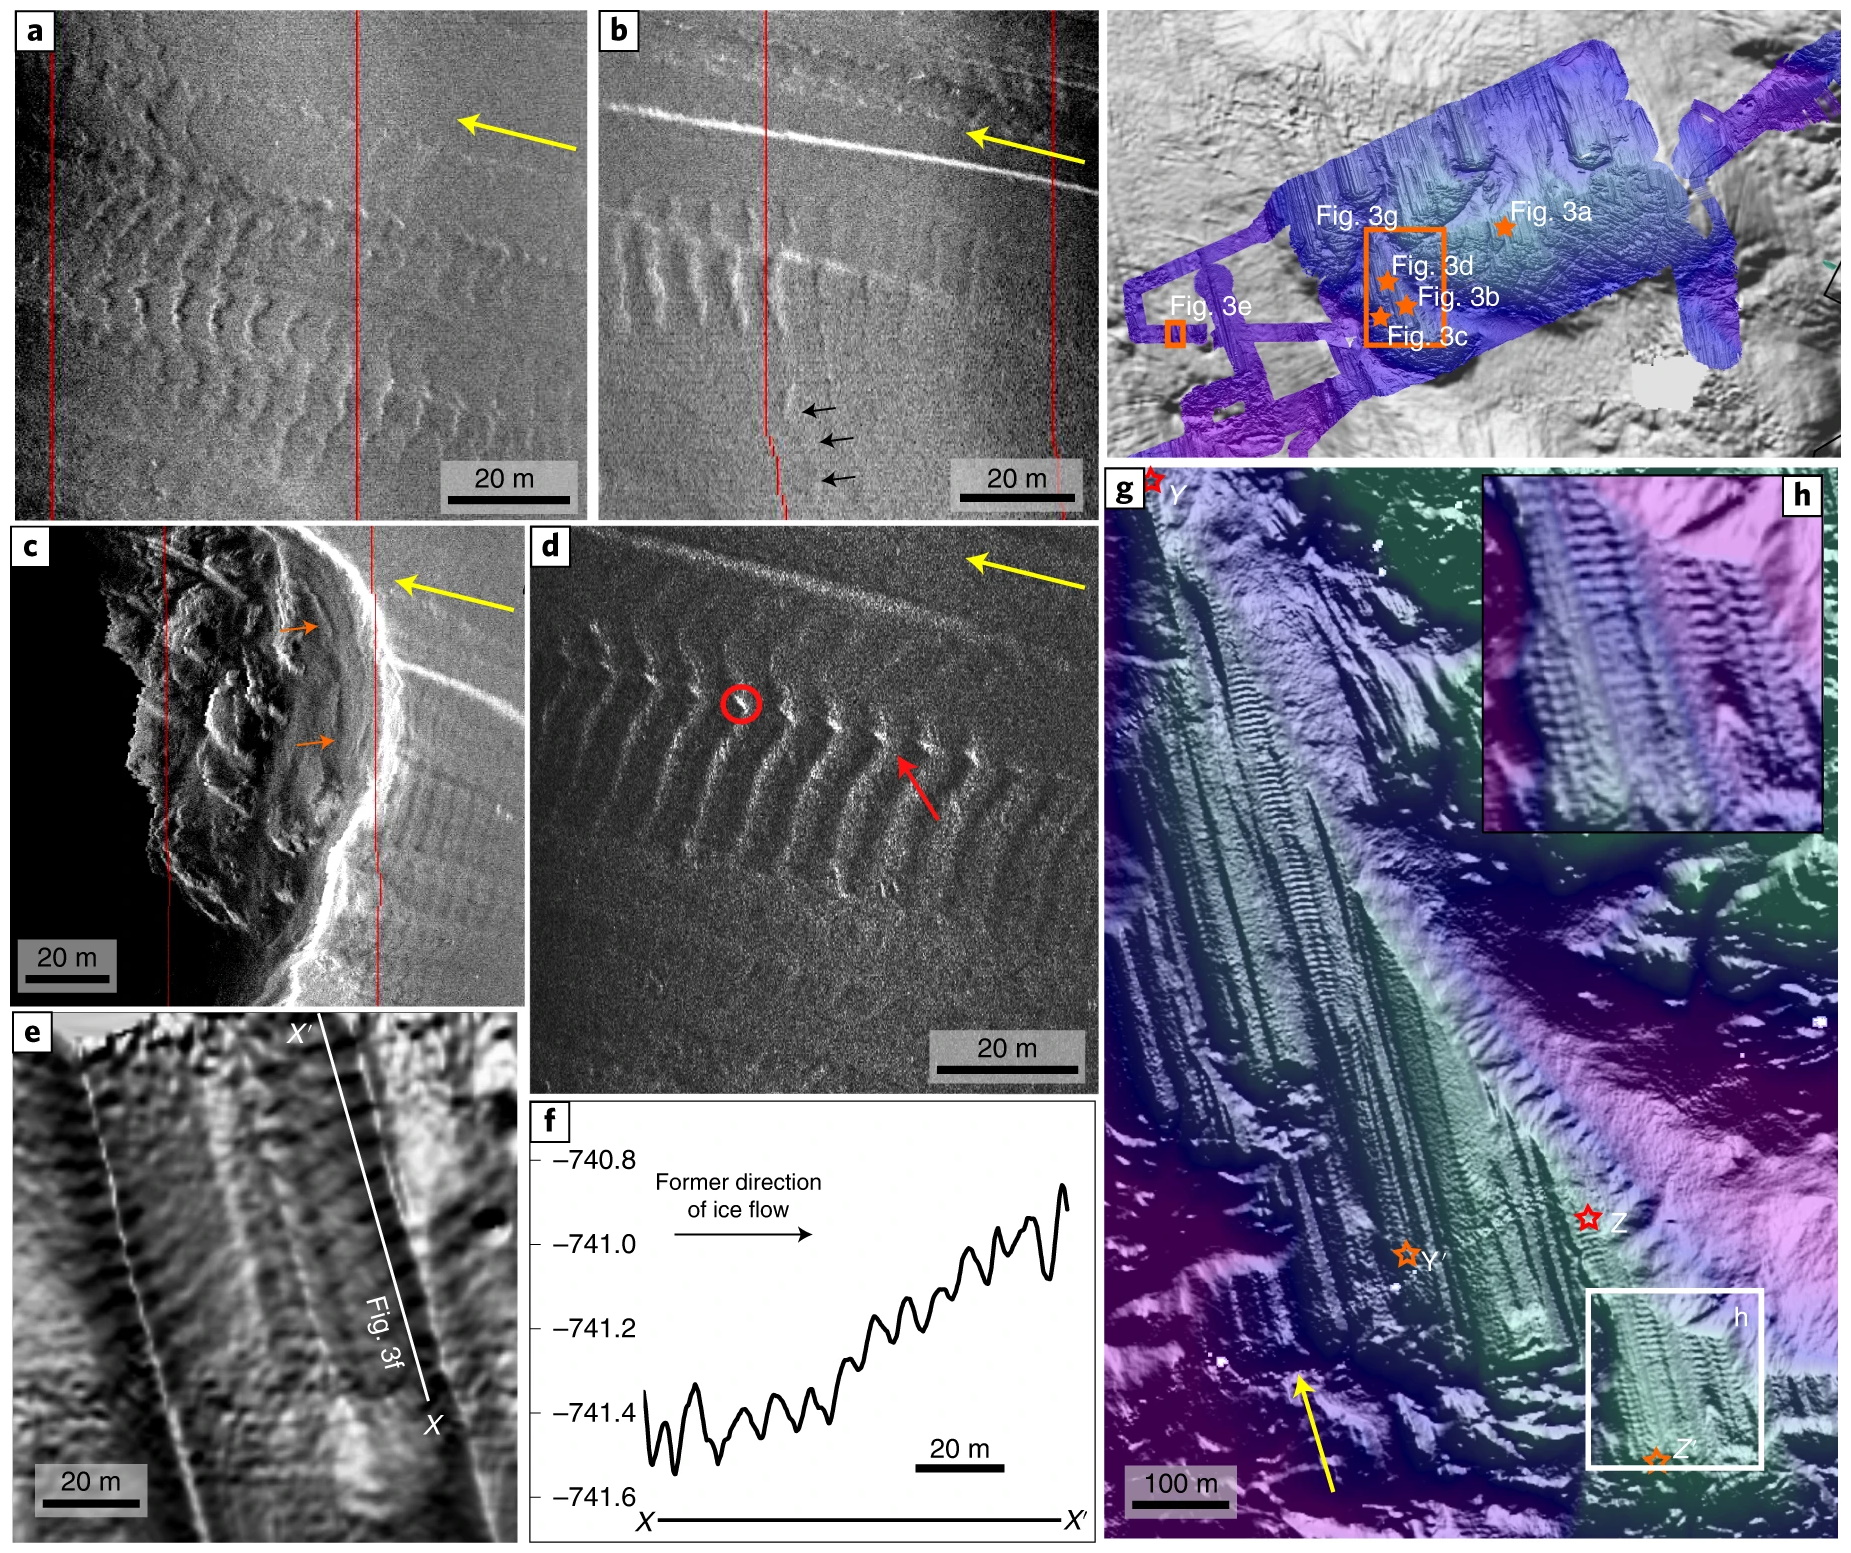
The first study — which was published in the journal Nature Geoscience — involves the Thwaites Glacier, a natural wonder of the western Antarctic that is roughly the size of Florida. Being the widest glacier in the world, it has been nicknamed the “Doomsday Glacier” — because if it collapses, the consequent rise in global sea levels would flood millions of people out of their homes. Researchers have already determined that the Thwaites Glacier is melting at dangerous levels, and the new study reveals the severity of the problem.
“Our greenhouse gas emissions are hitting the climate system with a metaphorical hammer.”
Researchers studied imprints on the seabed to ascertain the Thwaites Glacier’s movements over the past century; hence, they determined that the glacier had shrunk by roughly 1.3 miles each year during that period. That is twice the rate of shrinking that we are seeing today, which means that although the current rate of melting is not unprecedented, the ice sheet is indeed capable of melting so much that the Thwaites Glacier itself would collapse. If all of the ice that exists upstream in the Thwaites Glacier’s drainage basin melts, global sea levels will rise by more than two feet.
“About 100 years ago, it retreated faster than it is currently retreating… you could say that’s good news because it’s not so bad now compared to what it was in the past,” Dr. Anna Wåhlin, a professor of physical oceanography at Sweden’s Gothenburg University and a co-author of the study, told NBC News. “But you can also say that it’s bad news, because it could happen again.”
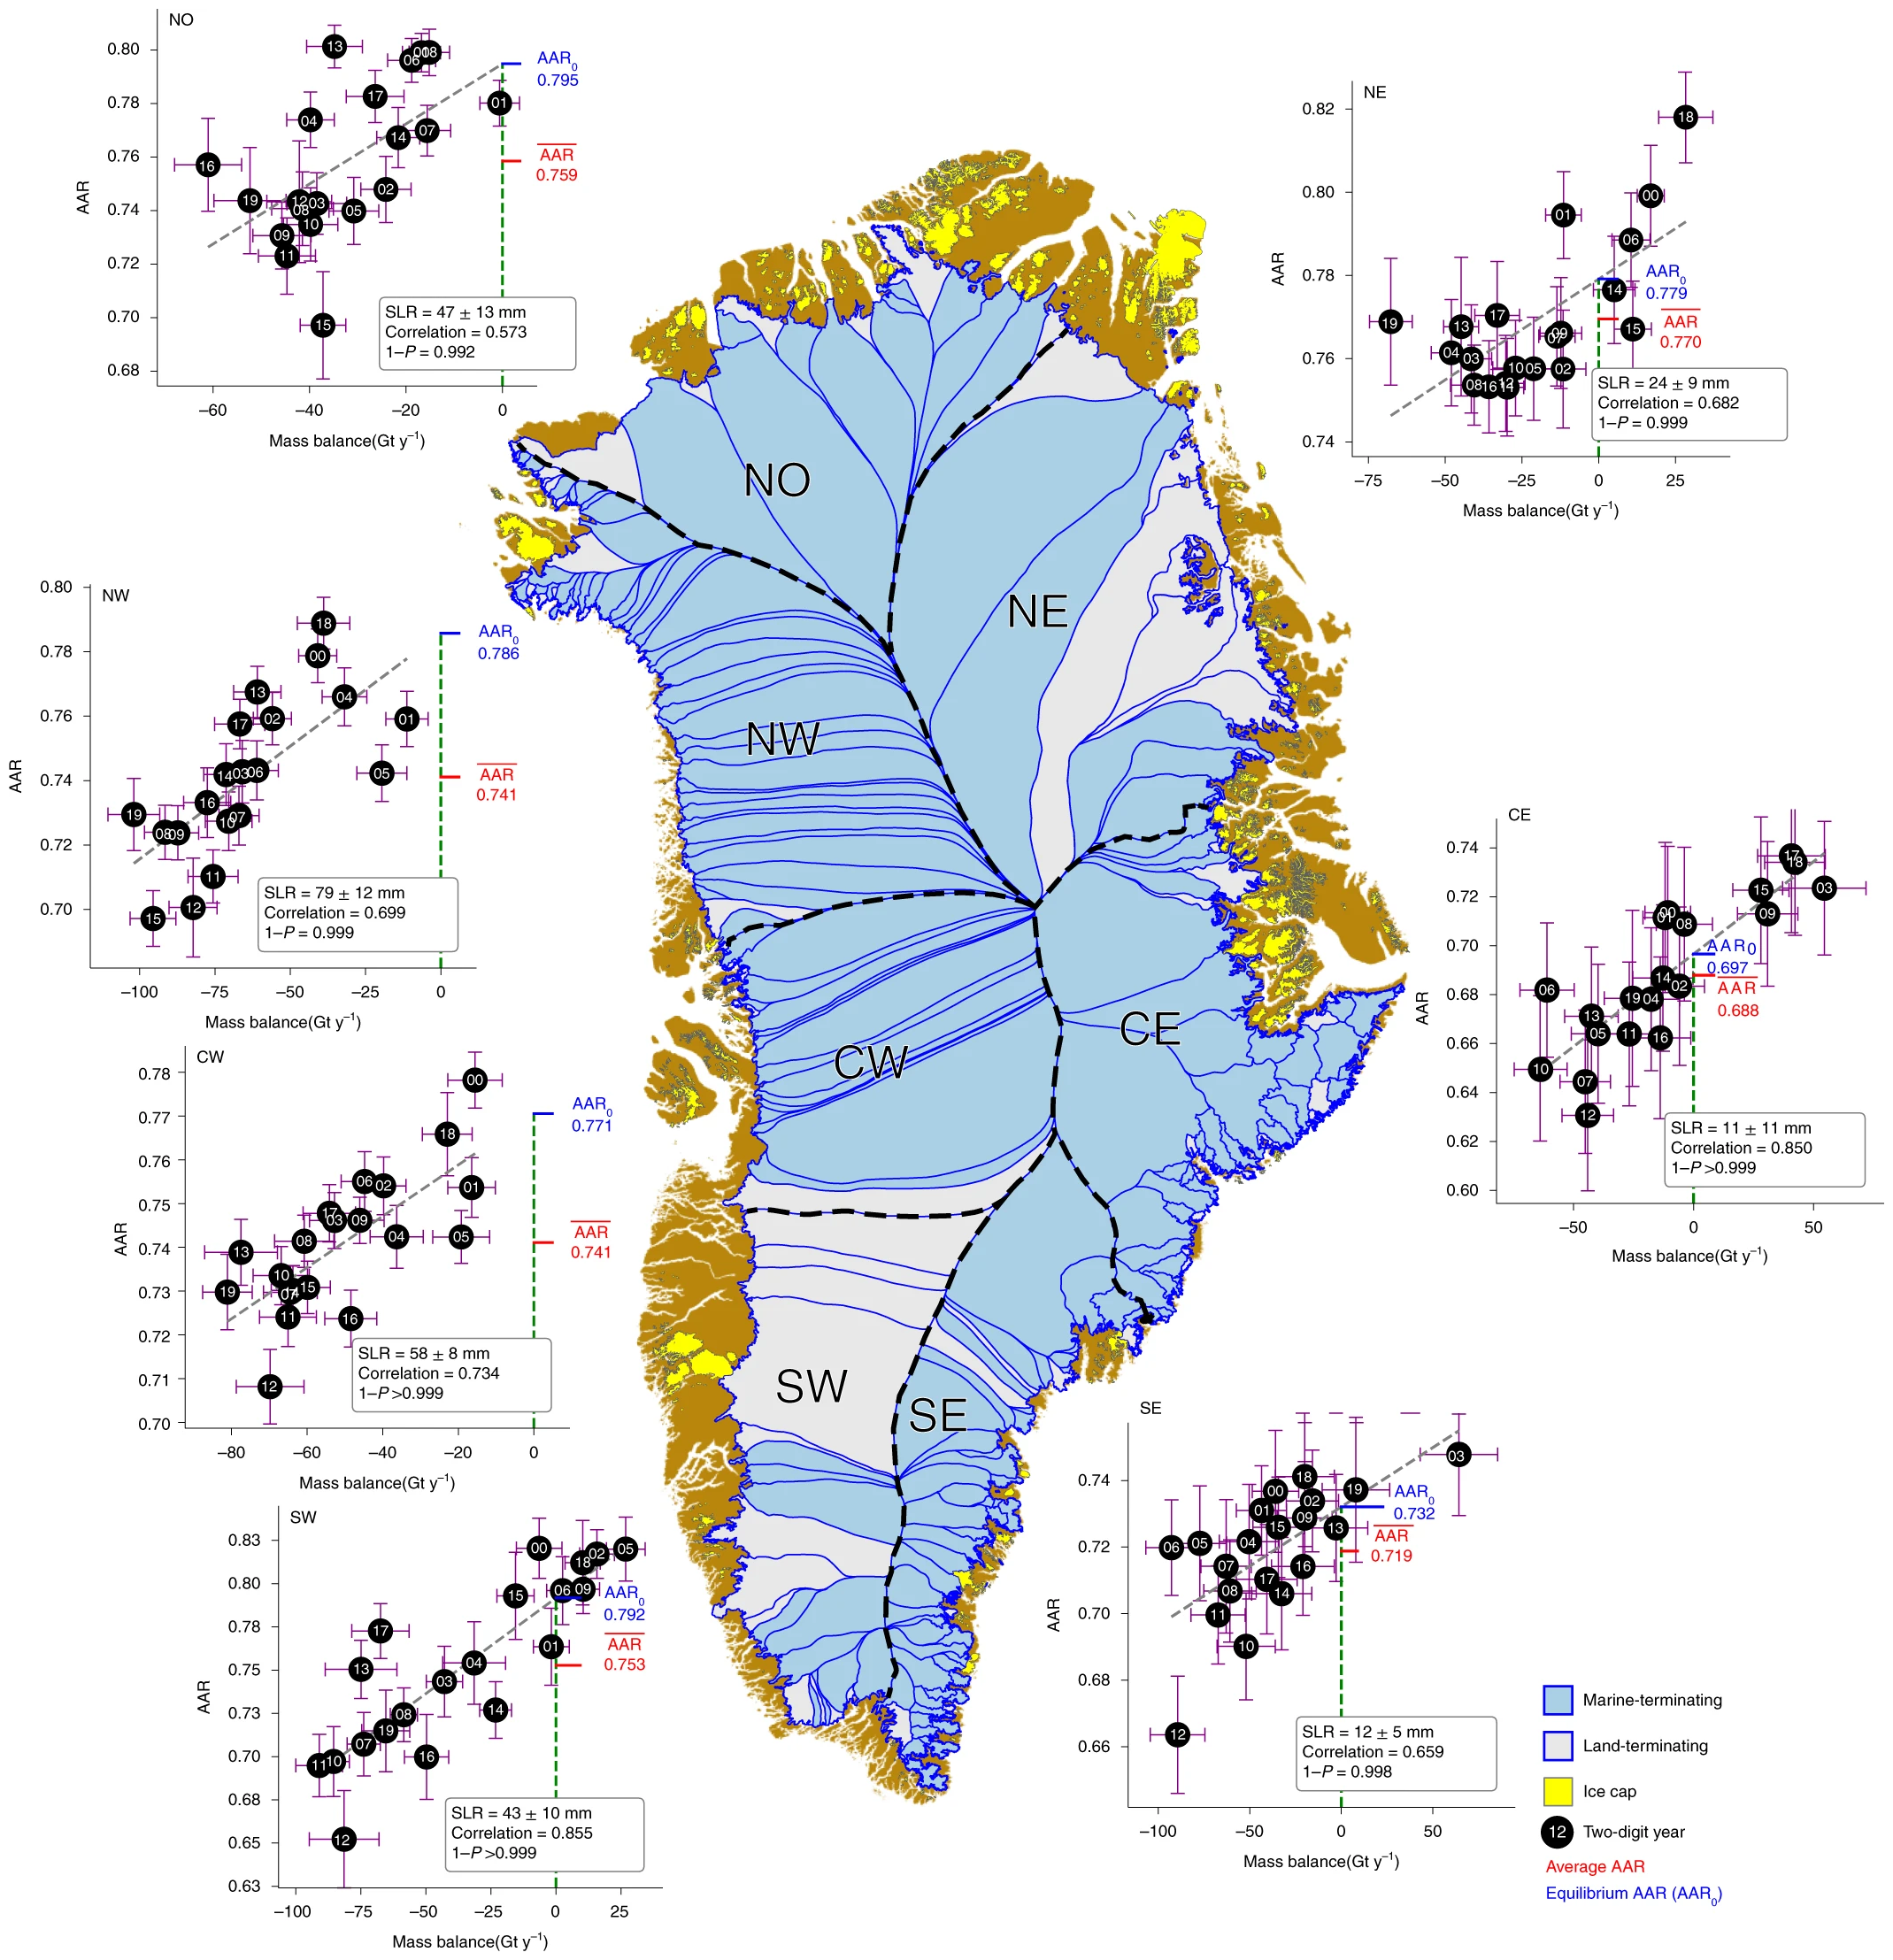
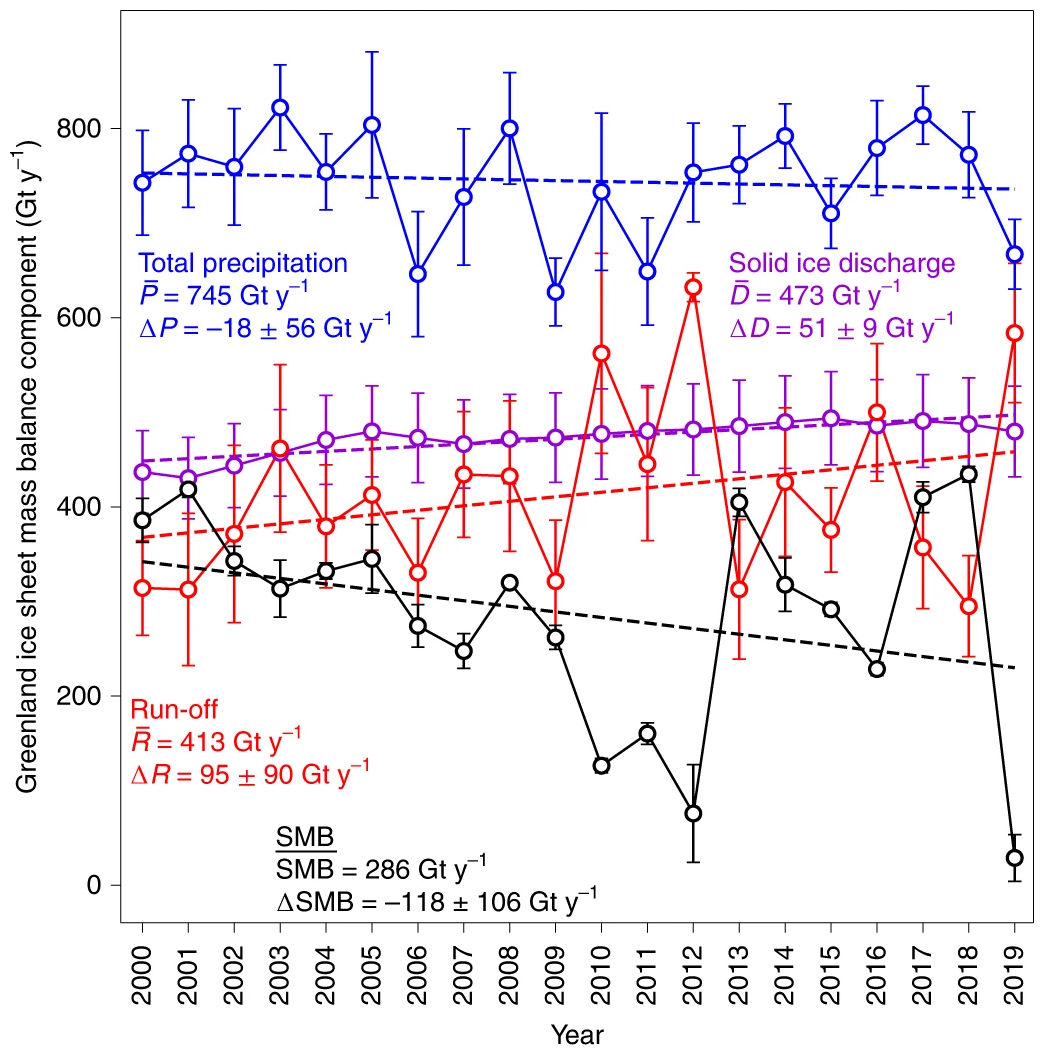
The second study — which was published in the journal Nature Climate Change — was led by Dr. Jason Box, a glaciologist at the Geological Survey of Denmark and Greenland. It found that Greenland’s rapidly melting ice sheet will raise global sea levels by at least 10.6 inches (27 centimeters). This is more than twice as fast as experts previously thought, and it is being fueled by “zombie ice,” or smaller bodies of ice that are still attached to larger bodies of ice but are doomed to melt because they are not being constantly fed snow by a parent glacier.
As study co-author Dr. William Colgan explained to the Associated Press, “It’s dead ice. It’s just going to melt and disappear from the ice sheet. This ice has been consigned to the ocean, regardless of what climate (emissions) scenario we take now.”
This places the new study in contrast with the Intergovernmental Panel on Climate Change (IPCC), a body of the United Nations focused on combatting climate change. The IPCC projected last year that Greenland’s ice melt would only raise sea levels by a range of 2 to 5 inches by the year 2100.
Dr. Jim Hansen, the director of the Climate Science, Awareness and Solutions Program at the Columbia University Earth Institute, told Salon by email that the recent papers are “incremental pushbacks” from scientists “to fight the scientific reticence institutionalized by IPCC.”
“After failing for decades to properly warn the public and offer even a modicum of advice about needed policies, IPCC continues to pretend that it is possible to keep global warming below 1.5°C with goals and targets for emission reductions,” Hansen explained. “The climate science tells us that we are already into dangerous levels of greenhouse gases that will have consequences far beyond 10 inches of sea level rise.”
Studies of climate change in the geologic past paint a picture of a world that can change much more rapidly and strongly than what is predicted by most modern climate models. Our greenhouse gas emissions are hitting the climate system with a metaphorical hammer. We have to expect the unexpected. If we think what is predicted is all we have to worry about, then we are living in a fantasy land. We are interfering in a system that is far more complex than any of our models. We can be confident that many things will happen that we will be unable to predict.
Dr. Ken Caldeira, emeritus senior scientist at the Carnegie Institution for Science
Dr. Sarah Pralle, an associate professor of political science at Syracuse University who specializes in environmental politics and policy, climate change and energy, also told Salon that the new studies suggest “that our previous models of climate change impacts have likely underestimated the scale and timeline of major climate disasters such as sea level rise.”
Dr. William Sweet, a scientist at the National Oceanic and Atmospheric Administration (NOAA), referred Salon to the agency’s Sea Level Rise Technical Report. Released in February, the report seems to reinforce the concerns raised by the two recent studies. The NOAA report projects that sea level along the United States coastline will rise from 10 to 12 inches within the next 30 years, although that is only an average figure. Along the East coast, the rise is expected to be 10 to 14 inches; for the West coast, it is expected to be 4 to 8 inches; and for the Gulf coast, it is expected to be 14 to 18 inches.
Needless to say, major metropolises from San Francisco to New York City can expect to be severely flooded.
“Sea level rise is already affecting us, here and now, and will continue to grow in severity during the coming decades.”
“These studies provide additional evidence about future-possible rises in sea level that the public needs to be aware of,” Sweet wrote to Salon. “Sea level rise is already affecting us, here and now, and will continue to grow in severity during the coming decades.” In the words of Dr. Ken Caldeira, emeritus senior scientist at the Carnegie Institution for Science, “these sorts of studies are not surprising to people who have been studying how climate has changed in Earth’s geologic past.”
“Studies of climate change in the geologic past paint a picture of a world that can change much more rapidly and strongly than what is predicted by most modern climate models,” Caldeira argued. “Our greenhouse gas emissions are hitting the climate system with a metaphorical hammer. We have to expect the unexpected. If we think what is predicted is all we have to worry about, then we are living in a fantasy land. We are interfering in a system that is far more complex than any of our models. We can be confident that many things will happen that we will be unable to predict.”
Some scientists had criticisms as to how the studies are being presented to the public by media outlets.
Dr. Michael E. Mann, a distinguished professor of atmospheric science at Penn State University, wrote to Salon about the new studies, which he had discussed with “one of the leading glaciologists in the world,” Dr. Richard Alley. They argued that, despite the “rather breathless headline in the NBC News piece” (“‘Doomsday’ glacier could melt faster than previously thought”), the new study does not change anything substantial about what we know regarding the Thwaites Glacier.
“As Richard told me, ‘the information doesn’t really support any sound bite about instability or stability of the ice sheet, with no fundamental change in our understanding,'” Mann explained. “To be clear, our current understanding is reason for concern enough. It suggests that we could be perilously close to locking in enough warming that we lose substantial part of the West Antarctic Ice Sheet, enough ice to give us 10 feet or more of sea level rise eventually. But we knew that going in. This study doesn’t change our understanding in that regard.
Regarding the Greenland study, Mann again urged caution from media outlets covering it.
“It’s a useful study and the main conclusion — that there may be a foot of committed sea level rise from the Greenland ice sheet — seems entirely plausible,” Mann wrote. “But here too some of the coverage has been misleading. The authors (as noted in the AP article) imply that this will happen within this century, but they don’t actually provide any support for that, so it seems that some of their public commentary goes behind what their science actually shows.” [more]
Glaciers and “zombie ice”: The planet is melting at both ends, research finds