Global greenhouse gas reduction in 2020 from pandemic and global recession “was 10 times greater than the impact on emissions from the 2008 global financial crisis”
By Alfredo Rivera, Shweta Movalia, Hannah Pitt, and Kate Larsen
23 December 2021
(Rhodium Group) – Understanding annual trends in greenhouse gas (GHG) emissions is a critical input for decision-makers in their efforts to reach net-zero emissions, whether is at the national, state, city, or corporate levels. Tracking emissions of the 190+ Parties to the Paris Agreement is an essential part of ensuring the effectiveness of global efforts to keep temperature rise well below 2° Celsius. A recent Washington Post investigation found that countries underreport emissions to the UN, leaving a considerable gap between reported emissions and actual emissions. The Post investigation found that inconsistencies in measurement and the frequency of reporting contributed to a gap of 8-13 gigatons of CO2e, which accounts for as much as 23% of global emissions.
While the Paris Agreement calls for improvements in the consistency and frequency of reporting, decision-makers need reliable data about the status of countries’ emissions now. To fill that gap, Rhodium Group provides the most up-to-date global and country-level GHG emissions estimates each year. This year’s update features final emissions estimates from 1990-2019 and preliminary estimates for 2020. This data includes estimates for all six Kyoto gases from across all sectors of the economy consistent with UN reporting guidelines. In partnership with Breakthrough Energy, Rhodium makes this data available through the ClimateDeck.
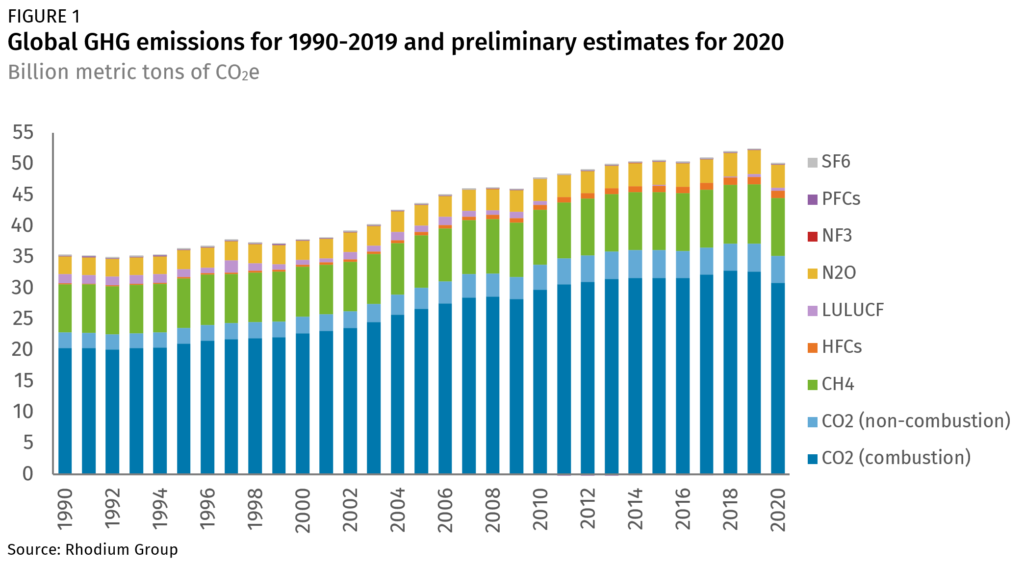
Total global emissions drop 4.4% in 2020 based on preliminary estimates
Based on our preliminary estimates for 2020, global emissions—including emissions of all six Kyoto gases, inclusive of land-use and forests and international bunkers—dropped from 52.4 gigatons of CO2e in 2019 to 50.1 gigatons in 2020 (Figure 1). This marks a 4.4% decline from 2019 levels, by far the largest drop in recorded history. The reduction in emissions in 2020 due to the COVID-19 pandemic and global recession was 10 times greater than the impact on emissions from the 2008 global financial crisis.
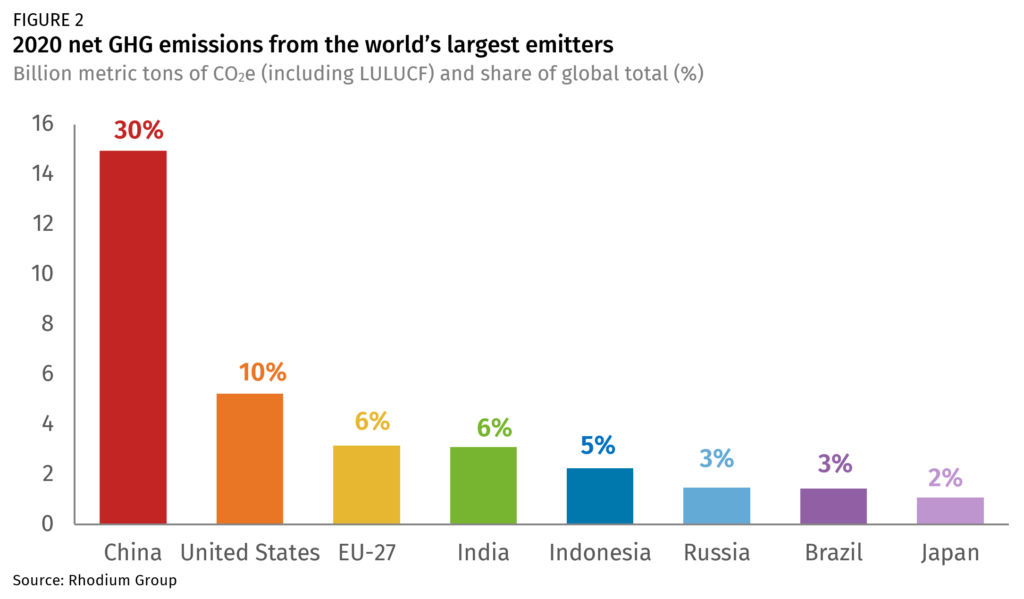
As we noted in our preliminary estimates of China’s 2020 emissions from earlier this year, China was one of the only major economies that saw emissions rise in 2020, by 1.4%. Because all other major economies saw economic contraction and an overall reduction of emissions in 2020, China’s overall share of global emissions grew in 2020, reaching 30% (Figure 2). The US and EU-27 both saw double digit declines in 2020 (10% and 11% declines, respectively), dropping their share of global emissions slightly from 2019. GHG emissions in India—the world’s 4th largest emitter at 6% of global emissions—declined just under 7% between 2019 and 2020.
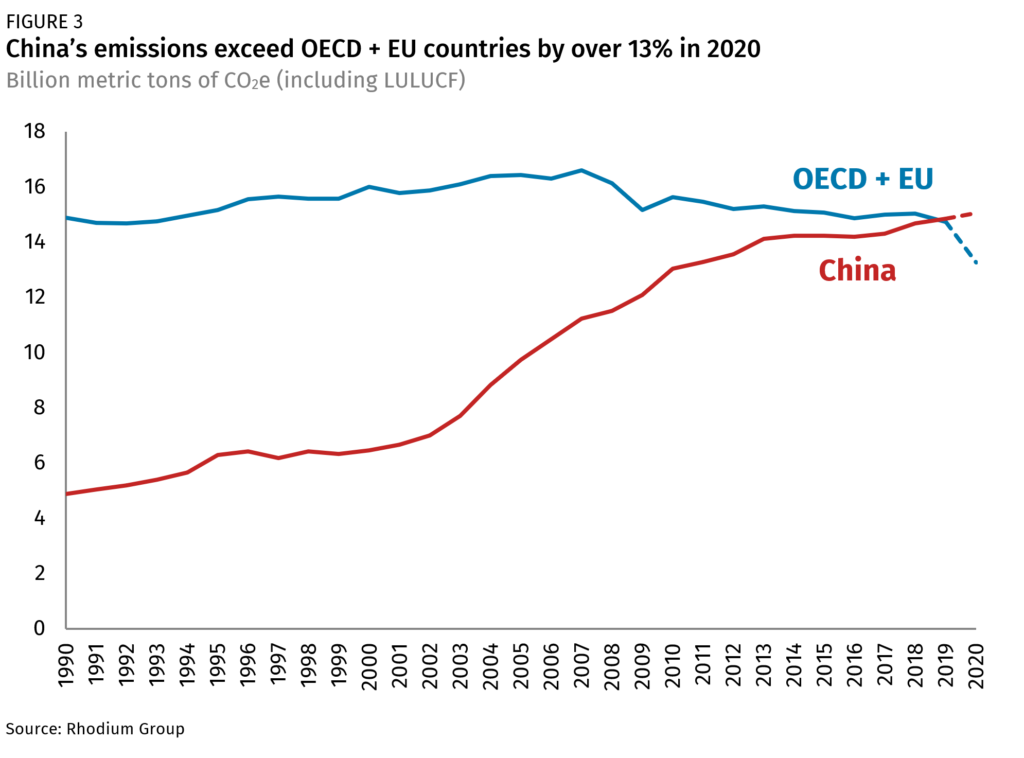
Based on our preliminary estimates for 2020, China’s GHG emissions exceeded those of all the developed world combined (here defined as all OECD member states and all EU member states) for the second year in a row. Based on our final 2019 estimates, we find that China’s emissions narrowly exceeded the combined OECD + EU total by about 0.8% (Figure 3). In 2020—based on our preliminary estimates—that gap grew to over 13% as China’s emissions continued to grow and OECD + EU emissions dropped by just over 10%.
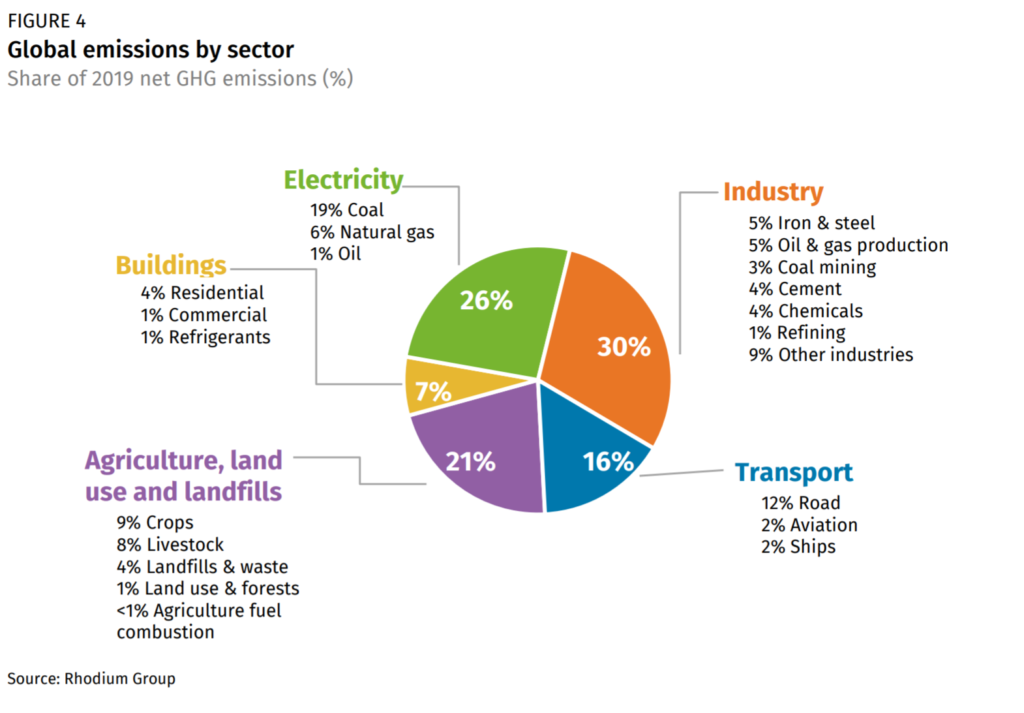
Industry and electric power generate more than half of global emissions
In 2019—the latest year for which there is sufficient data to provide sectoral level detail—industry remained the largest emitting sector, generating 30% of global emissions (Figure 4). Emissions from electric power generation contributed 26% of global emissions, the vast majority of which came from combustion of coal. Combined emissions from land use, agriculture and waste made up 21%, followed by transportation (16%) and buildings (7%).
All the datasets provided here are available in the ClimateDeck, as well as additional data and details, including the ability to filter by country, gas, and sector, as well as socioeconomic indicators (e.g., emissions per capita and per GDP), and full inventory tables for each country. [more]