Why the electric-car revolution may take a lot longer than expected – MIT analysis finds steady declines in battery costs will stall soon
By James Temple
19 November 2019
(Technology Review) – A new report from the MIT Energy Initiative warns that EVs may never reach the same sticker price so long as they rely on lithium-ion batteries, the energy storage technology that powers most of today’s consumer electronics. In fact, it’s likely to take another decade just to eliminate the difference in the lifetime costs between the vehicle categories, which factors in the higher fuel and maintenance expenses of standard cars and trucks.
The findings sharply contradict those of other research groups, which have concluded that electric vehicles could achieve price parity with gas-powered ones in the next five years. The lingering price difference predicted by the MIT report could stunt the transition to lower-emission vehicles, requiring governments to extend subsides or enact stricter mandates to achieve the same adoption of EVs and cuts in climate pollution.
Transportation is the largest source of greenhouse-gas emissions in the US and fourth largest globally, so there’s no way to achieve the reductions necessary to avoid dangerous levels of global warming without major shifts to cleaner vehicles and mass transit systems.
The problem is that the steady decline in the cost of lithium-ion batteries, which power electric vehicles and account for about a third of their total cost, is likely to slow in the next few years as they approach limits set by the cost of raw materials.
“If you follow some of these other projections, you basically end up with the cost of batteries being less than the ingredients required to make it,” says Randall Field, executive director of the Mobility of the Future group at MIT. “We see that as a flaw.”
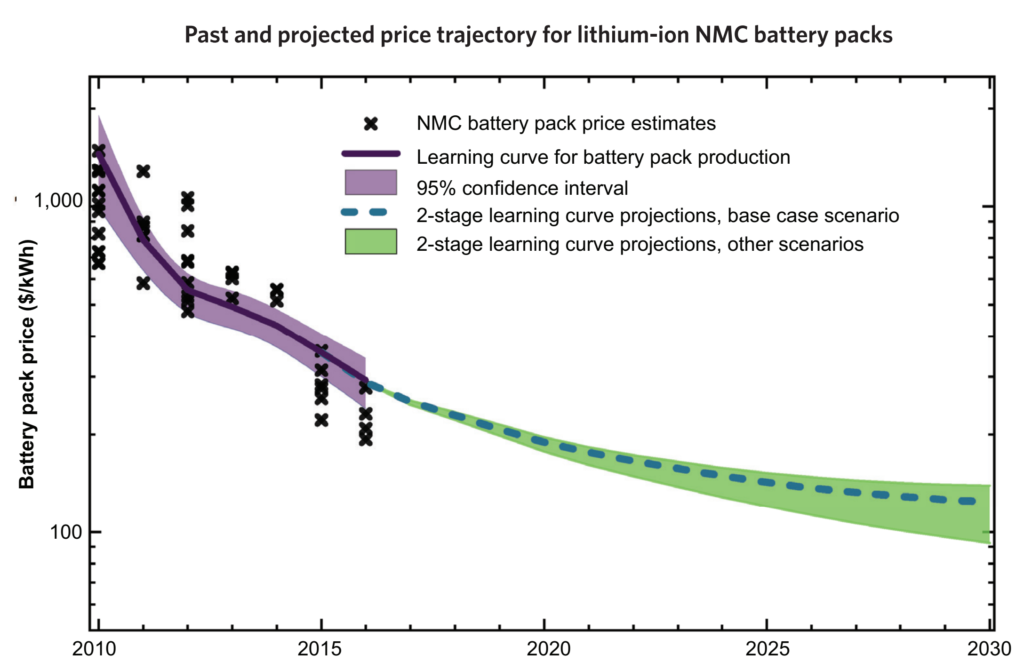
Current lithium-ion battery packs are estimated to cost from around $175 to $300 per kilowatt-hour. (A typical midrange EV has a 60/kWh battery pack.)
A number of commercial and academic researchers have projected that the costs of such batteries will reach $100/kWh by 2025 or before, which many proclaim is the “magic number” where EVs and gas-fueled vehicles reach retail price parity without subsidies. And they would continue to fall from there.
But reaching the $100 threshold by 2030 would require material costs to remain flat for the next decade, during a period when global demand for lithium-ion batteries is expected to rise sharply, MIT’s “Insights into Future Mobility” study notes. It projects that costs will likely fall only to $124 per kilowatt-hour by then. At that point, the “total cost of ownership” between the categories would be about the same, given the additional fuel and maintenance costs of gas-fueled vehicles. (Where these lines cross precisely depends heavily on local fuel costs and vehicle type, among other factors.) […]
The MIT study notes that achieving deep reductions in transportation emissions will require a parallel overhaul of the electricity systems used to charge EVs.
Currently, US carbon emissions per mile for a battery electric vehicle are on average only about 45% less than those from a gas-fueled vehicle of comparable size. That’s because fossil fuels still generate the dominant share of electricity in most markets, and the manufacturing process for EVs generates considerably higher emissions, mainly related to the battery production.
EVs in some US regions, notably including coal states like West Virginia, could generate nearly the same level of emissions as standard vehicles over their lives. In parts of India and China with particularly dirty electricity systems, EVs may even generate more emissions than gas-fueled vehicles, says Emre Gencer, a research scientist who worked on the study. [more]
Why the electric-car revolution may take a lot longer than expected
Mobility of the Future
MITEI’s three-year Mobility of the Future study explored the major factors that will affect the evolution of personal mobility through 2050. Using a scenario-based approach, the diverse study team of MIT faculty, researchers, and students examined how different factors will shape the future of personal mobility at different scales, from global and national markets to policy and mobility choices at the city and individual levels. The study team’s report, Insights into Future Mobility, presents results and findings to help stakeholders anticipate and navigate the challenges that lie ahead.
The study was organized into five main areas of inquiry, each of which focused on a particular aspect or set of influences on the future landscape for personal mobility:
- The potential impact of climate change policies on global fleet composition, fuel consumption, fuel prices, and economic output
- The outlook for vehicle ownership and travel, with a focus on the world’s two largest light-duty vehicle markets—the U.S. and China
- Characteristics of alternative vehicle powertrains and fuels that could affect their future market share
- Infrastructure considerations for charging and fueling, particularly as they affect future demand for electric and hydrogen fuel cell vehicles
- The future of personal mobility in urban areas, with a focus on the potentially disruptive role of autonomous vehicles and ride-hailing services

Motivation
Personal mobility is a central and highly valued feature of human society—indeed, mobility is essential for economies to function and for individuals to access the opportunities they need to thrive. Therefore, the benefits of the technologies and systems that have evolved to enable personal mobility on a large scale are difficult to overstate. However, even as mobility options proliferate, expanding accessibility for many, there is growing concern regarding the long-term sustainability of our transportation systems. Our current transportation systems have a substantial physical footprint, require enormous public and private investment, consume significant energy resources, are a major contributor of anthropogenic greenhouse gas emissions and local air pollutants, and impose many other negative externalities. While these issues apply to all modes, petroleum-powered private vehicles present the greatest opportunity for disruption.
As populations increase and incomes rise, global demand for personal mobility is expected to grow, which adds an urgent dimension to the daunting policy challenges of air pollution, climate change, road safety, congestion, and social exclusion. This is especially true in emerging economies that currently have relatively low levels of vehicle ownership. More than half a billion passenger vehicles could be added to the global fleet by mid-century. Light-duty vehicle travel is expected to increase by roughly 50% in the same timeframe to reach nearly 5 trillion miles per year, raising important questions about resource use, climate and pollution impacts, system capacity, and safety.
Concurrently, and partly in response to these pressures, personal mobility itself is changing. As mobility technologies and services, consumer preferences and behaviors, and transportation policies co-evolve over the coming decades, there is great uncertainty about both the pace of continued change and which mobility options will be adopted. A few things, however, are certain: as the world’s population grows and becomes wealthier, the demand for personal mobility, convenience, and flexibility will increase. As the world urbanizes, mobility solutions will need to become more compatible with the density of activities concentrated in cities. As the world responds to environmental concerns, powertrains and fuels must evolve to become more sustainable. And as disruptive technologies and business models develop, some conventional lifestyles regarding car-ownership, shopping, and commuting may yield to the shared economy, e-commerce, and telecommuting. The forces involved are complex and sometimes in conflict but they have the potential to shape a mobility landscape that looks very different from today’s. [more]