Doomiest Graphs of 2021
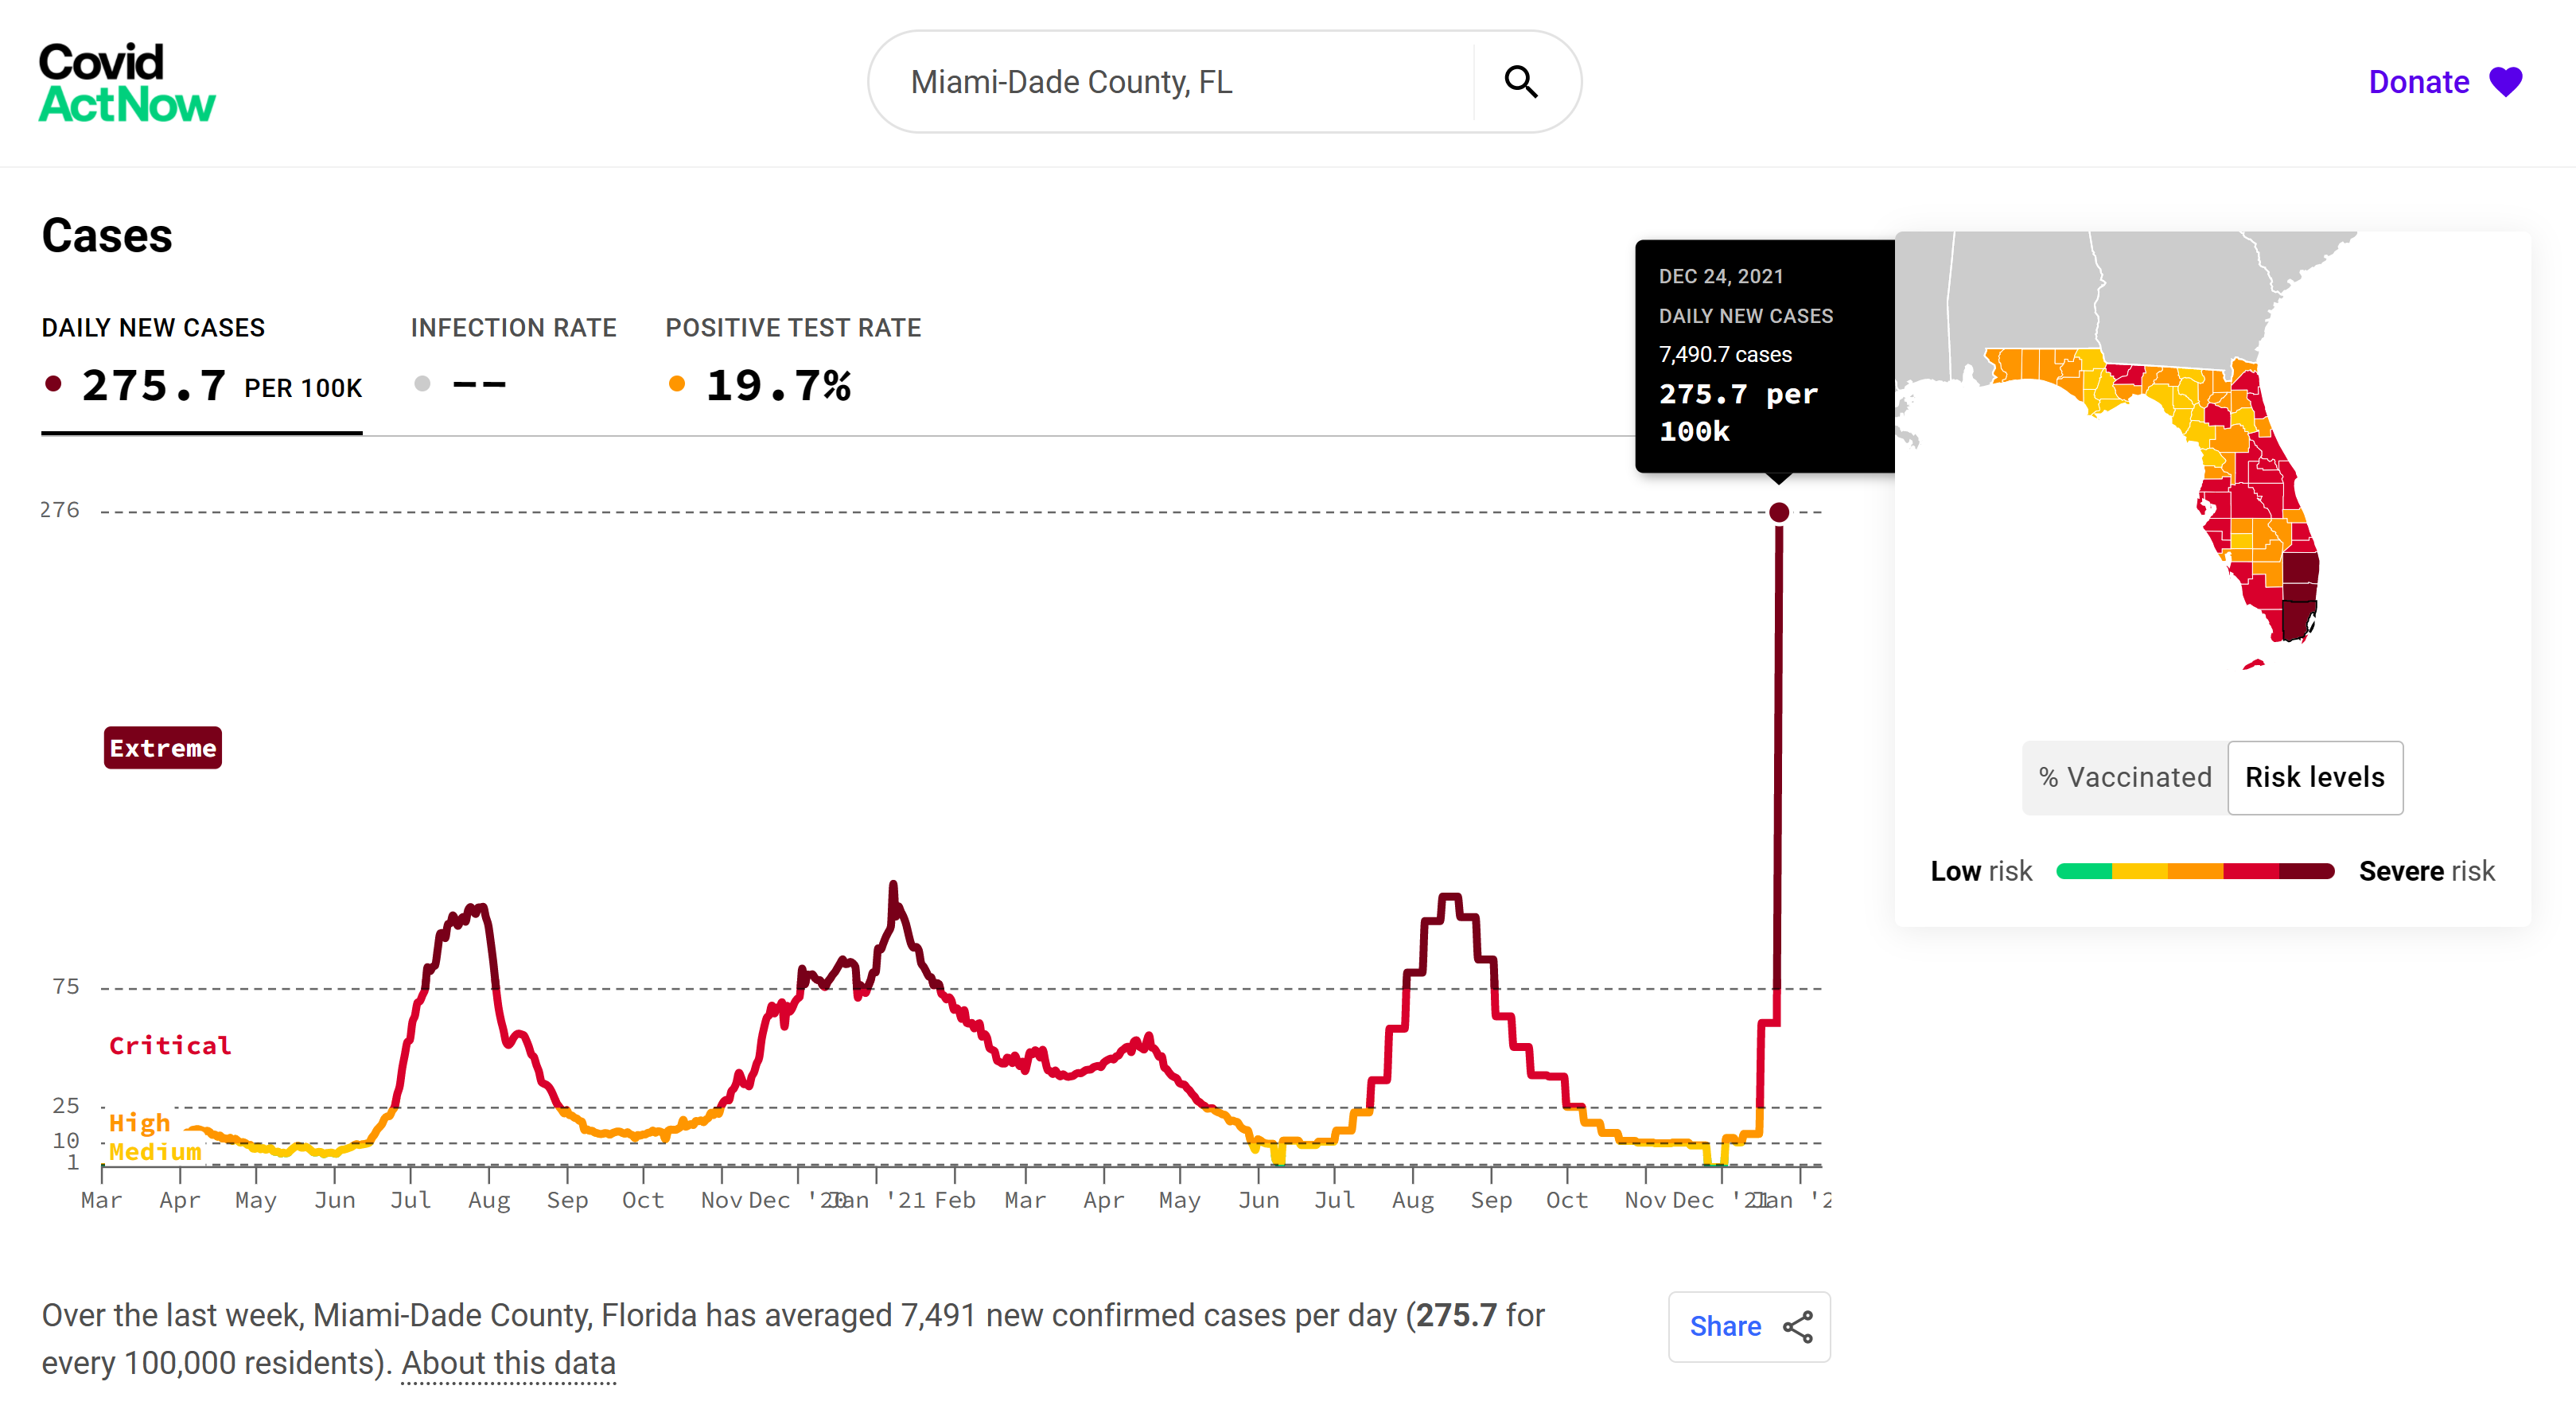
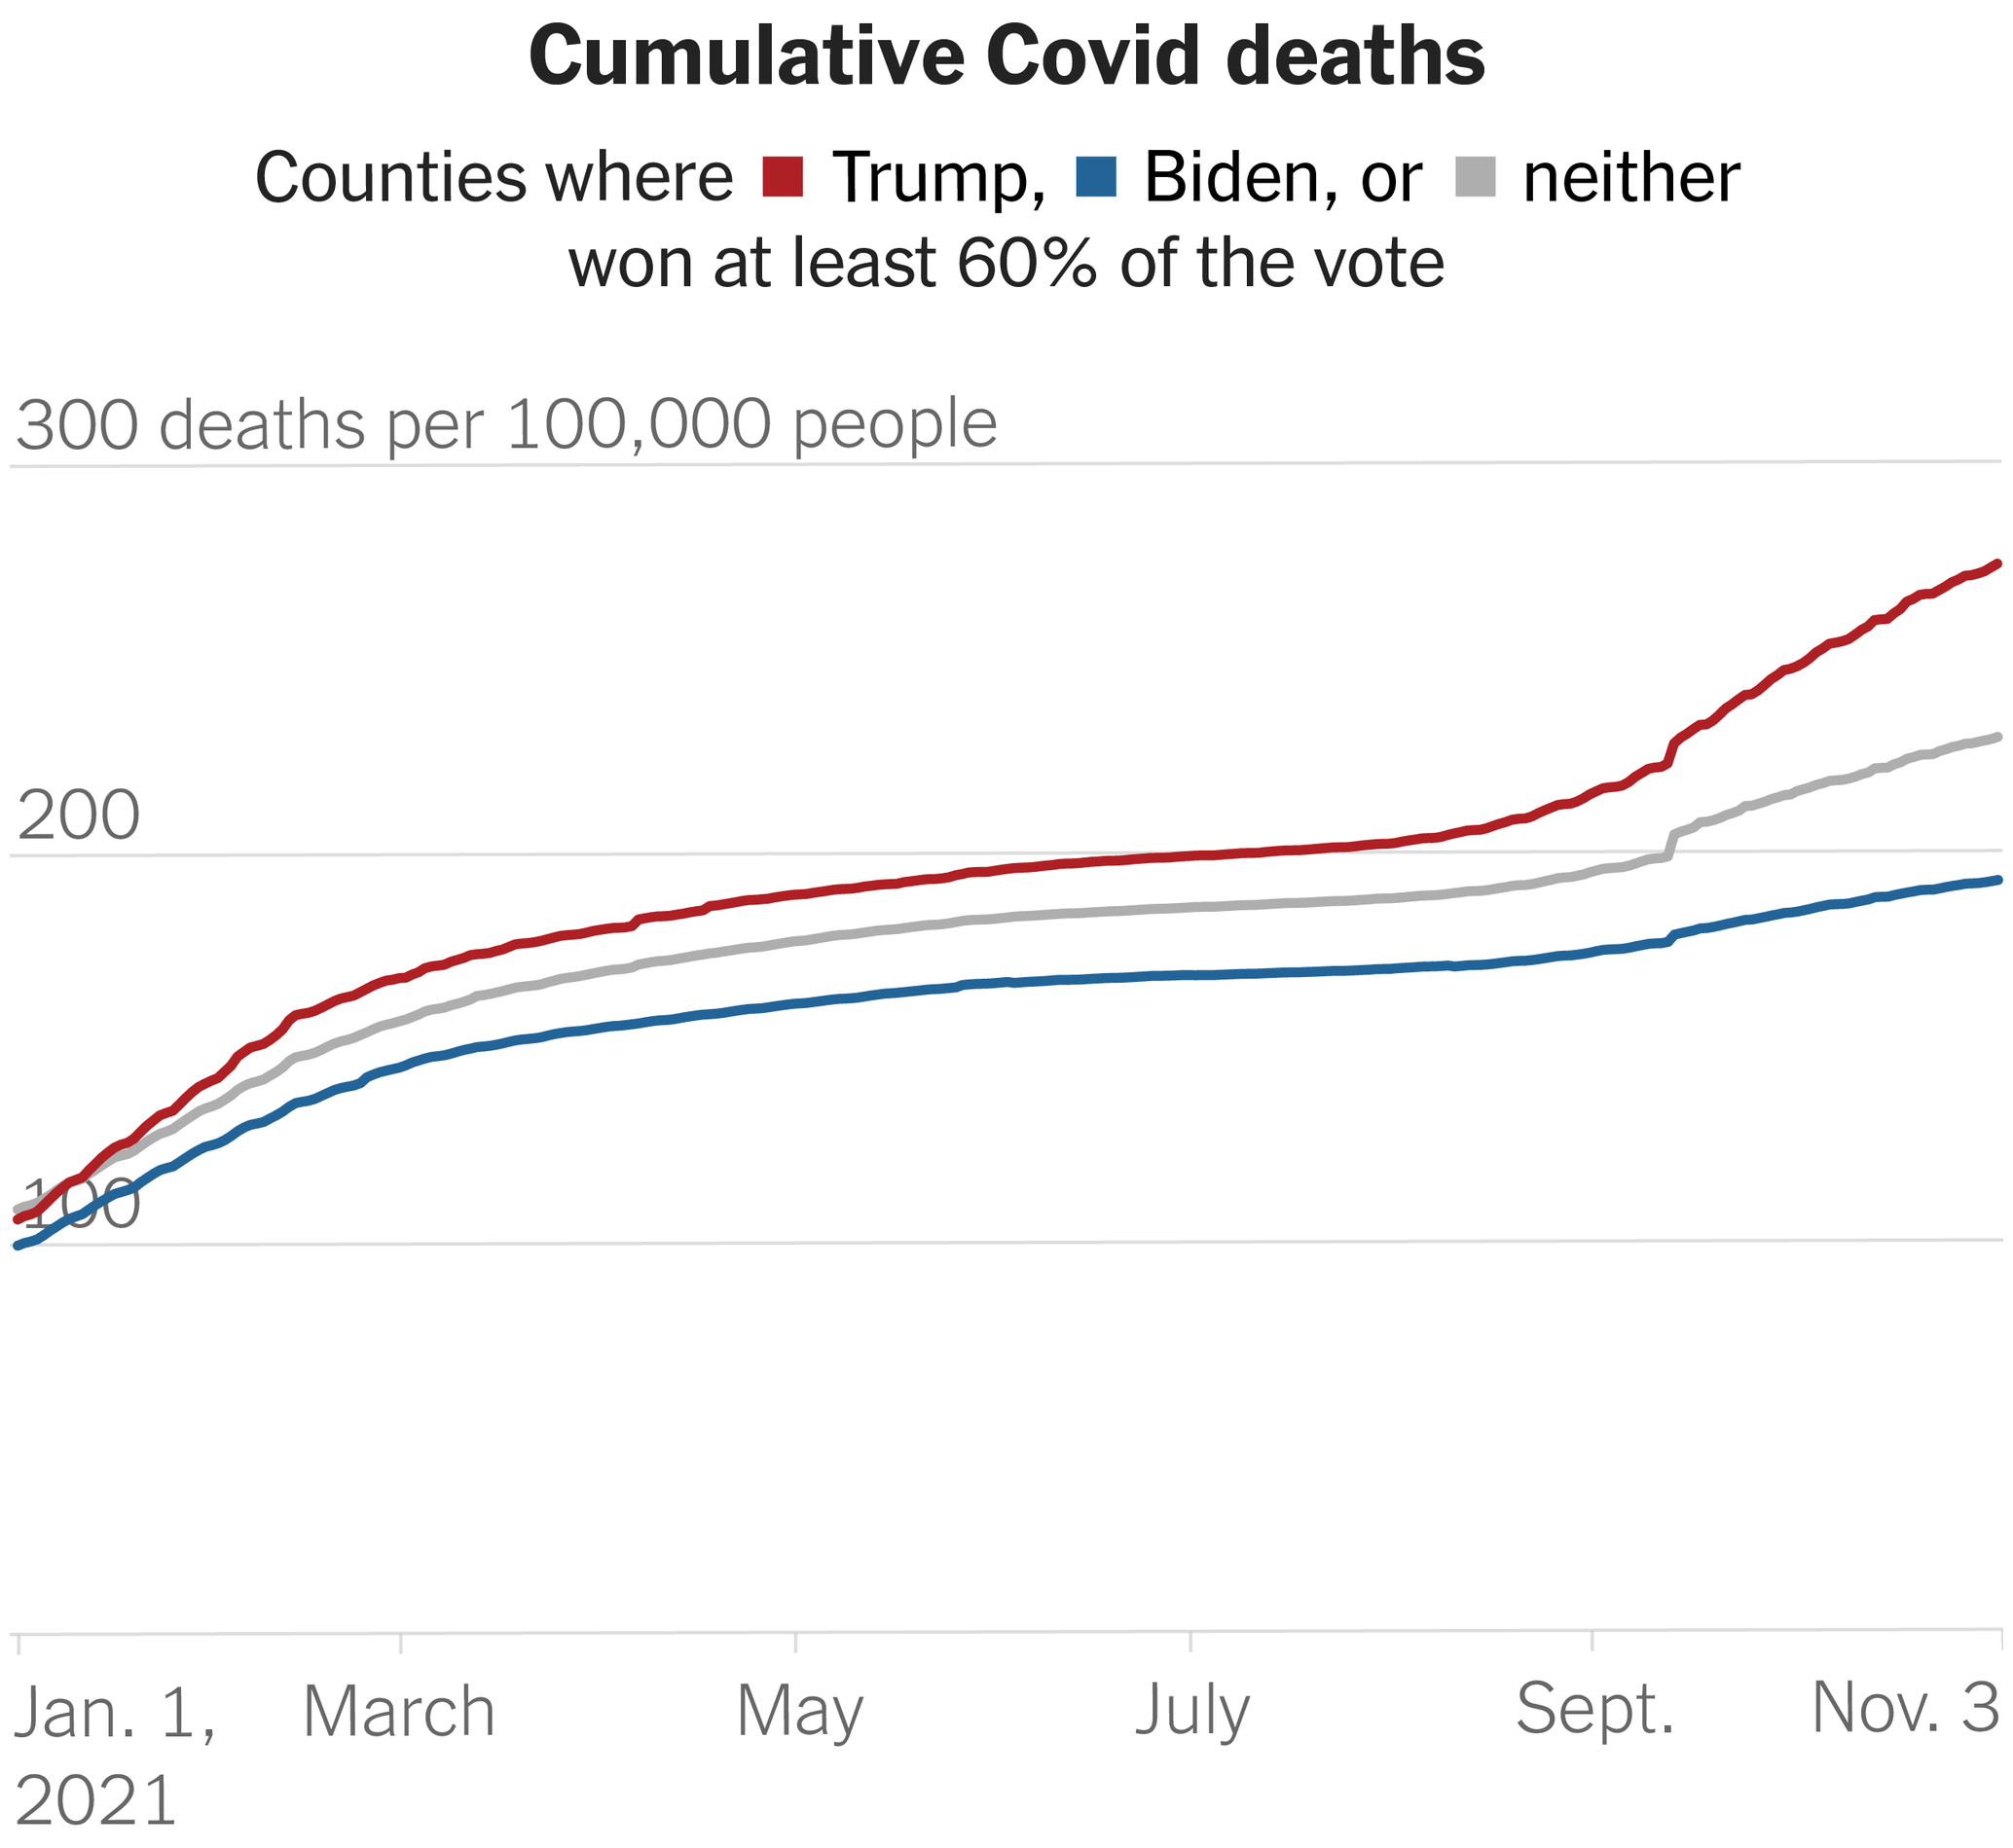
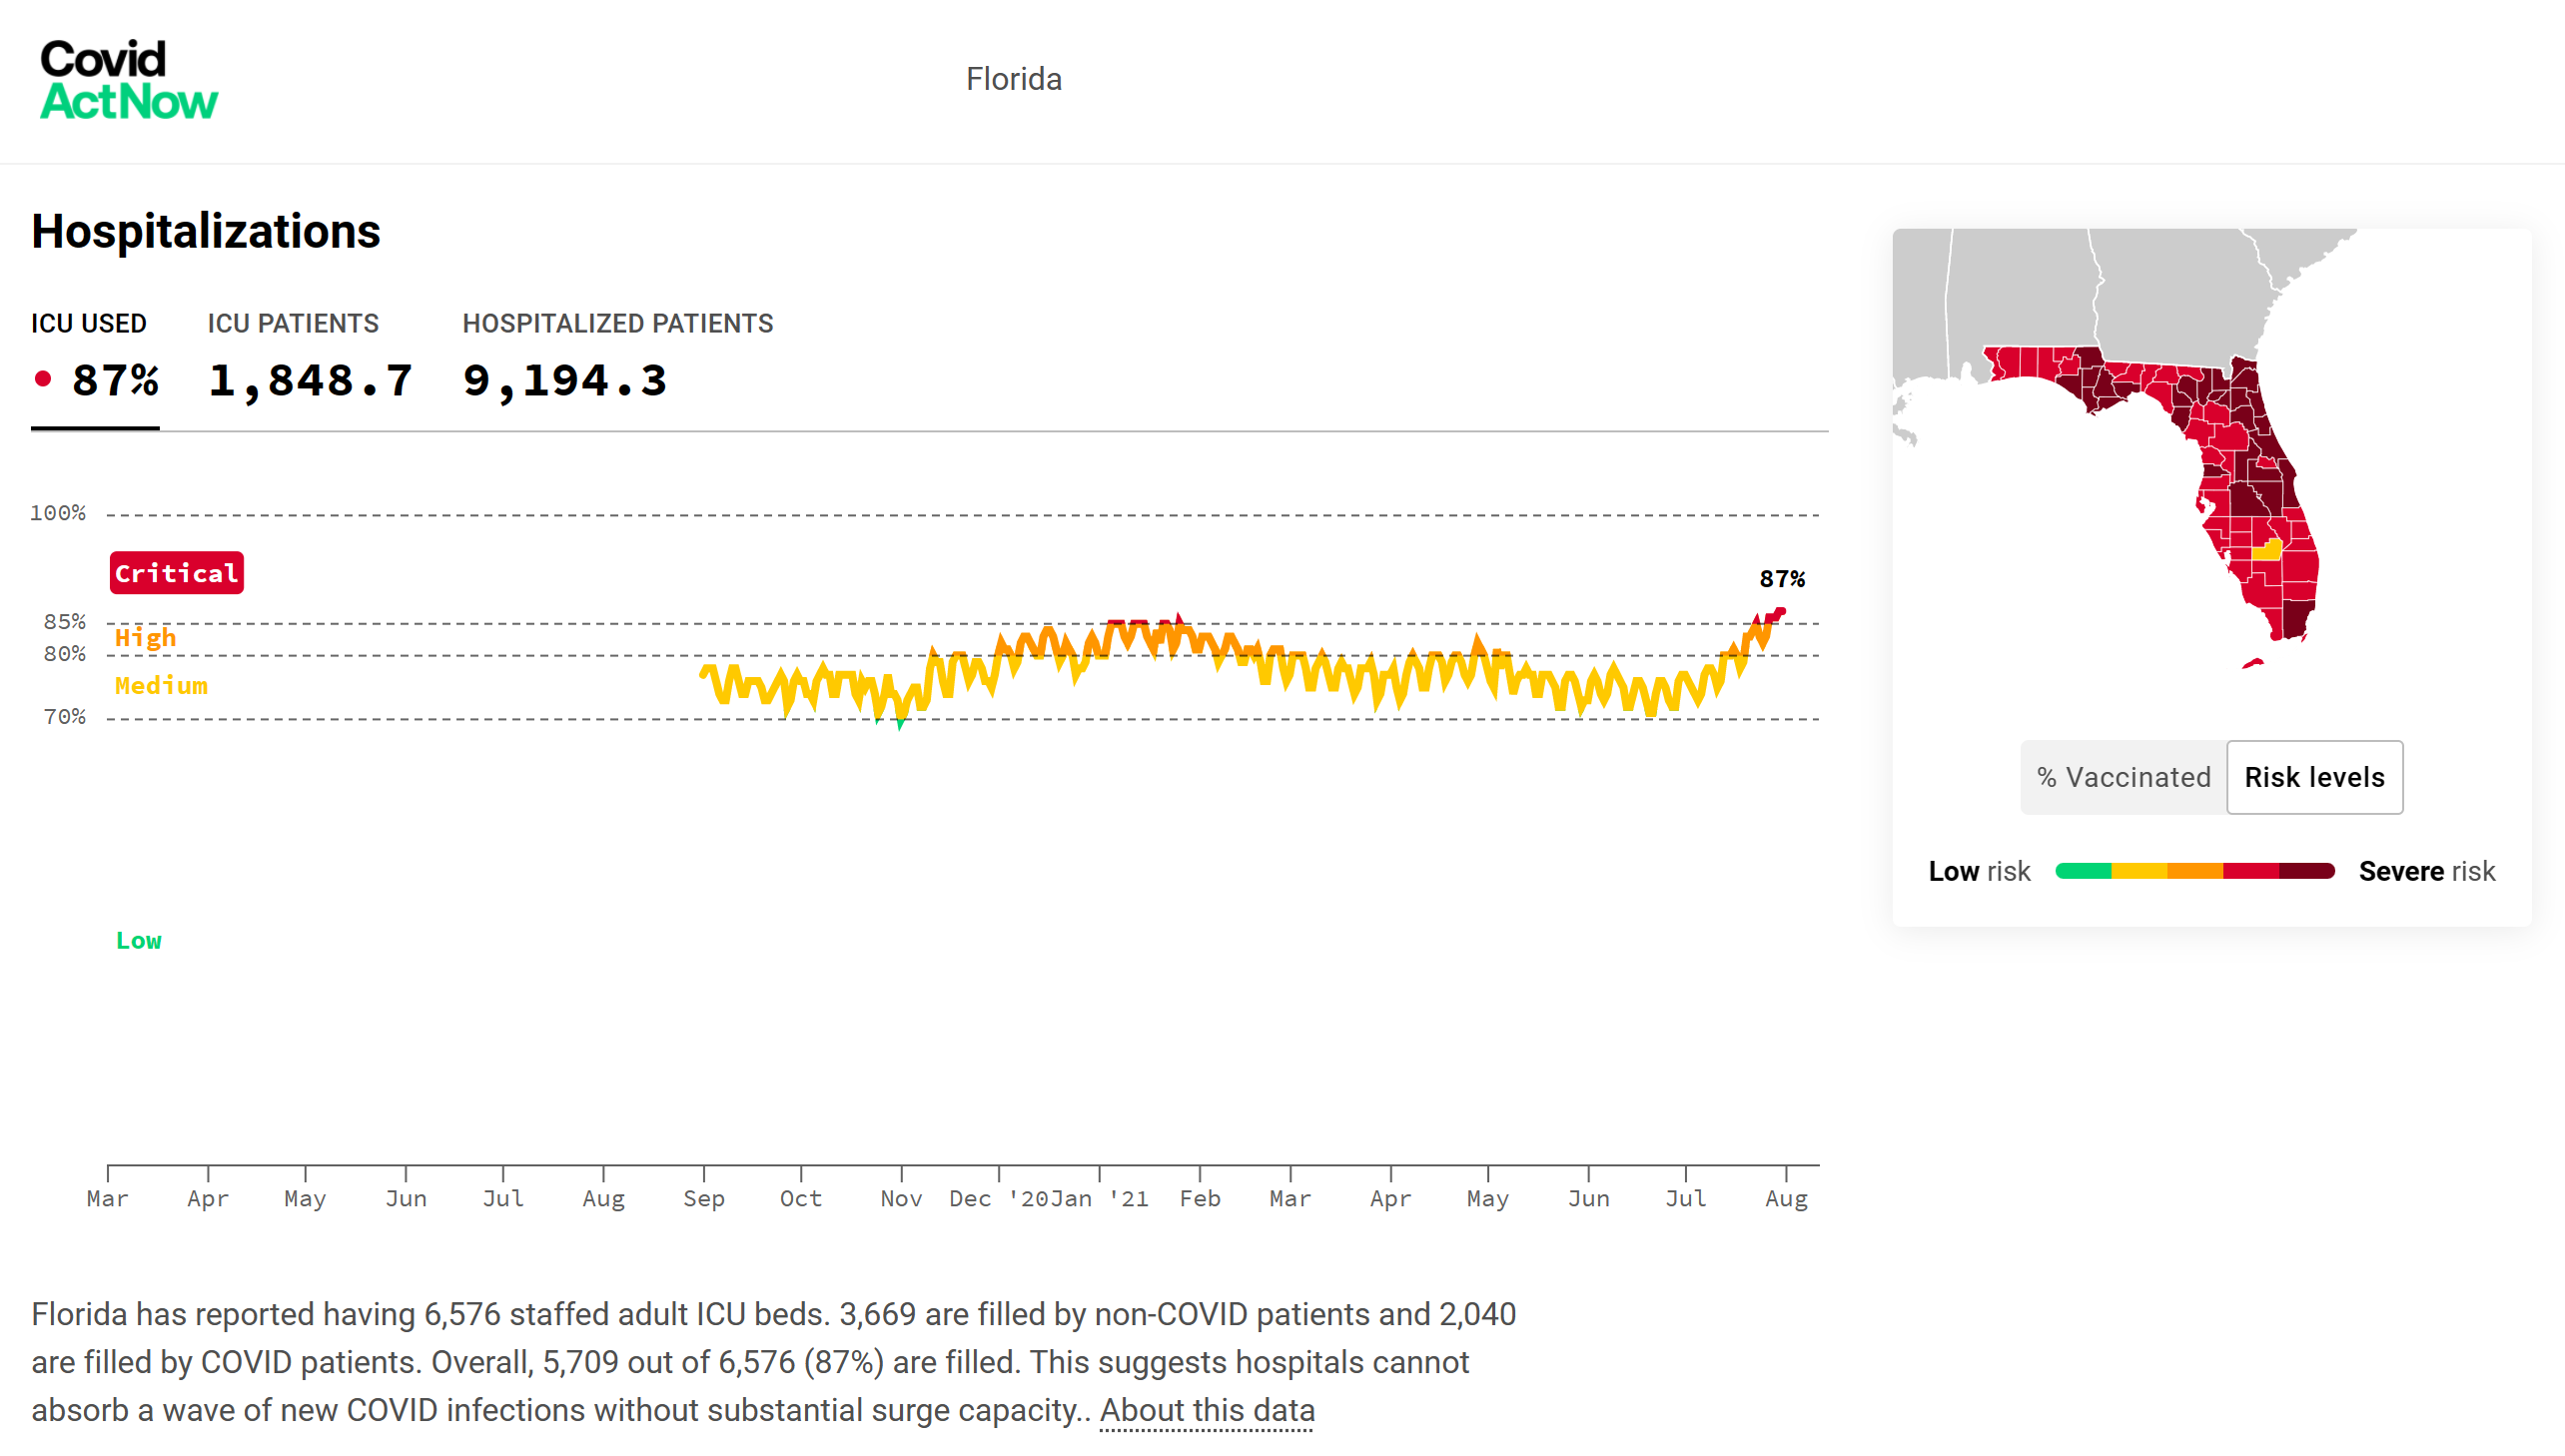
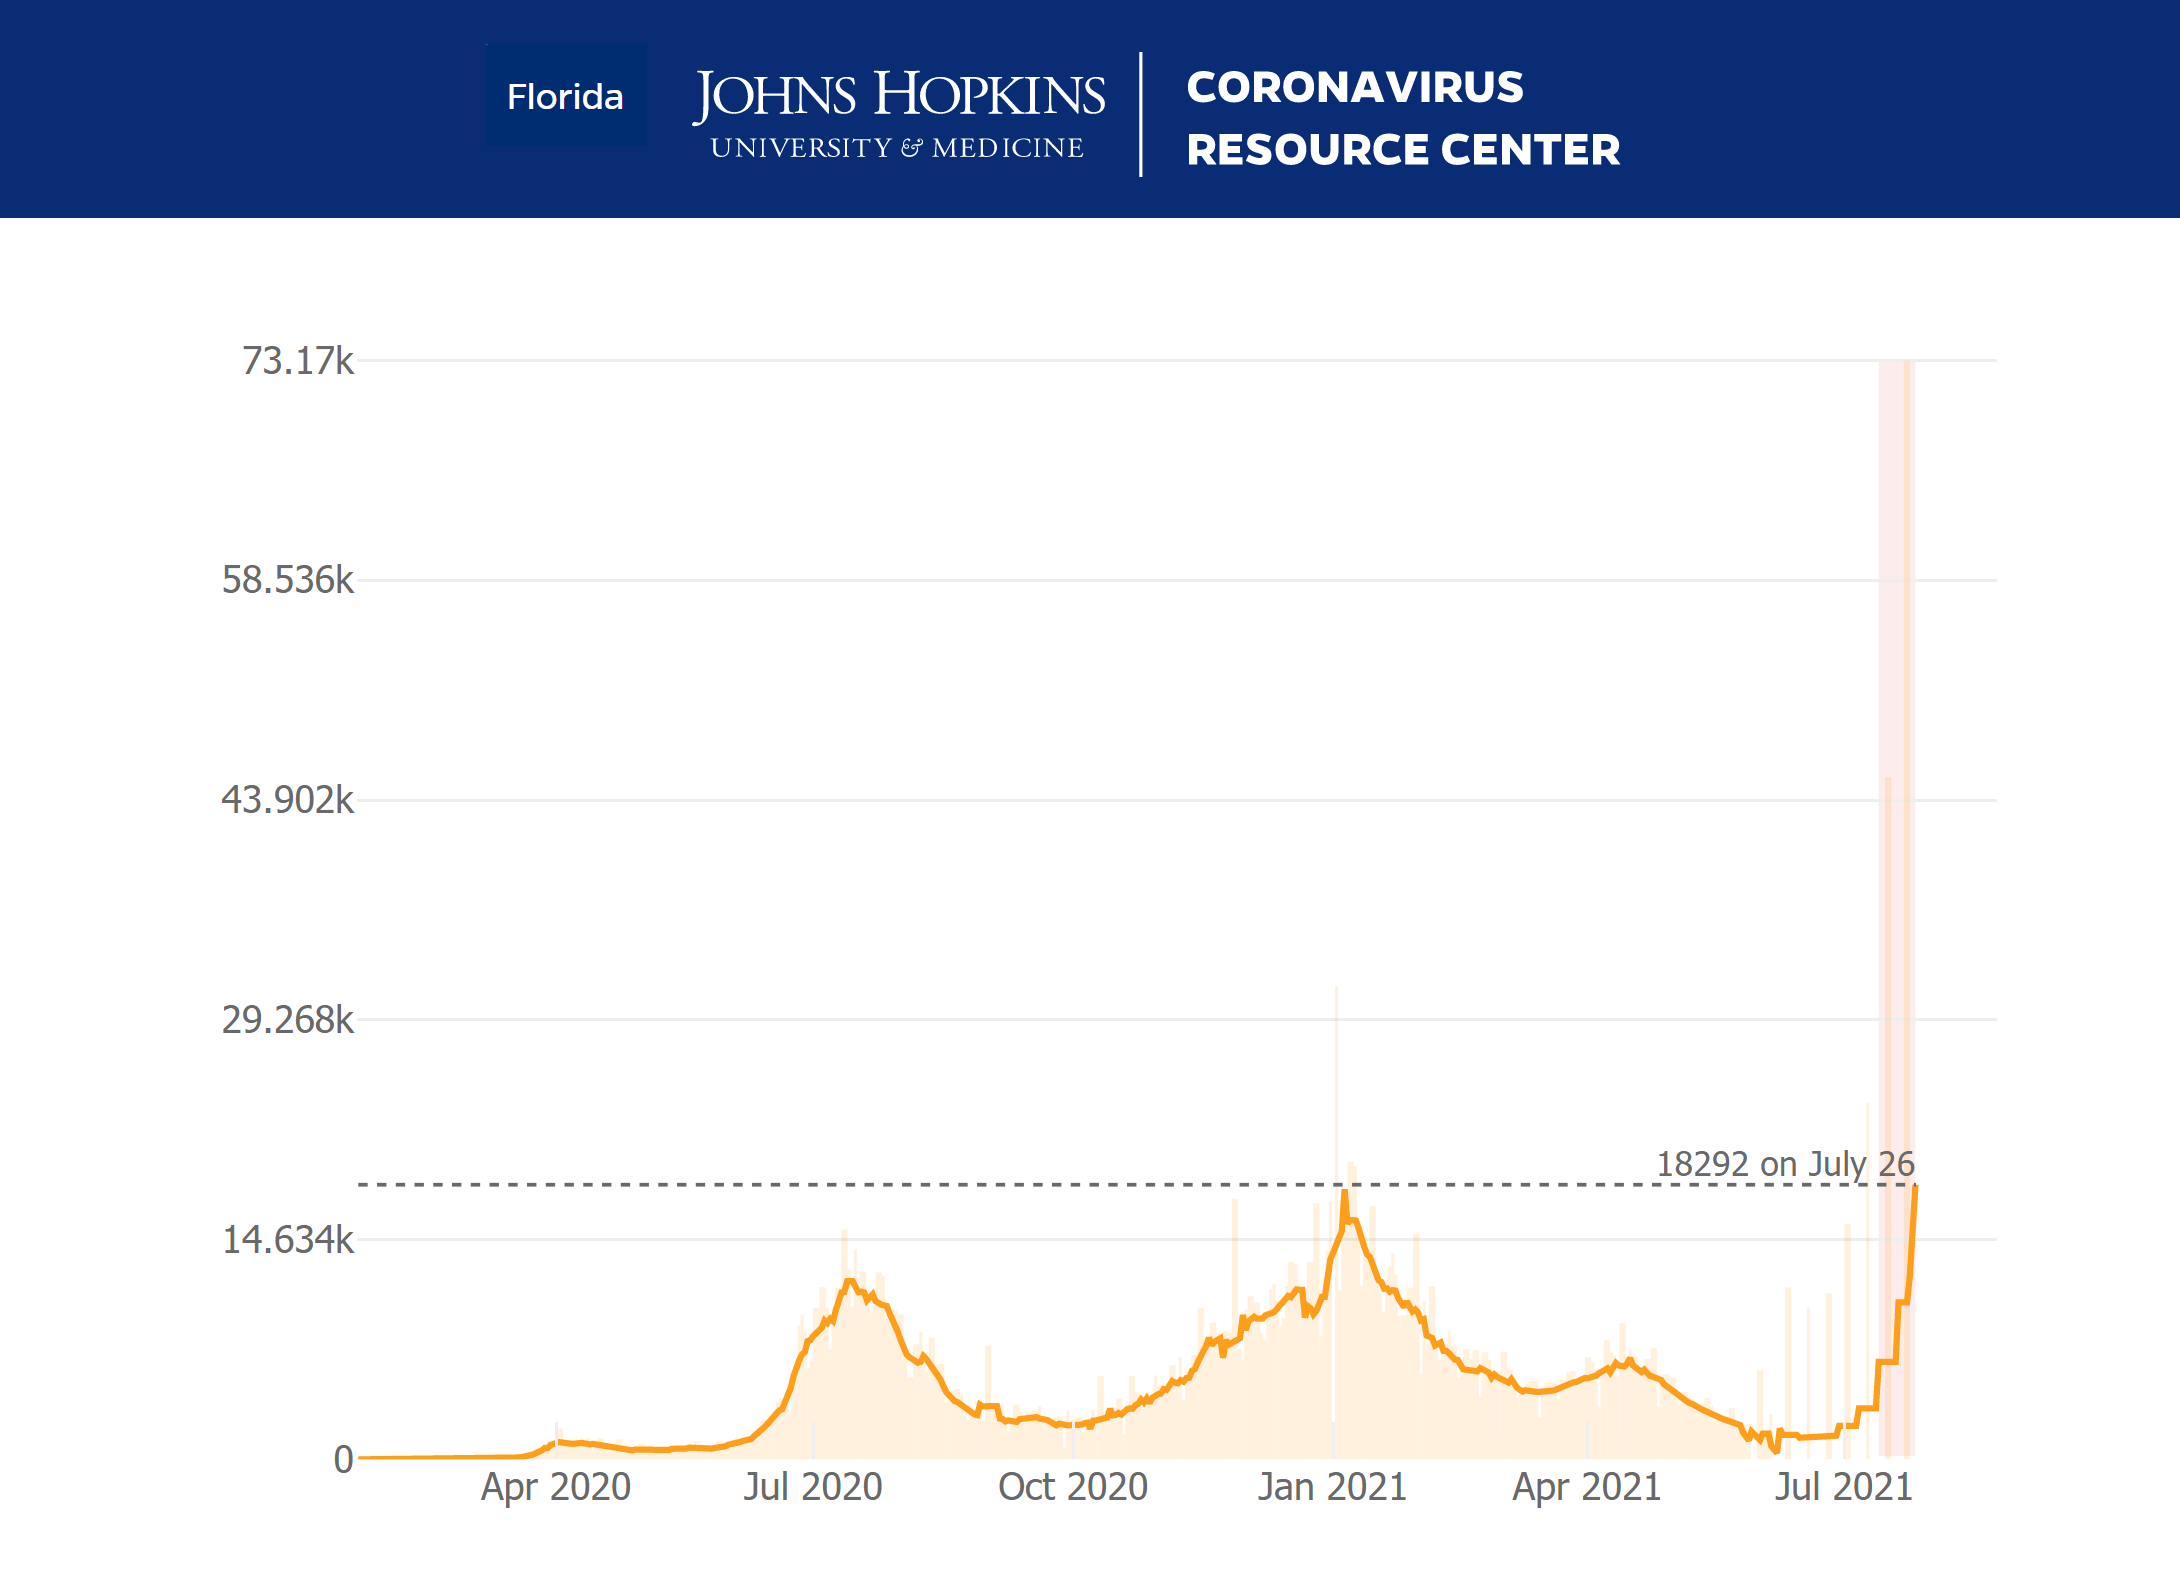
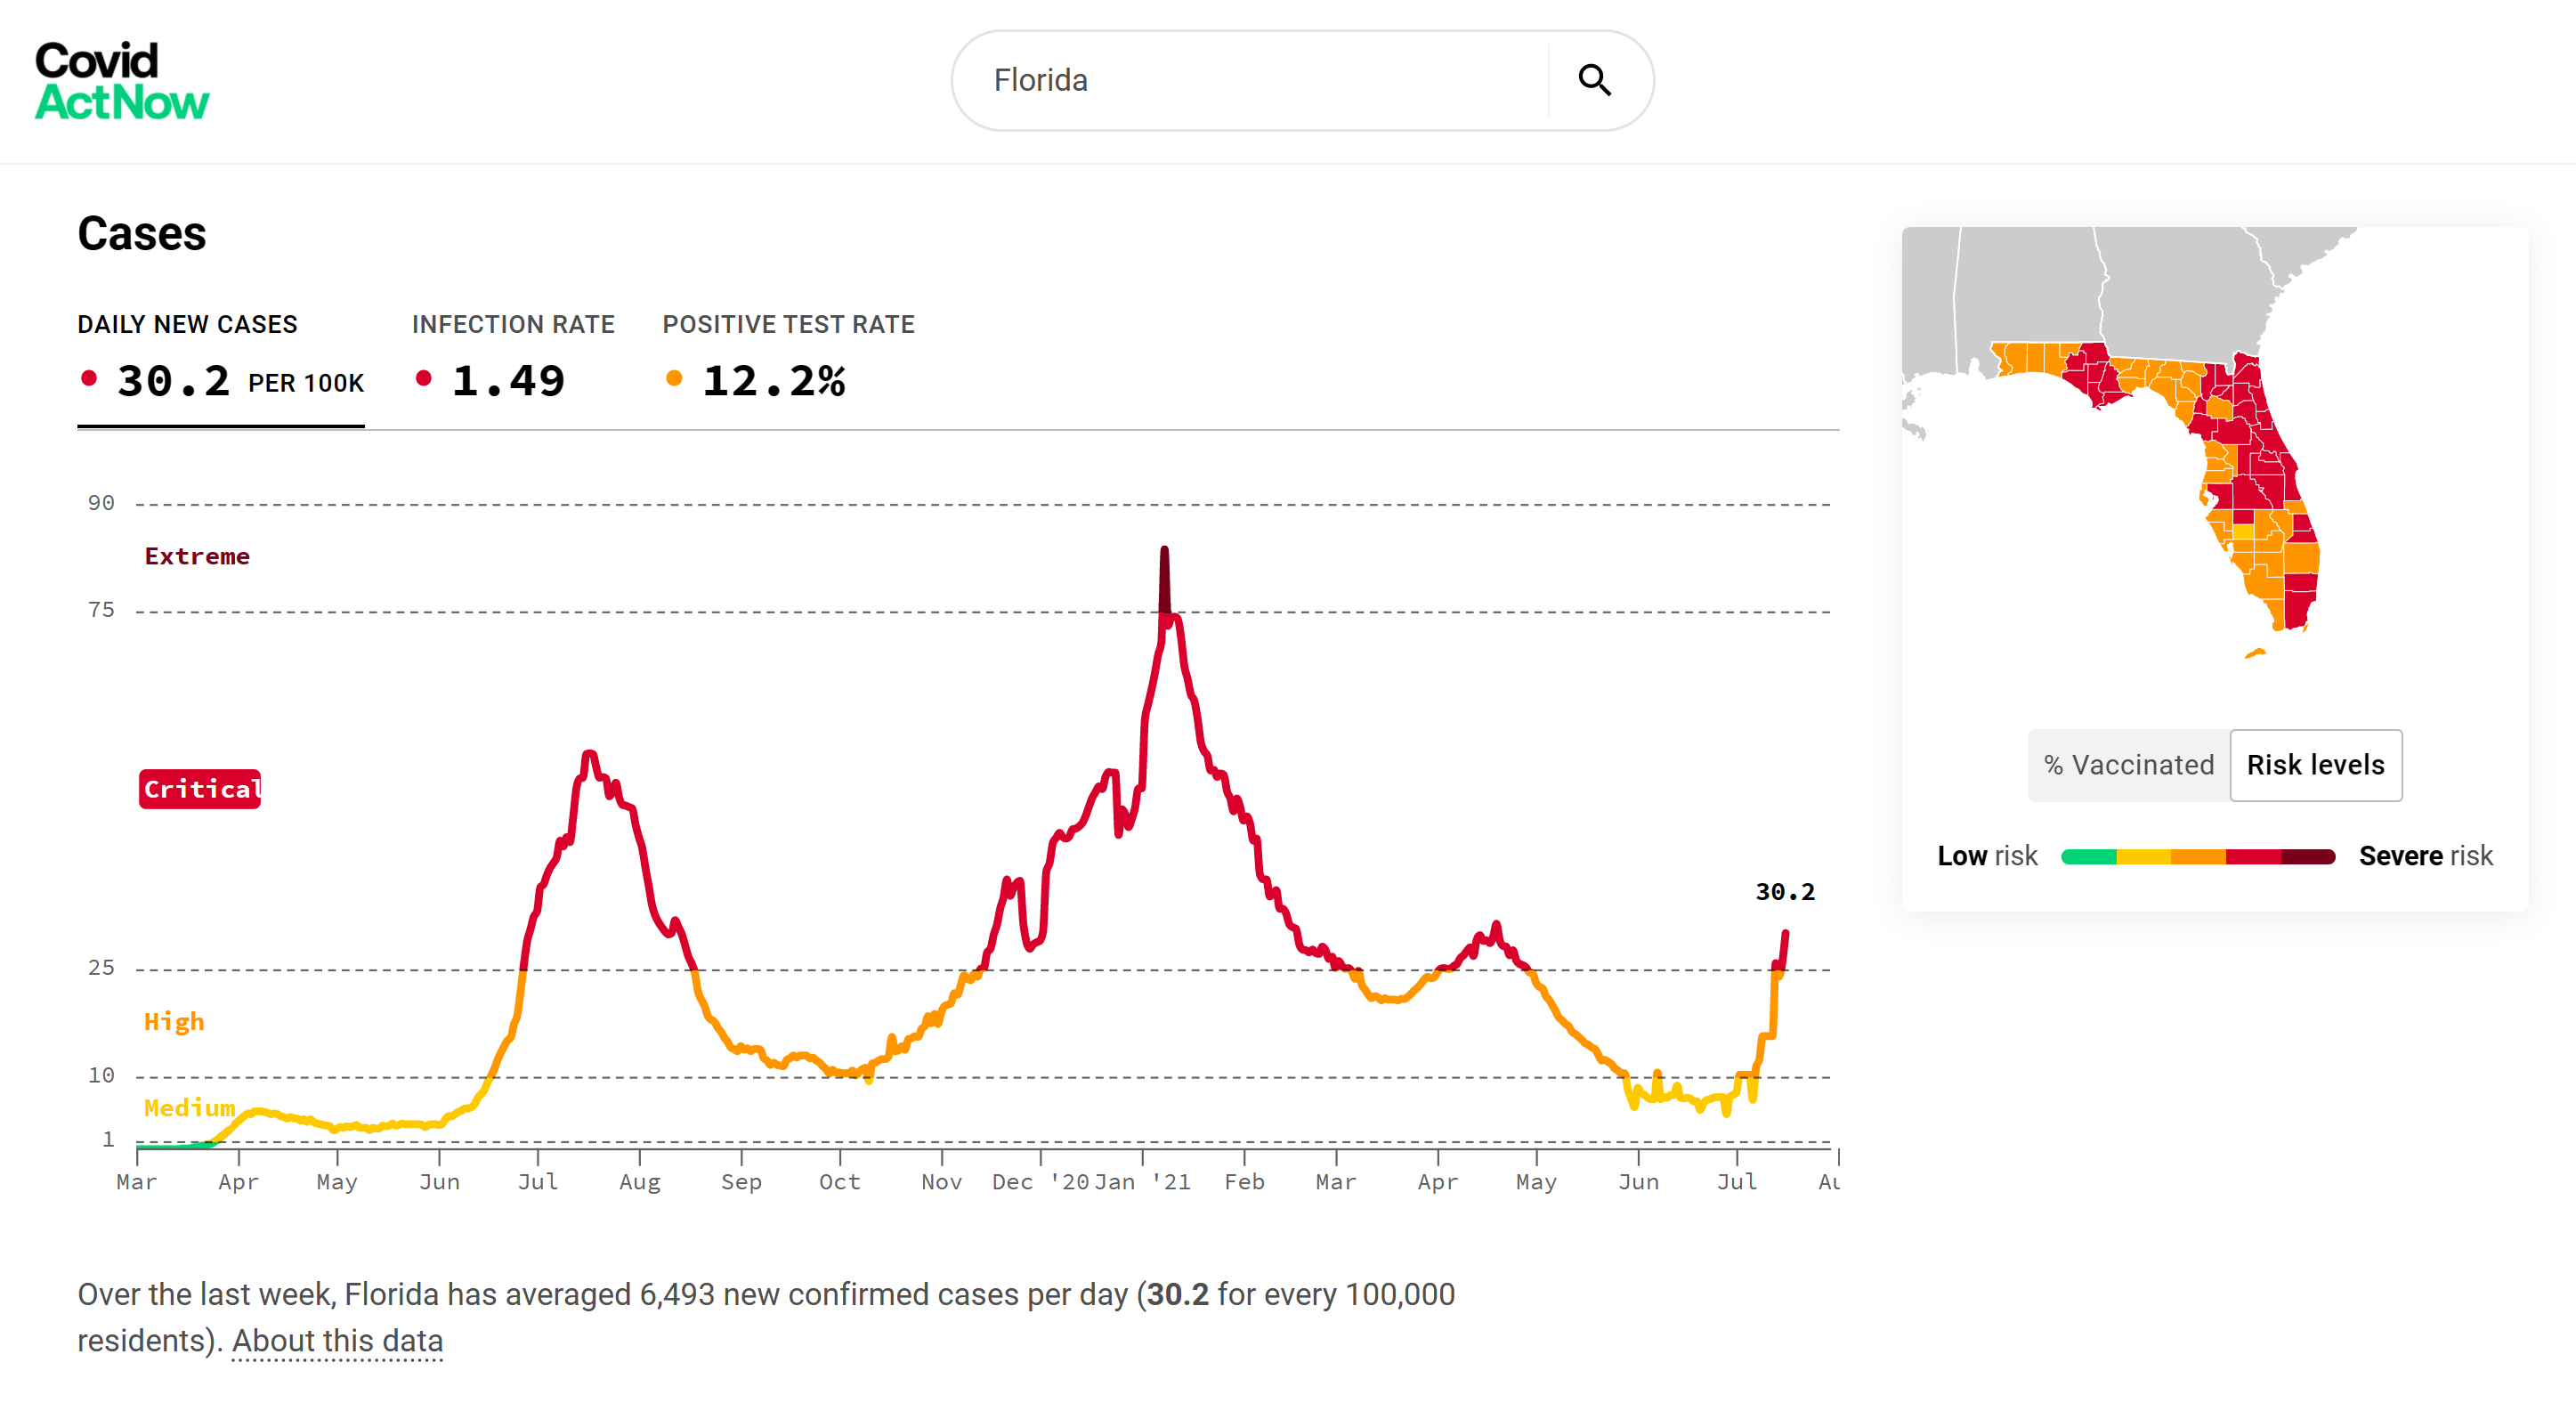
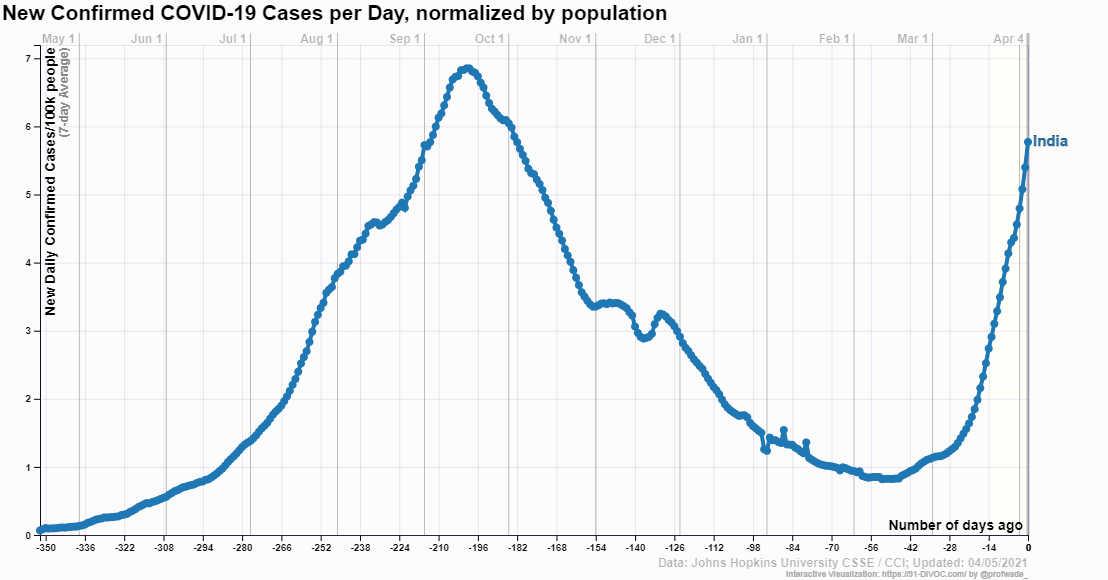
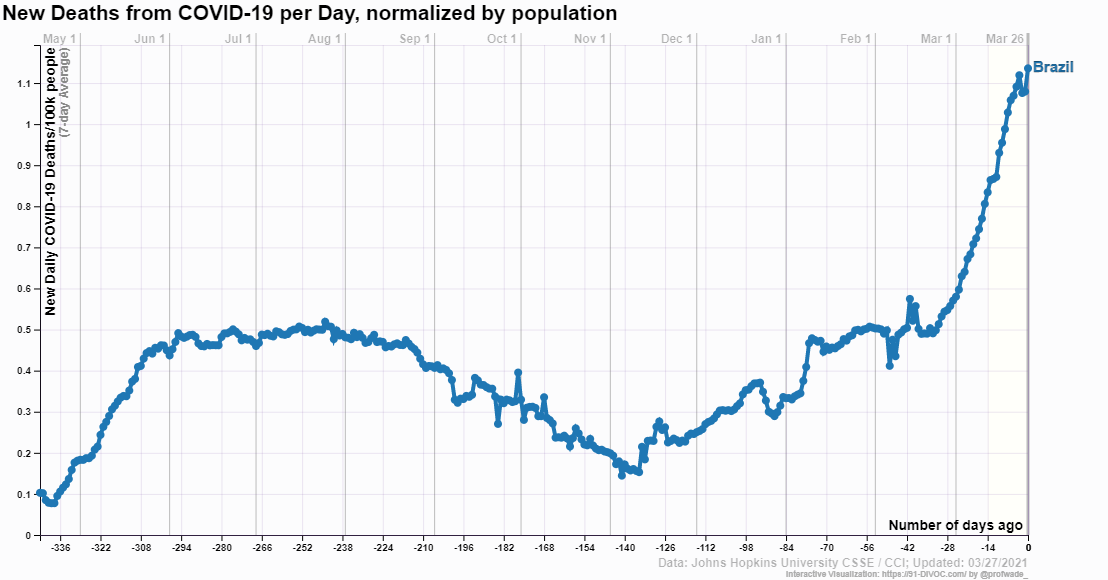
31 December 2021 (Desdemona Despair) – For Des, 2021 was the second year of studying pandemic numbers daily and obsessively. In the U.S., the go-to site was Covid Act Now, which presents the latest data at the county level. Tracking the changing numbers every day was like watching the weather report, but with mass death instead of rain. Des also kept an eye on 91-DIVOC, which compares data between various nations.
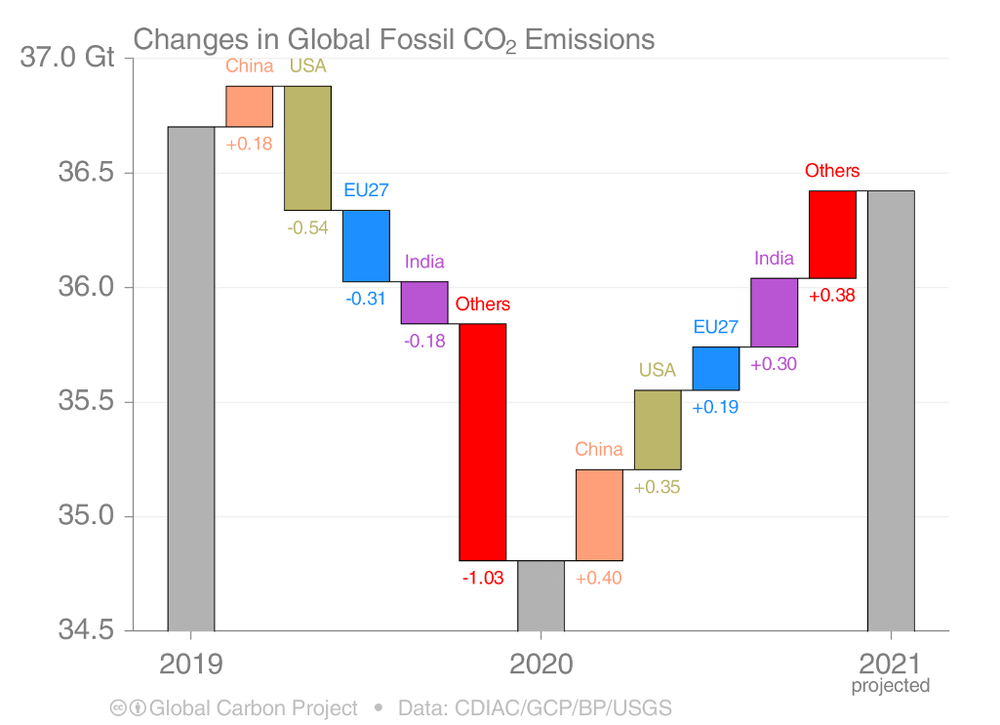
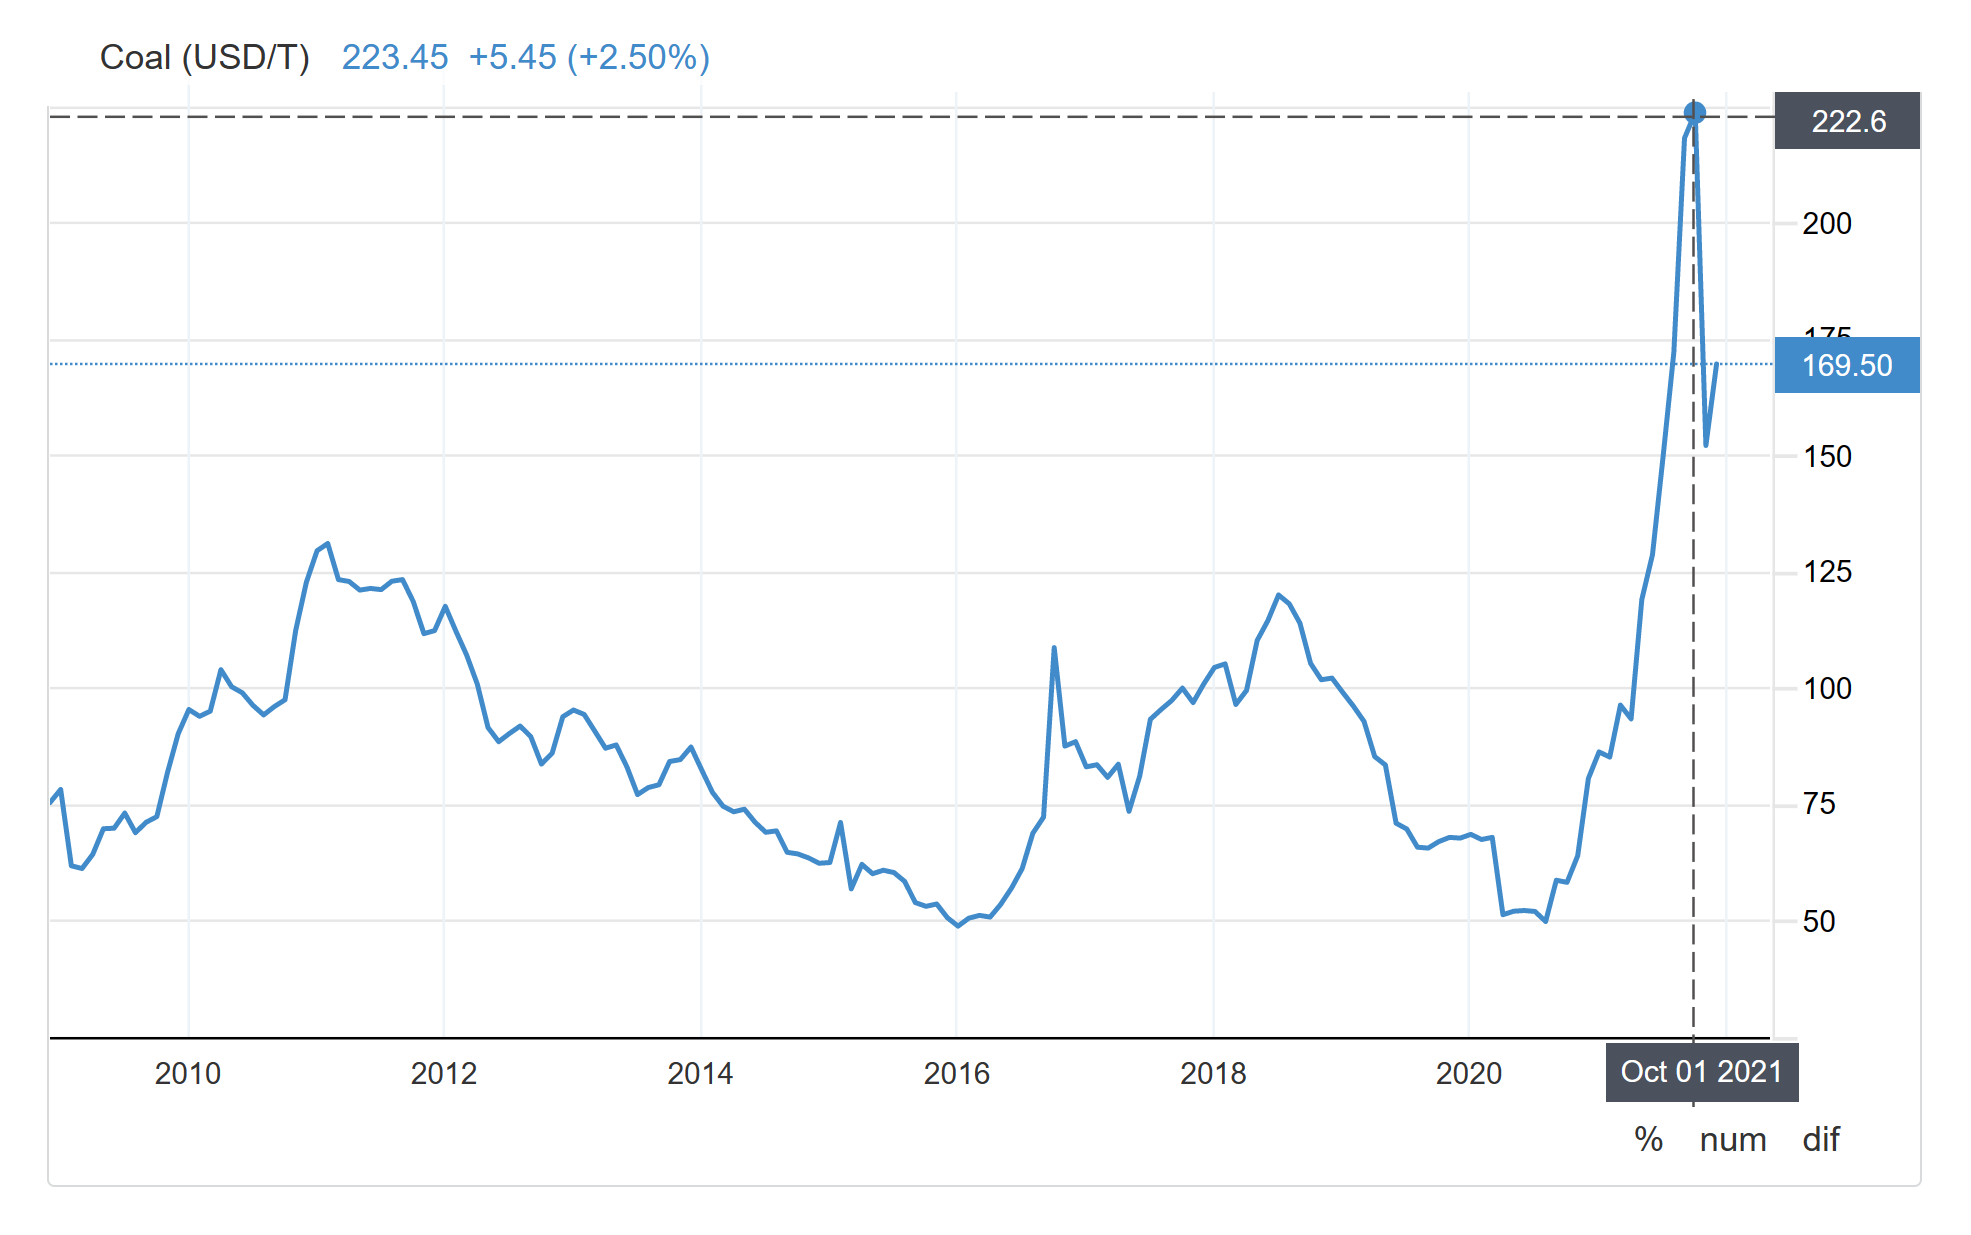
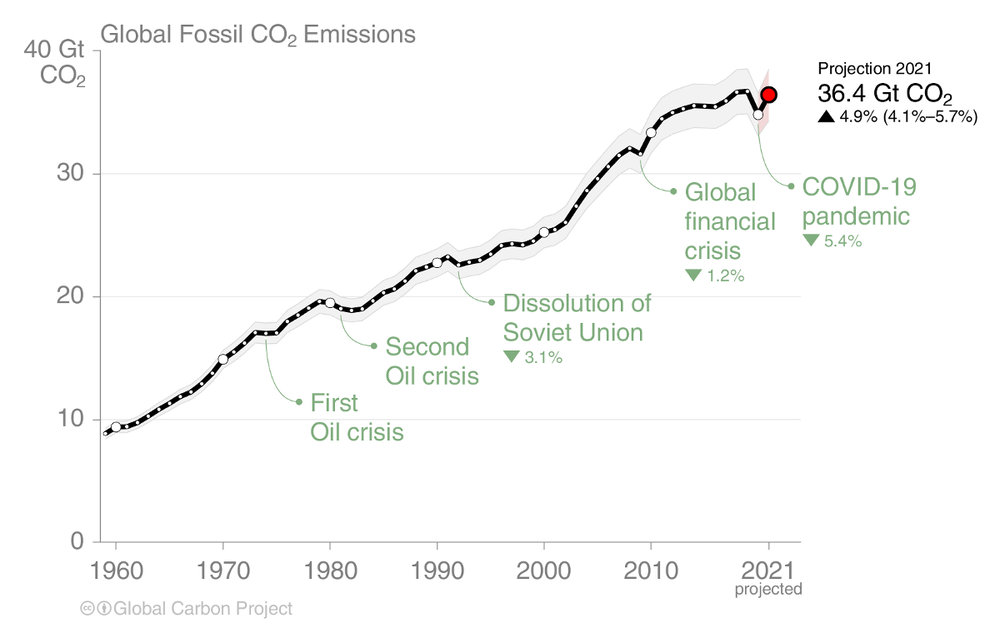
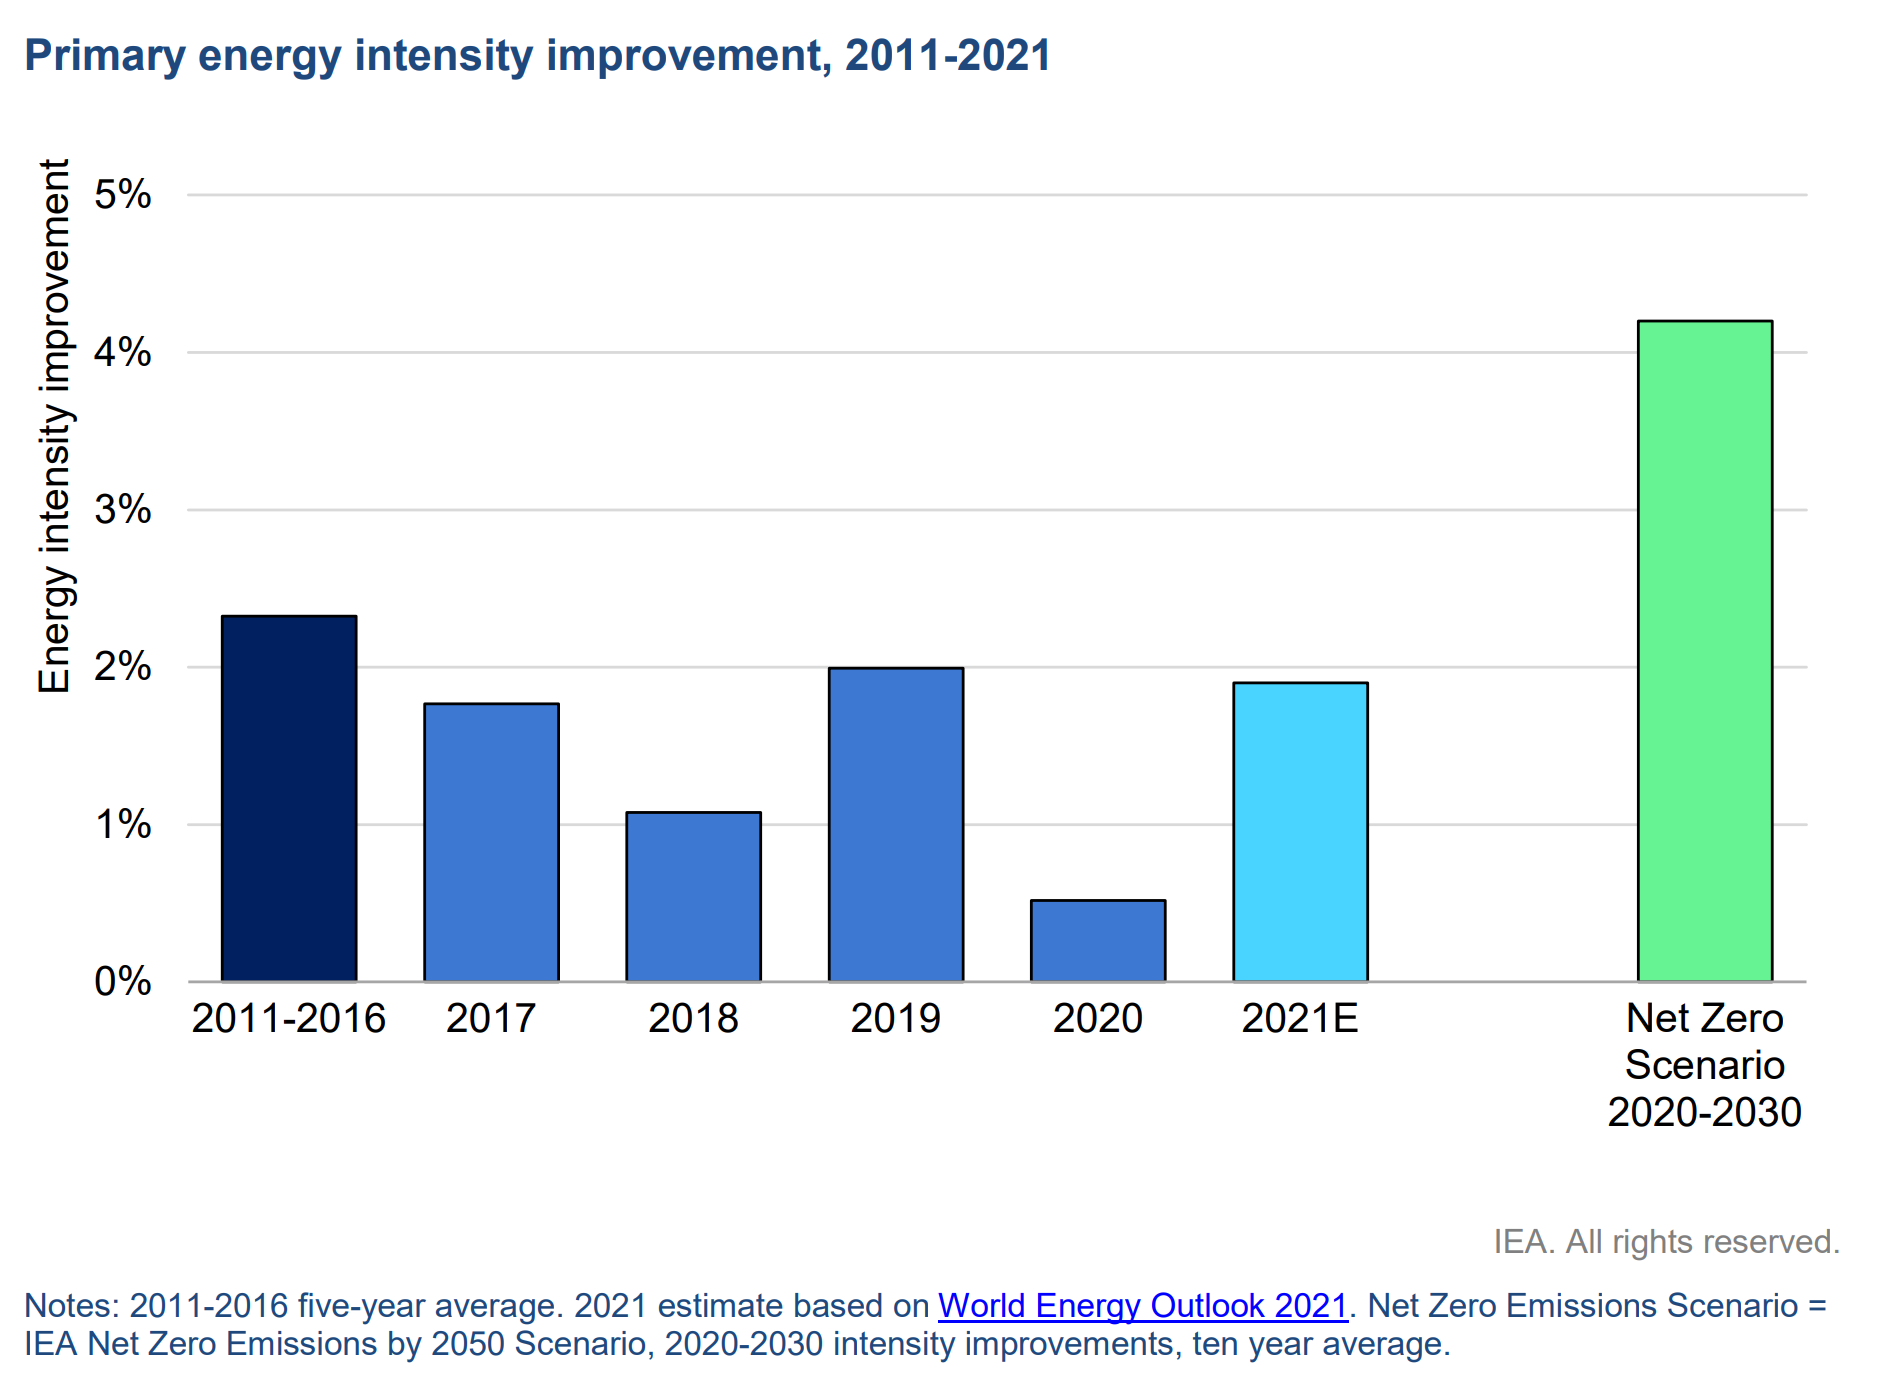
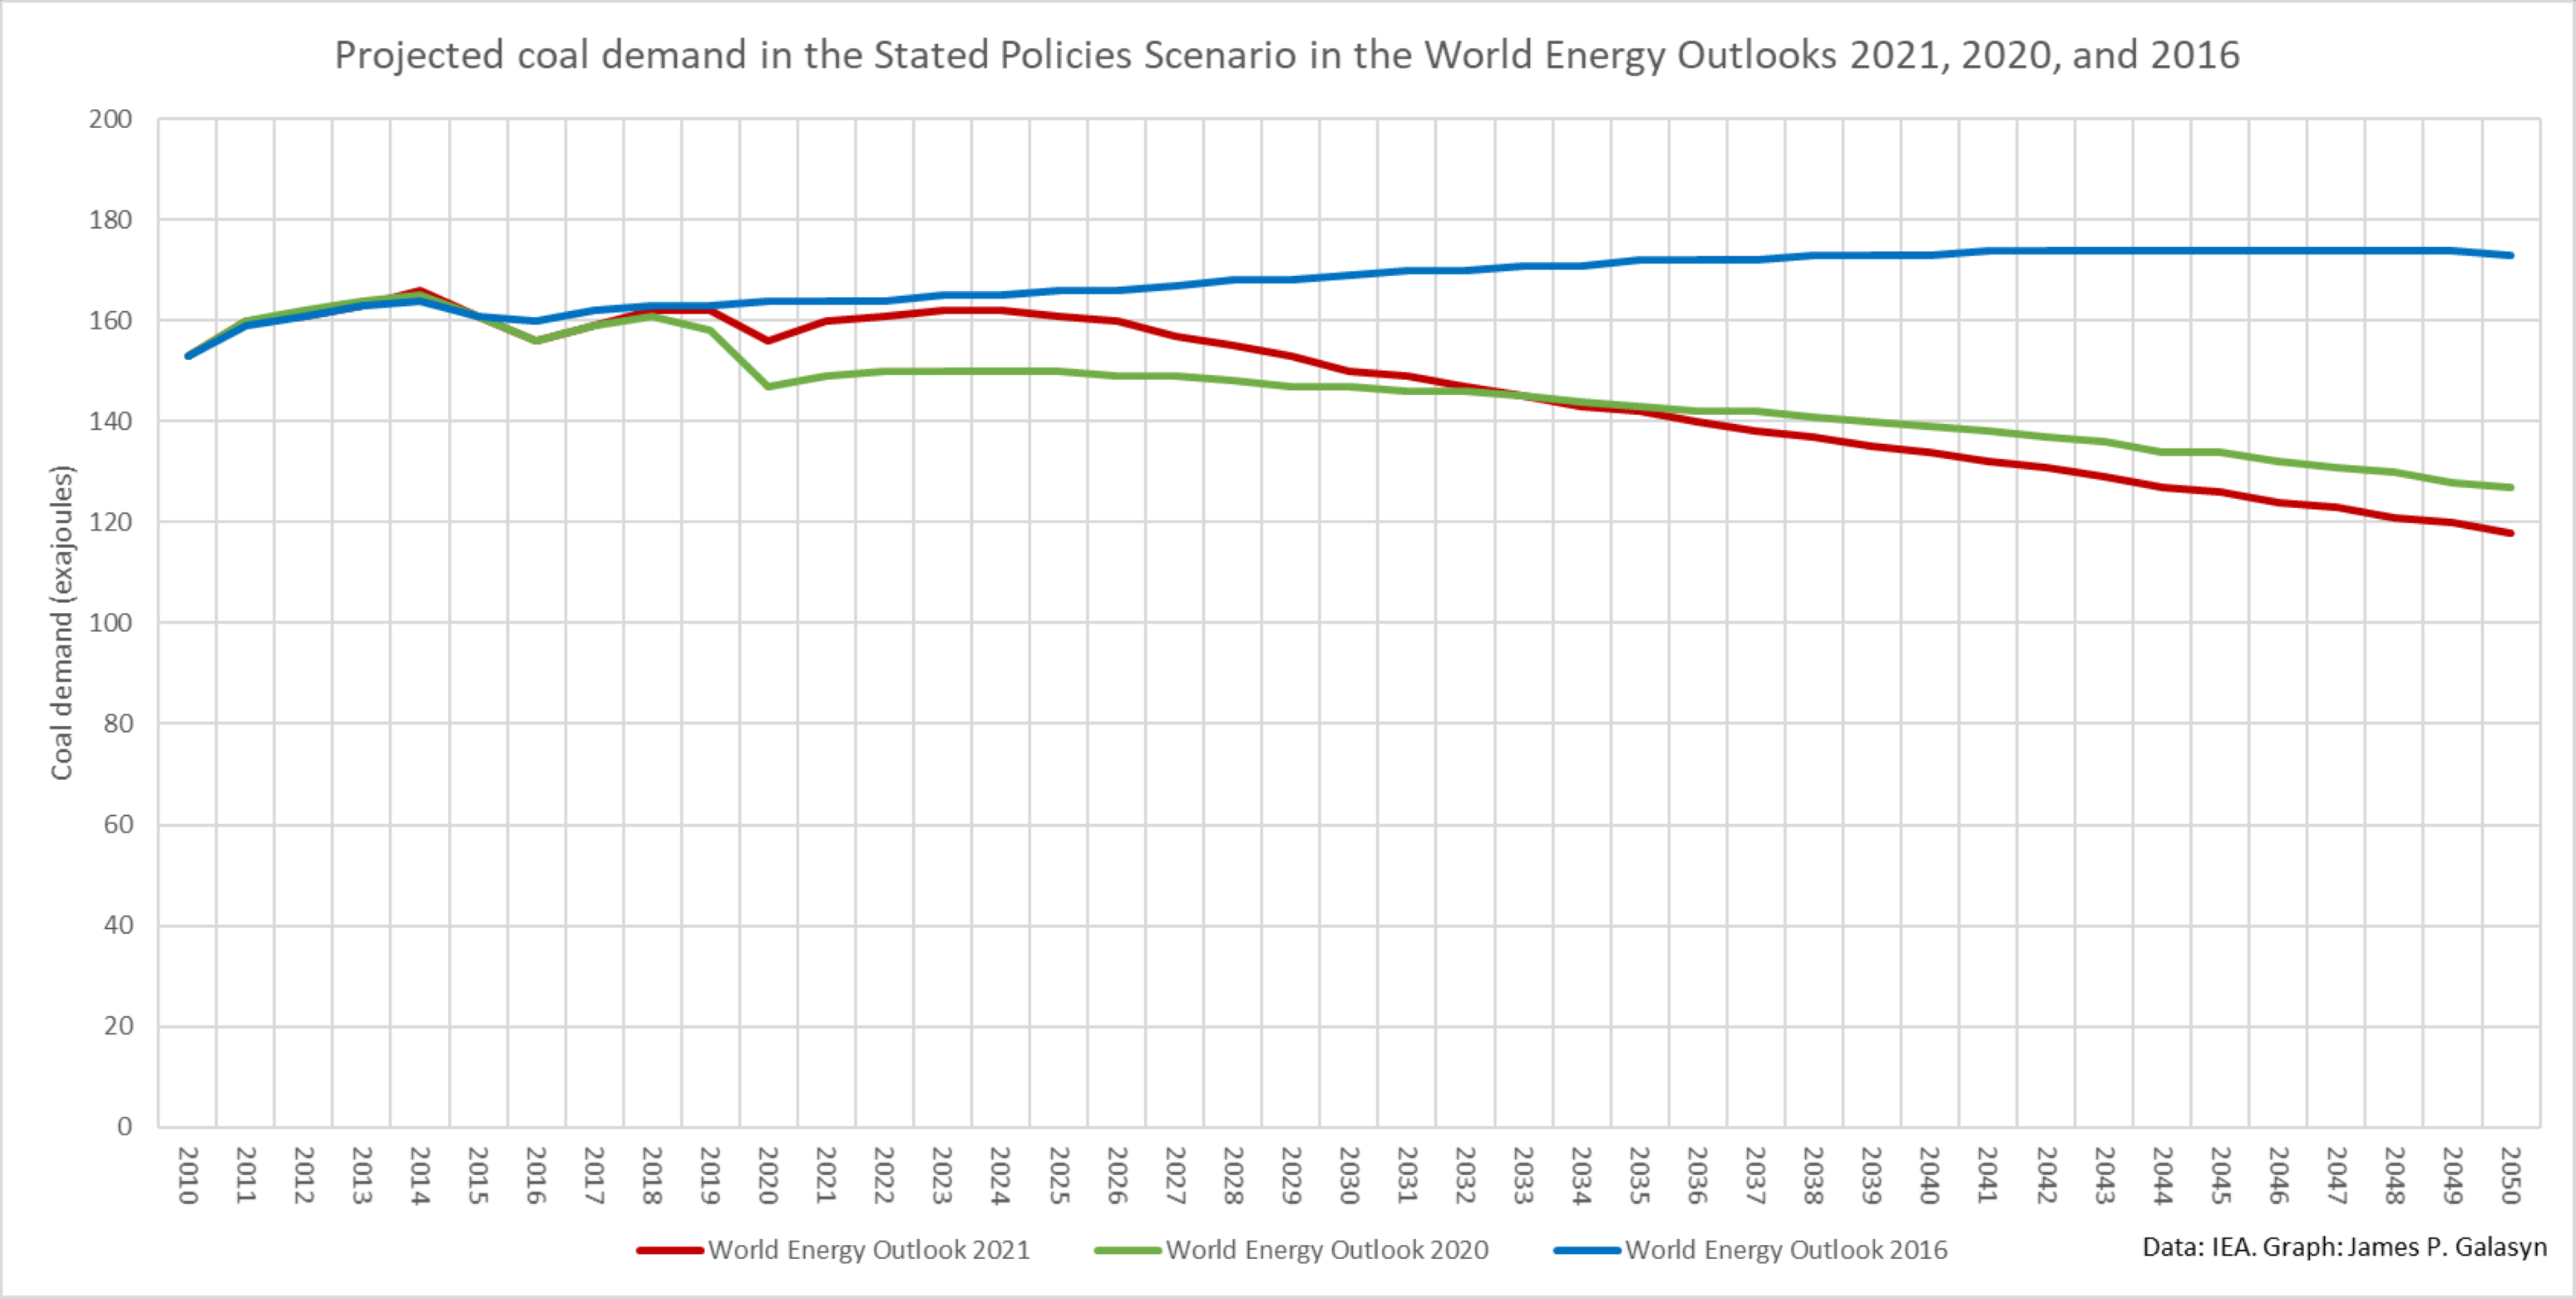
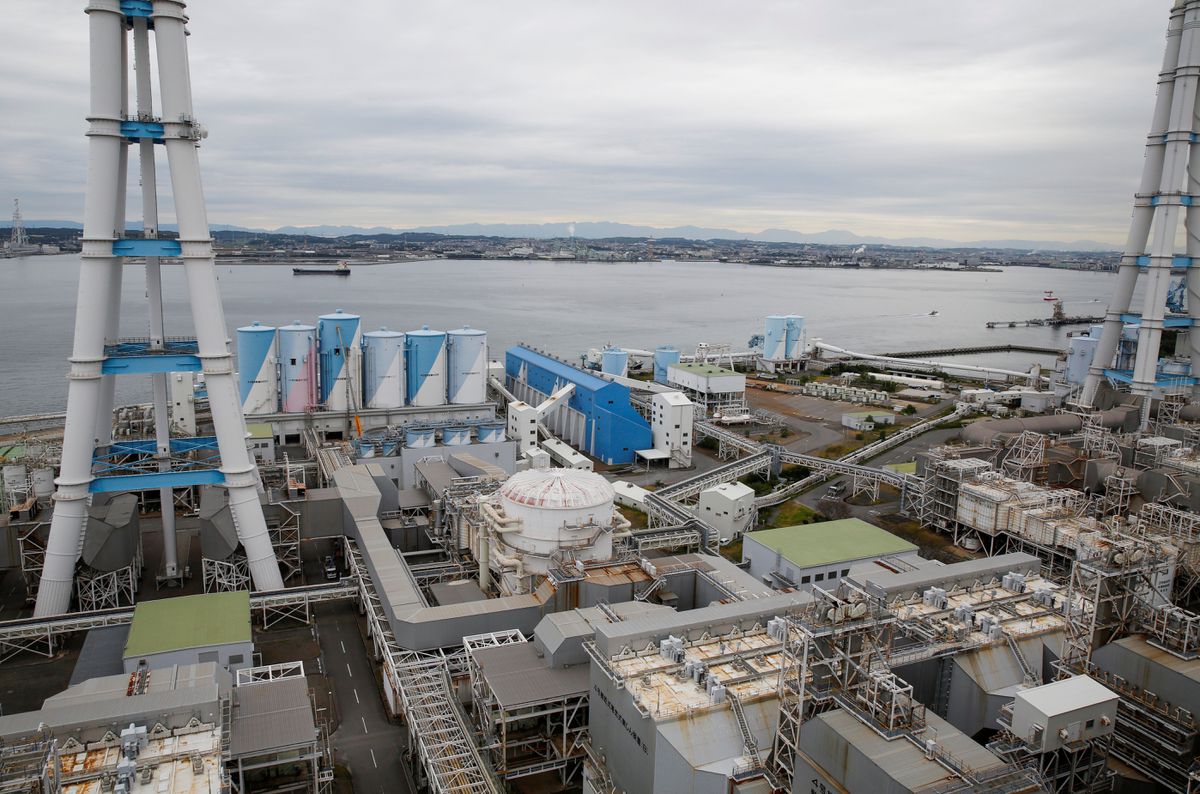
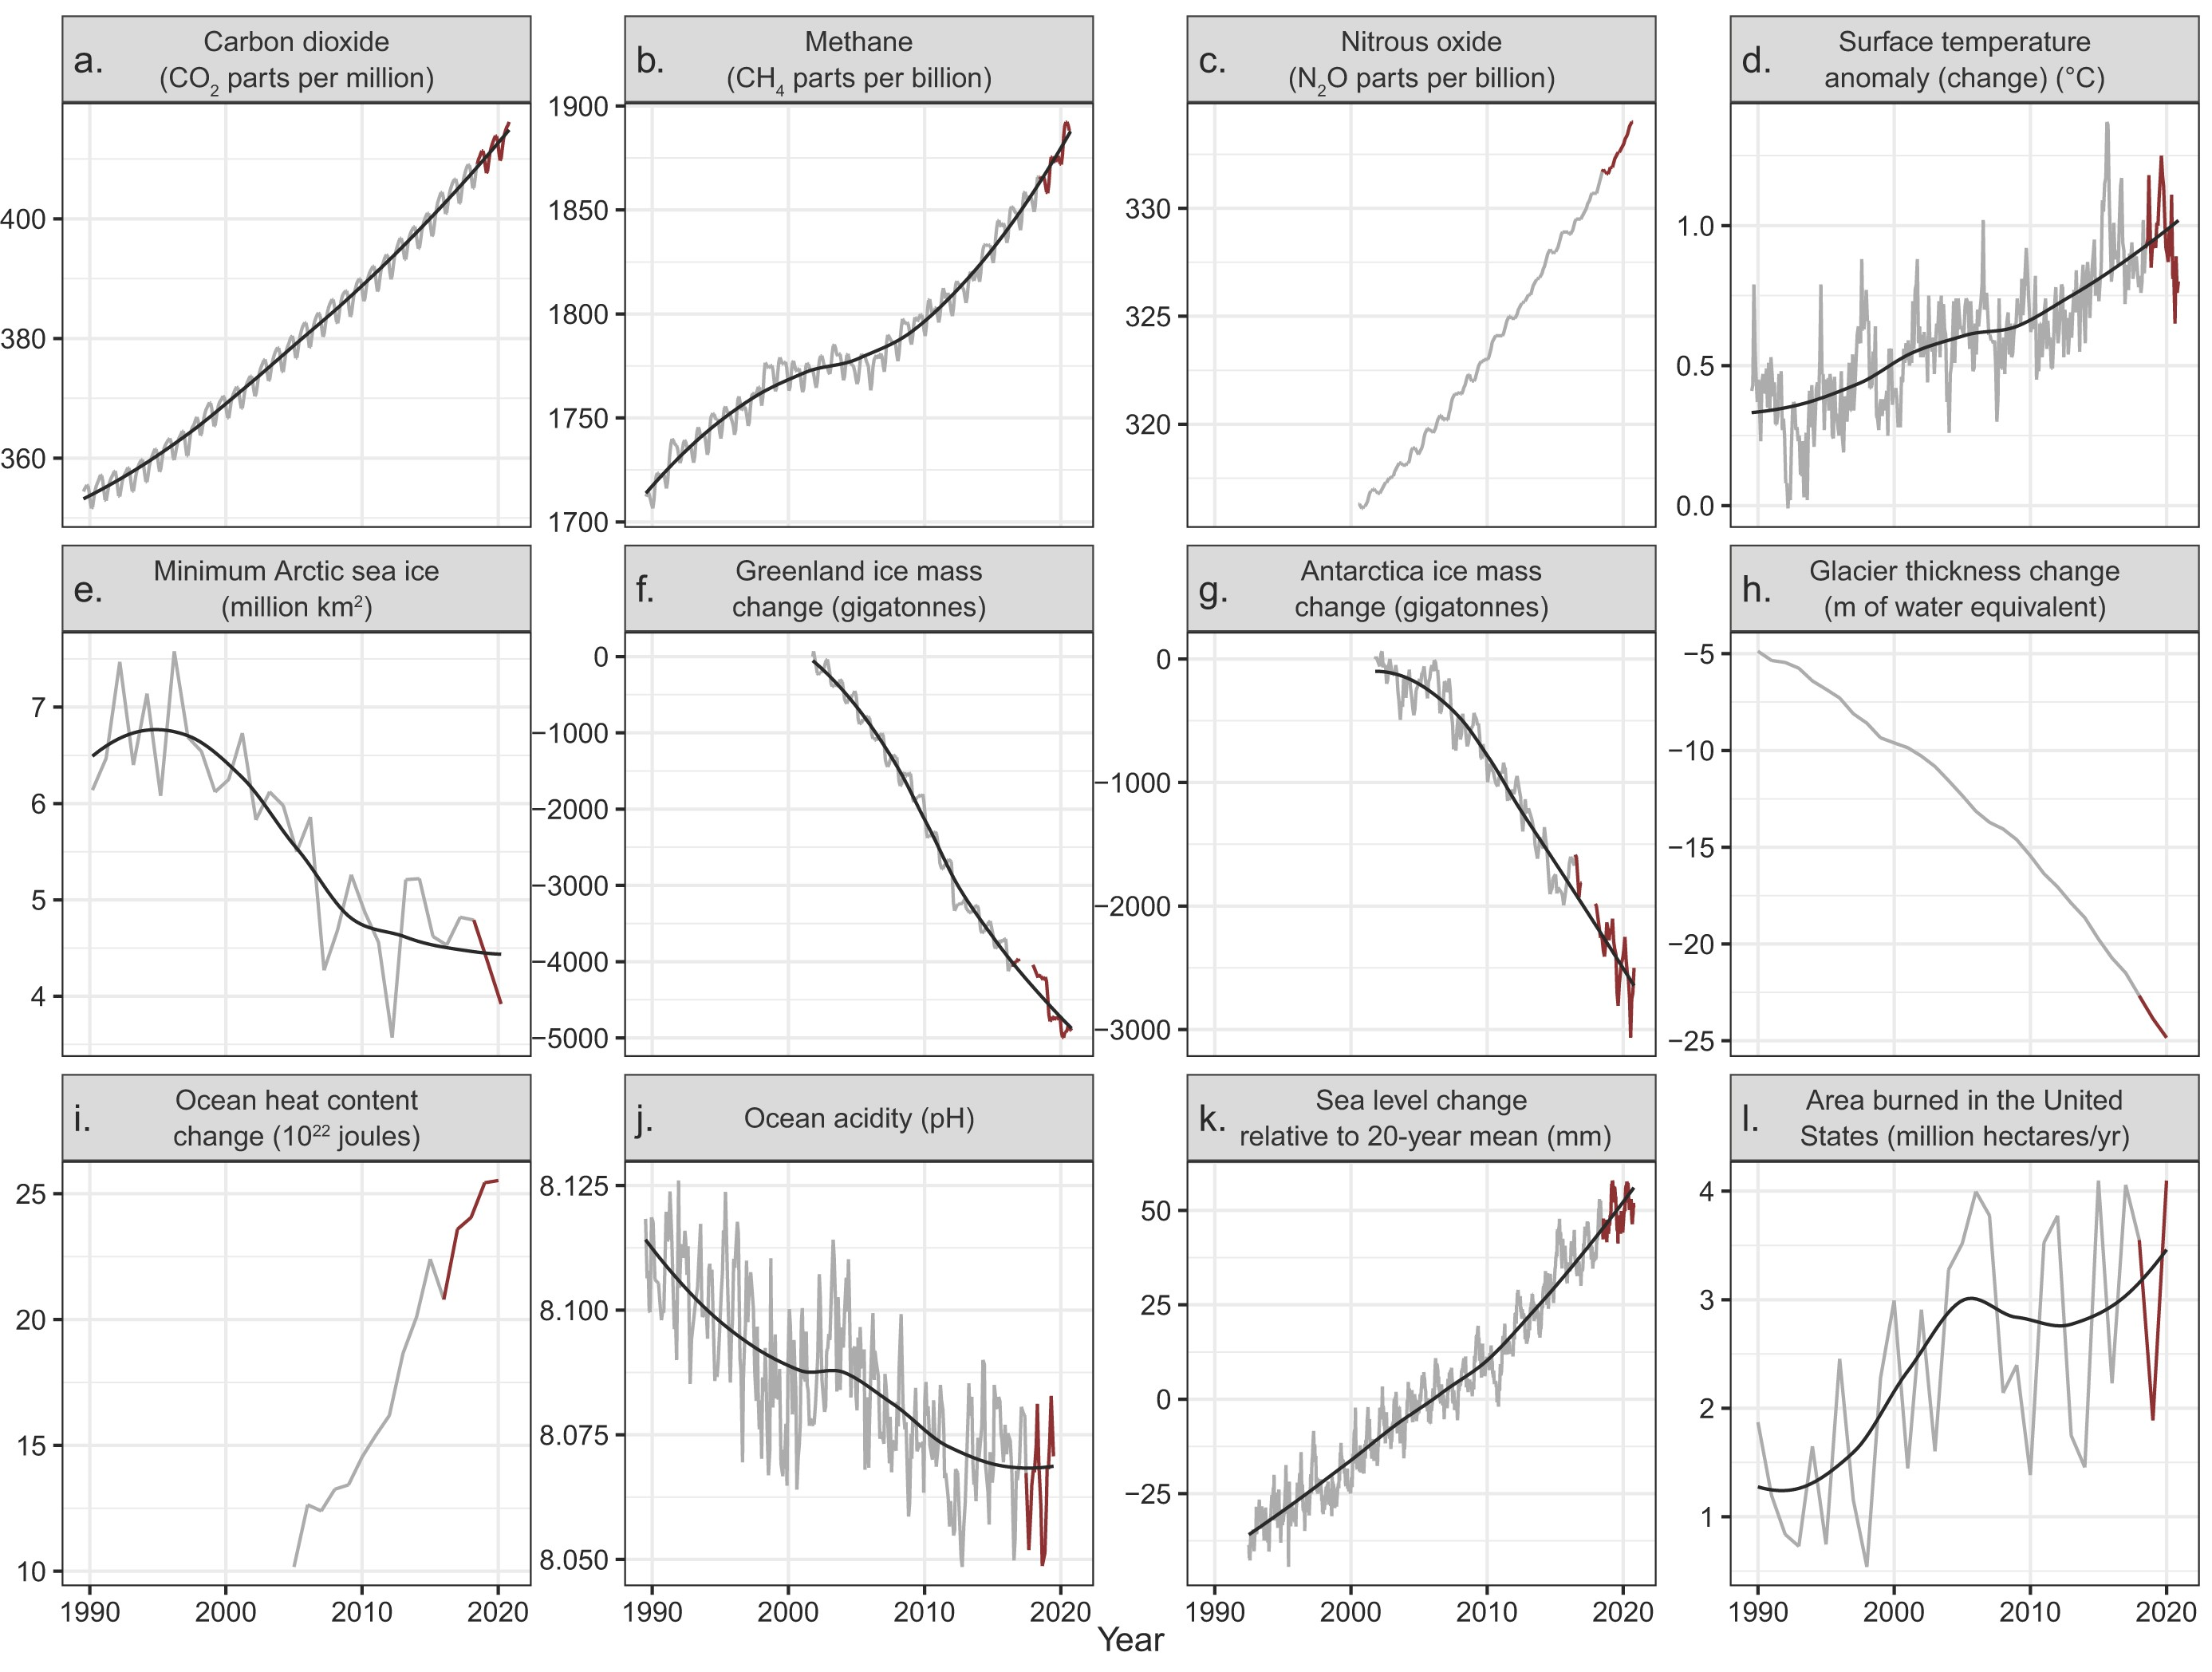
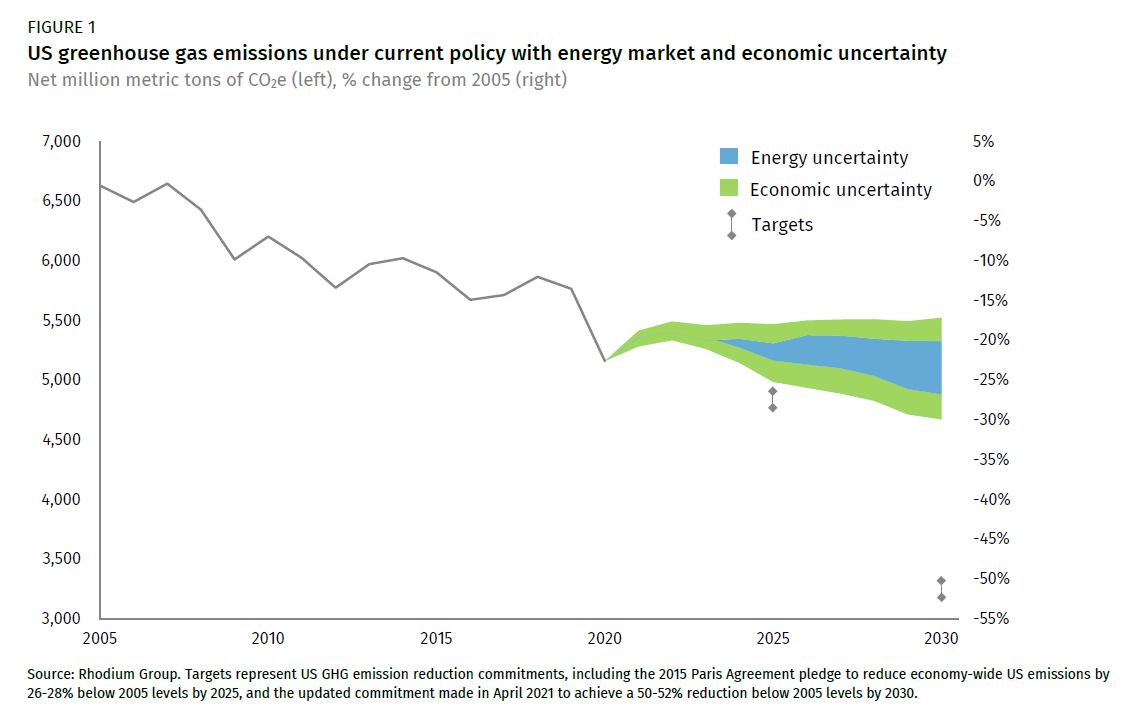
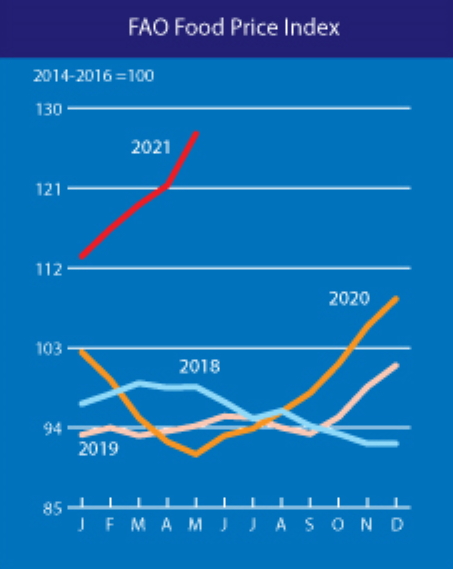
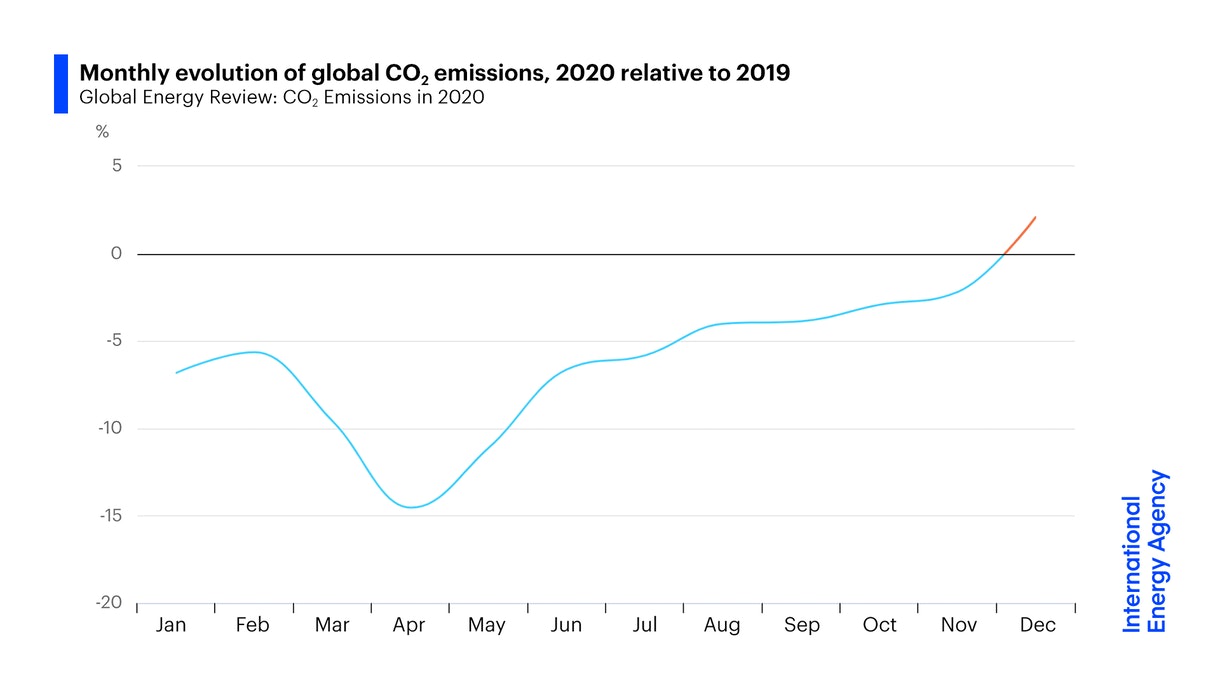
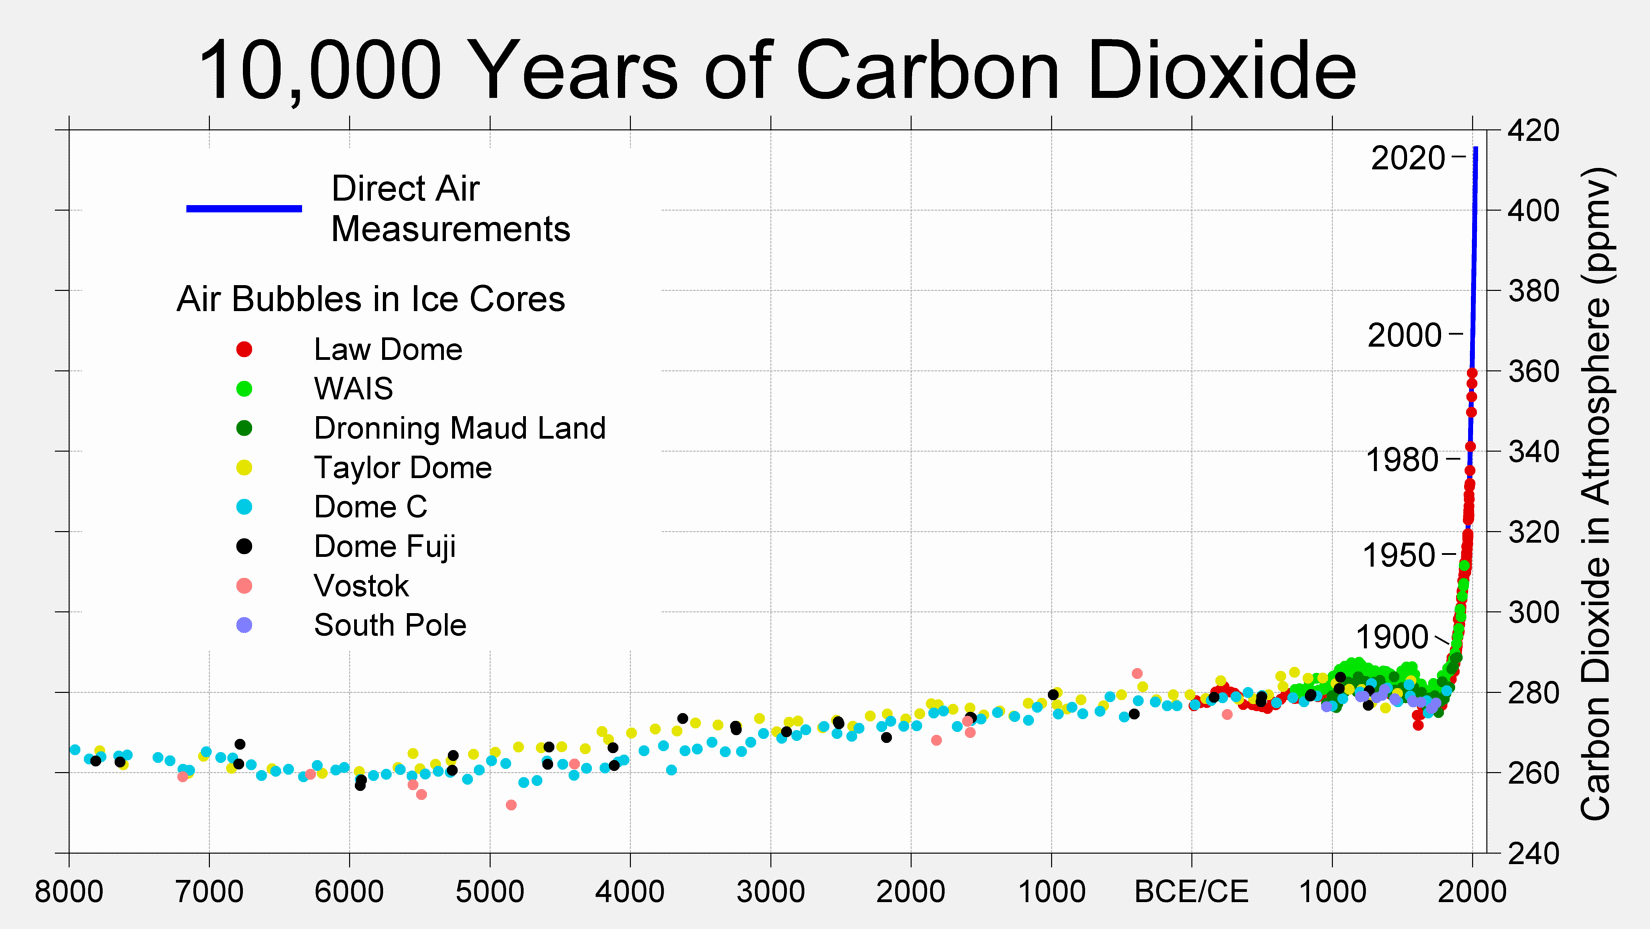
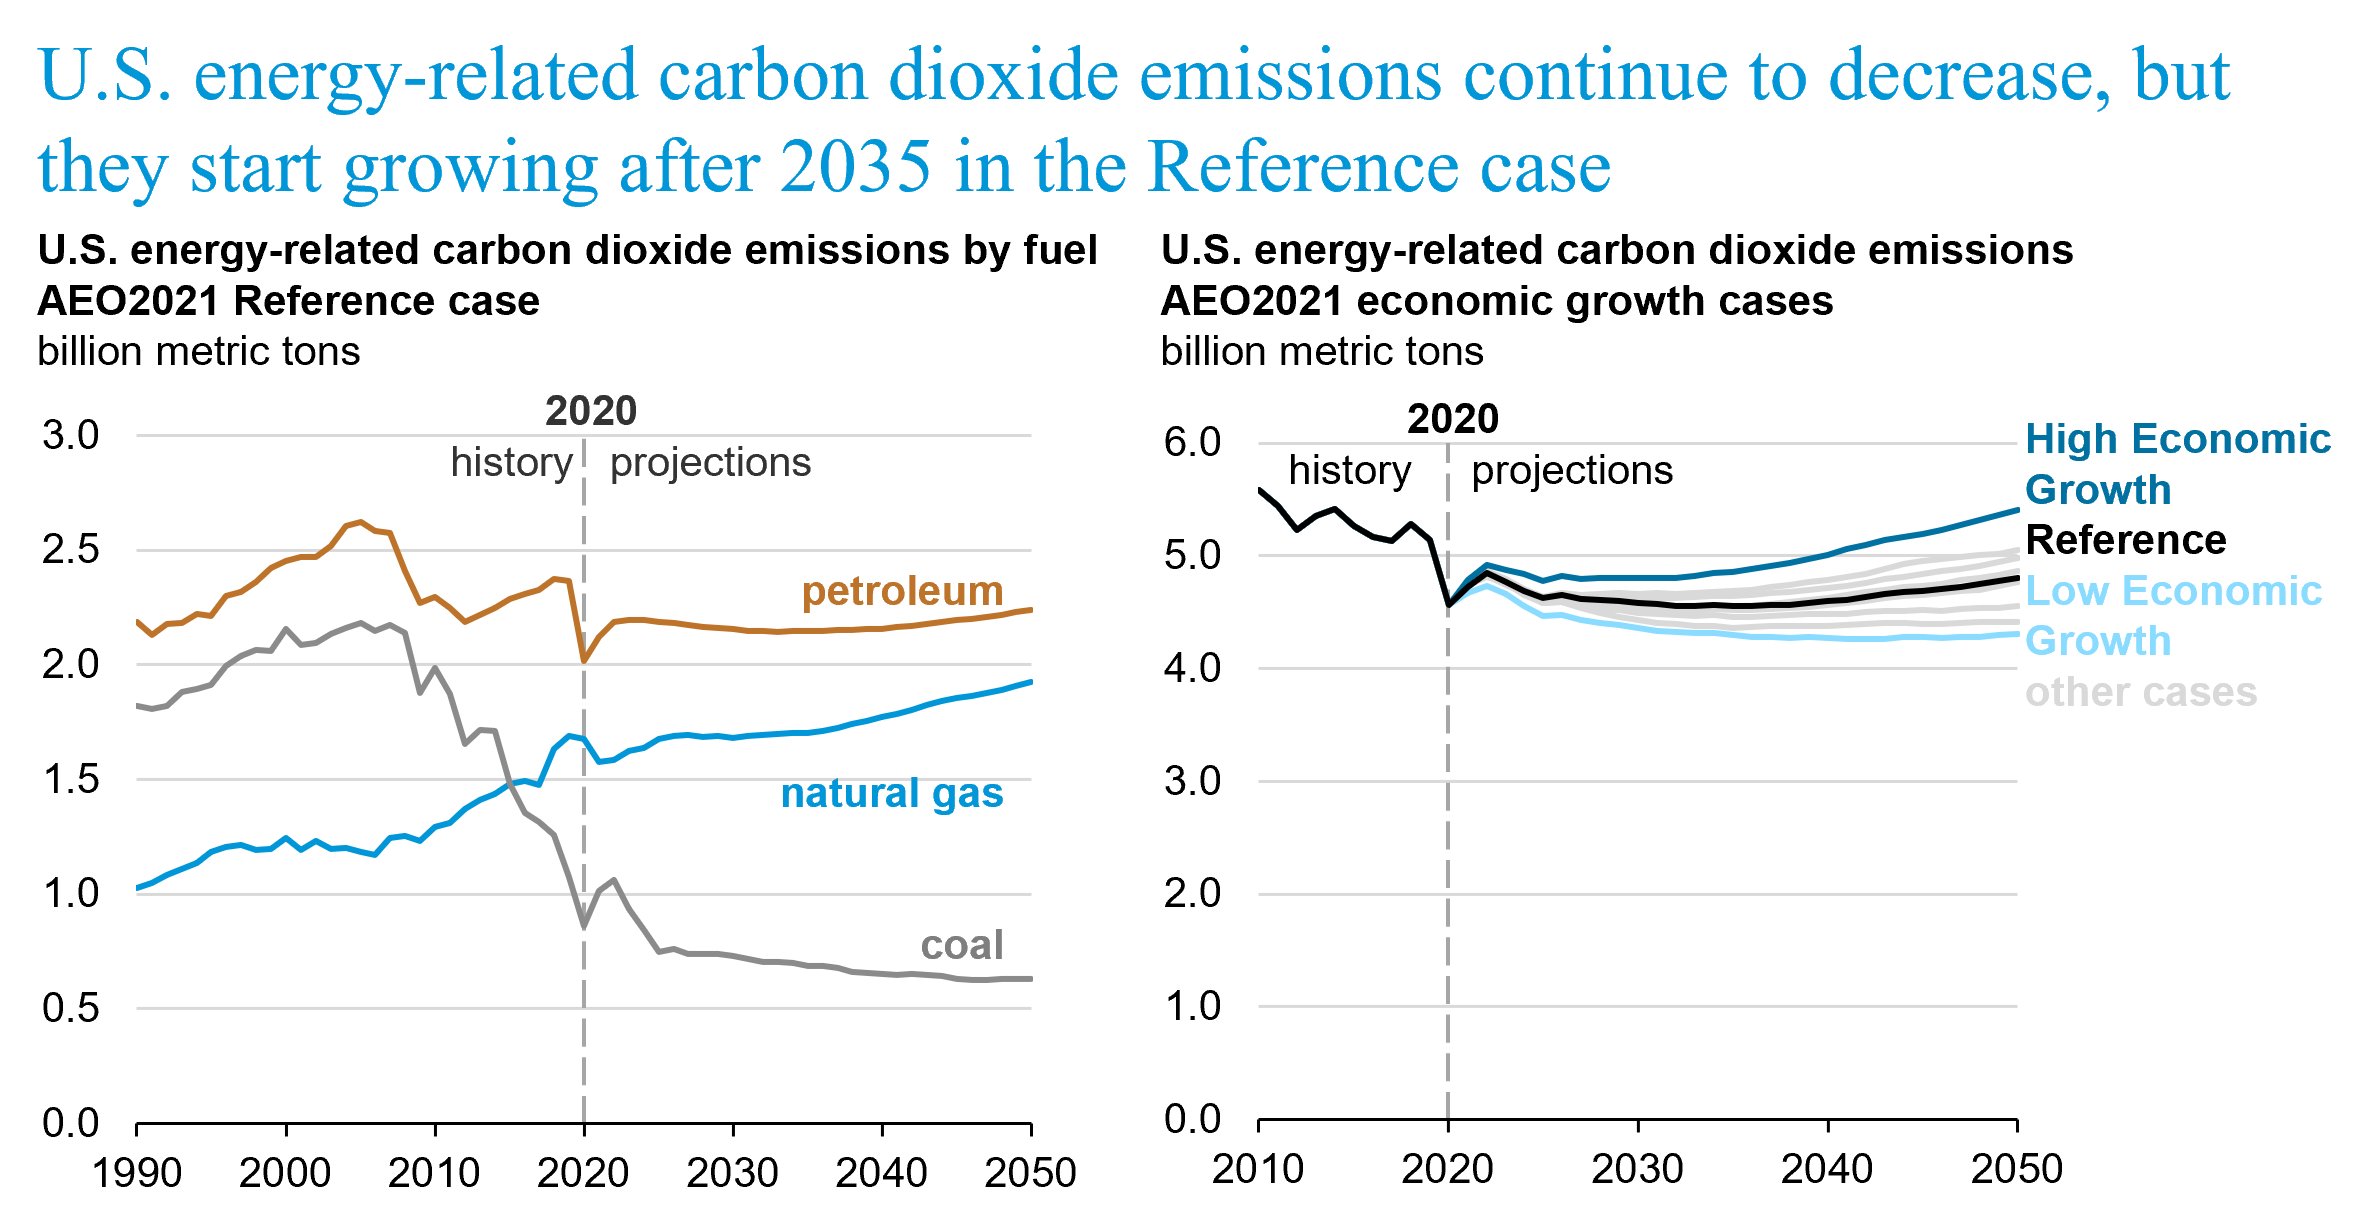
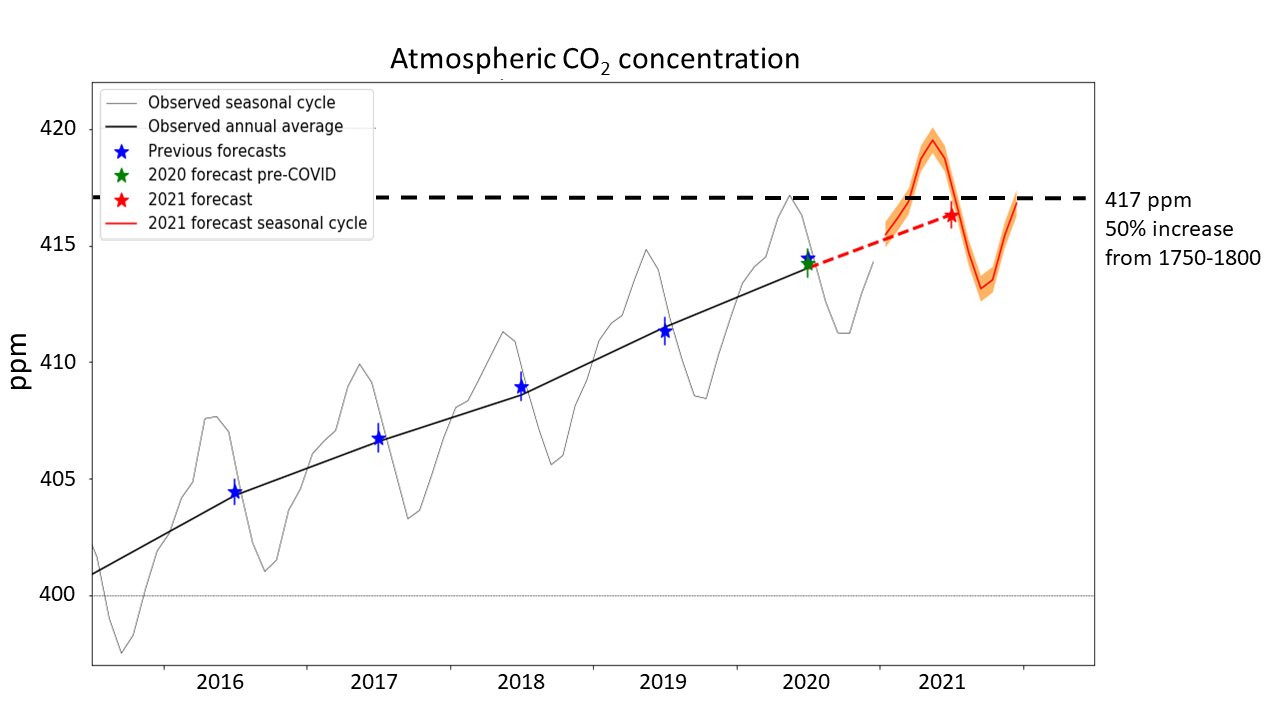
By November 2021, more than five million people had been killed in the pandemic globally. Despite the ongoing mass mortality, the world economy sprang back after it was idled in 2020. This recovery meant that carbon emissions returned to the pre-pandemic trajectory, with no lasting reduction due to “building back better”. The use of thermal coal for power generation spiked due to the sudden increase in consumer demand, so it could be said that humans are “building back worse”.
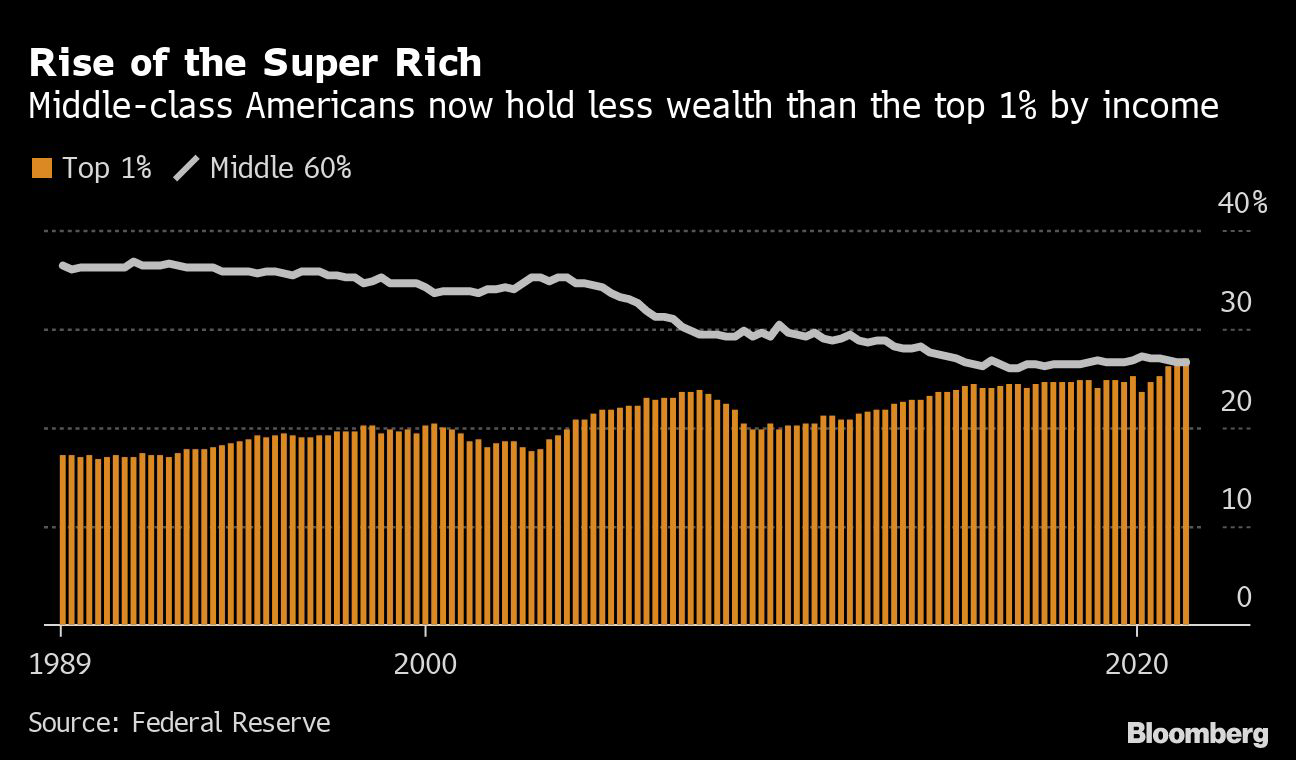
Wealth gap widened
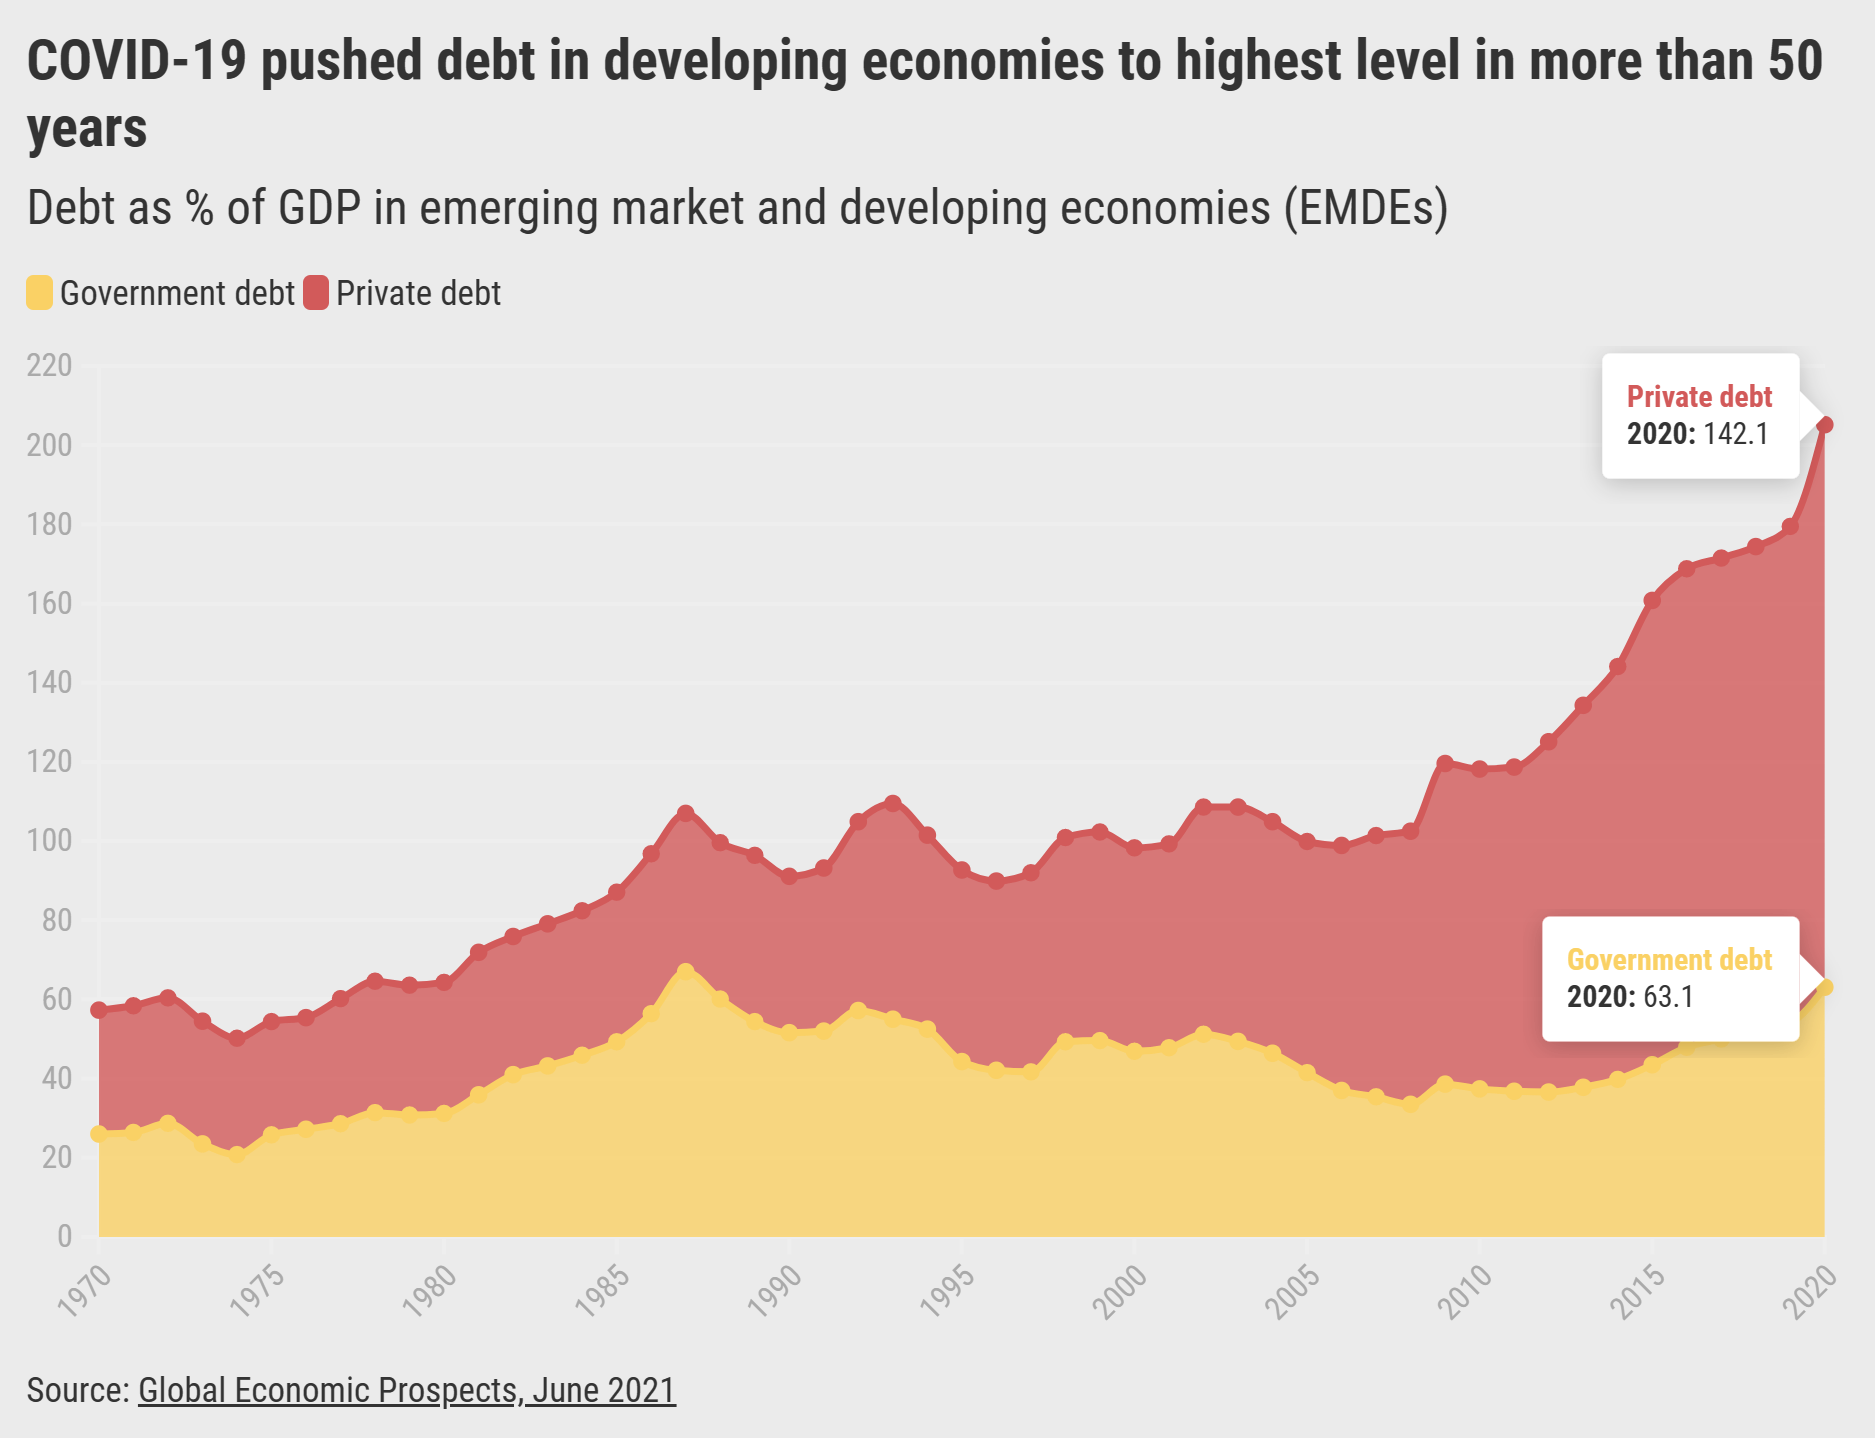
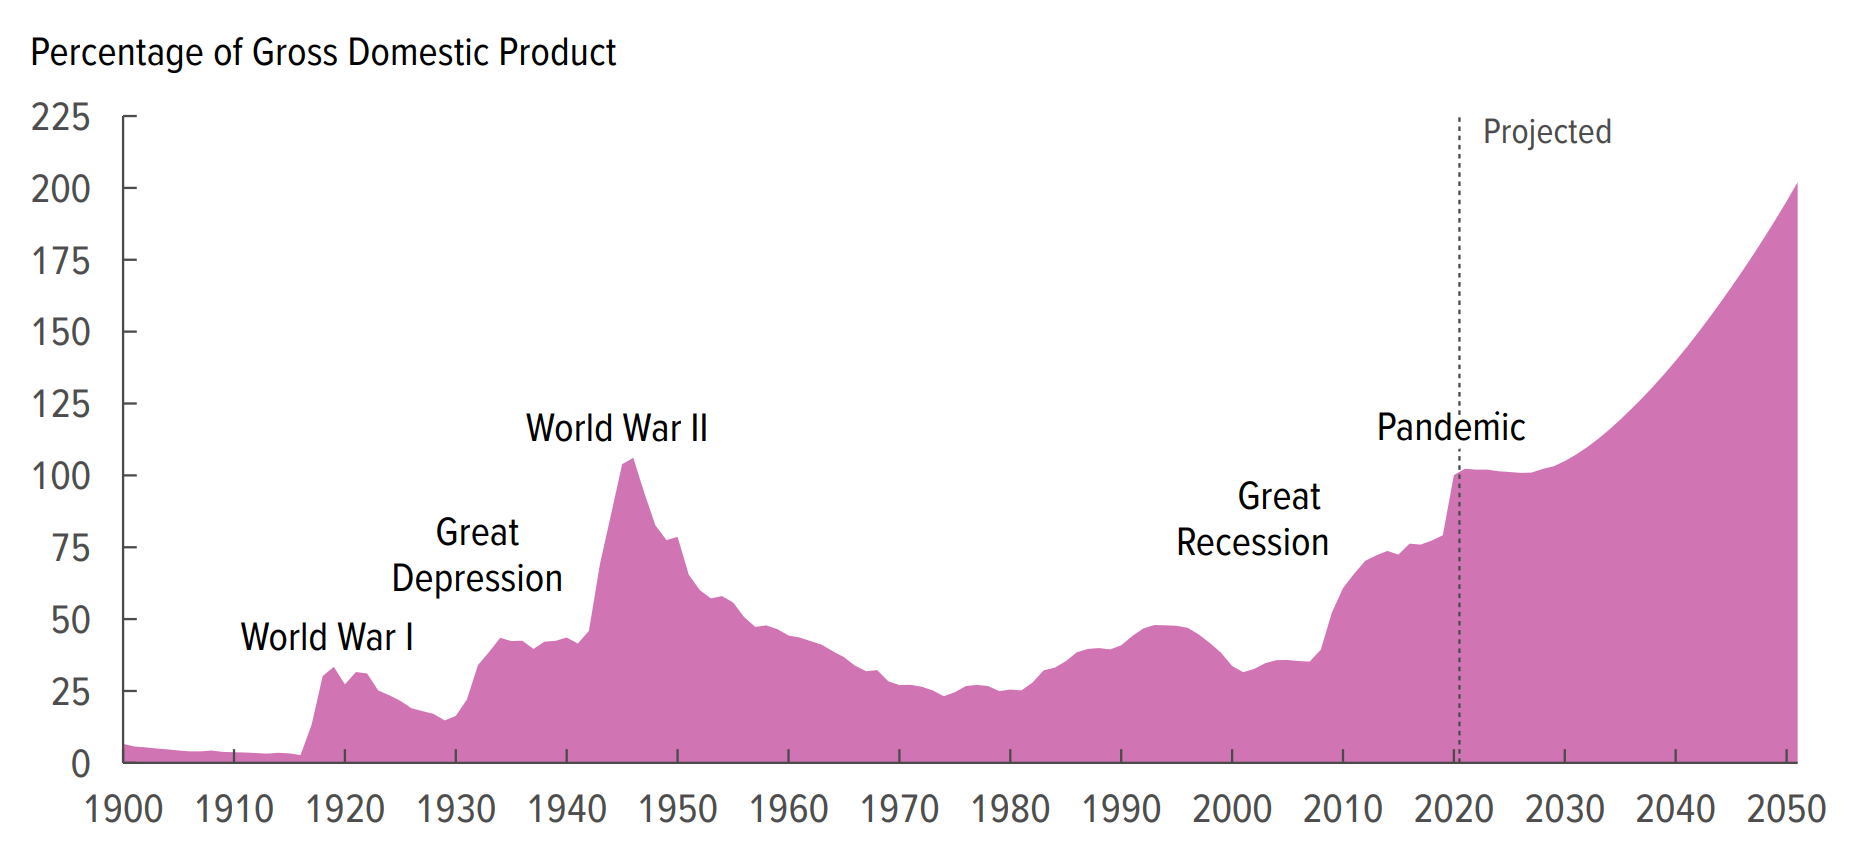
The pandemic in 2021 had dire effects on global wealth distribution, as the divide between rich and poor widened sharply. Nations became richer, but governments became poorer: over the past 40 years, the share of wealth held by public actors is near zero or negative in rich countries, meaning most of the world’s wealth is in private hands, a trend that has been amplified by the pandemic, as governments borrowed the equivalent of 10-20 percent of GDP from the private sector.
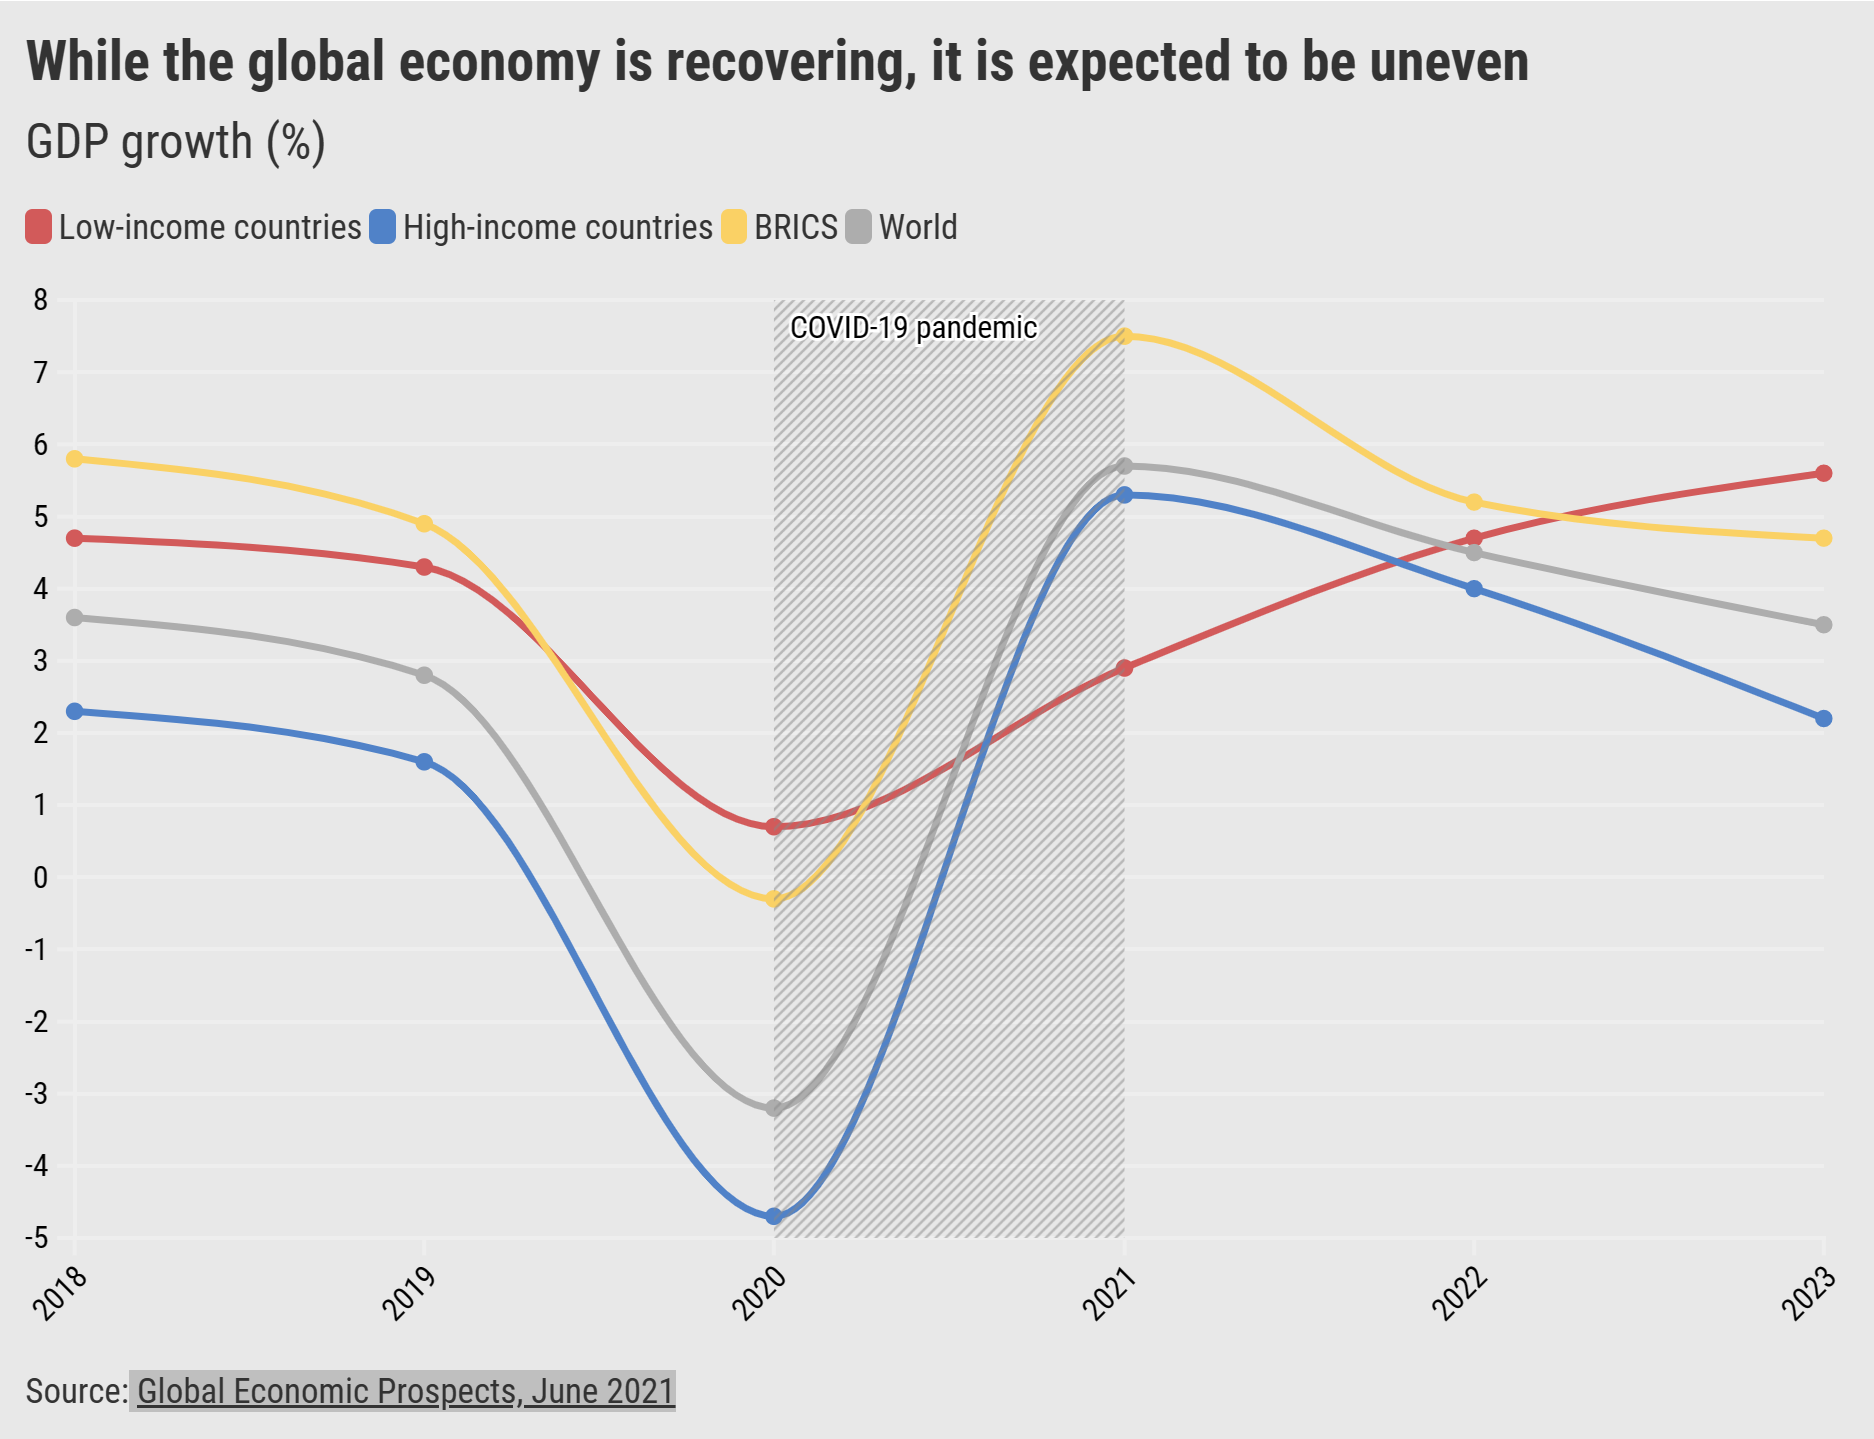
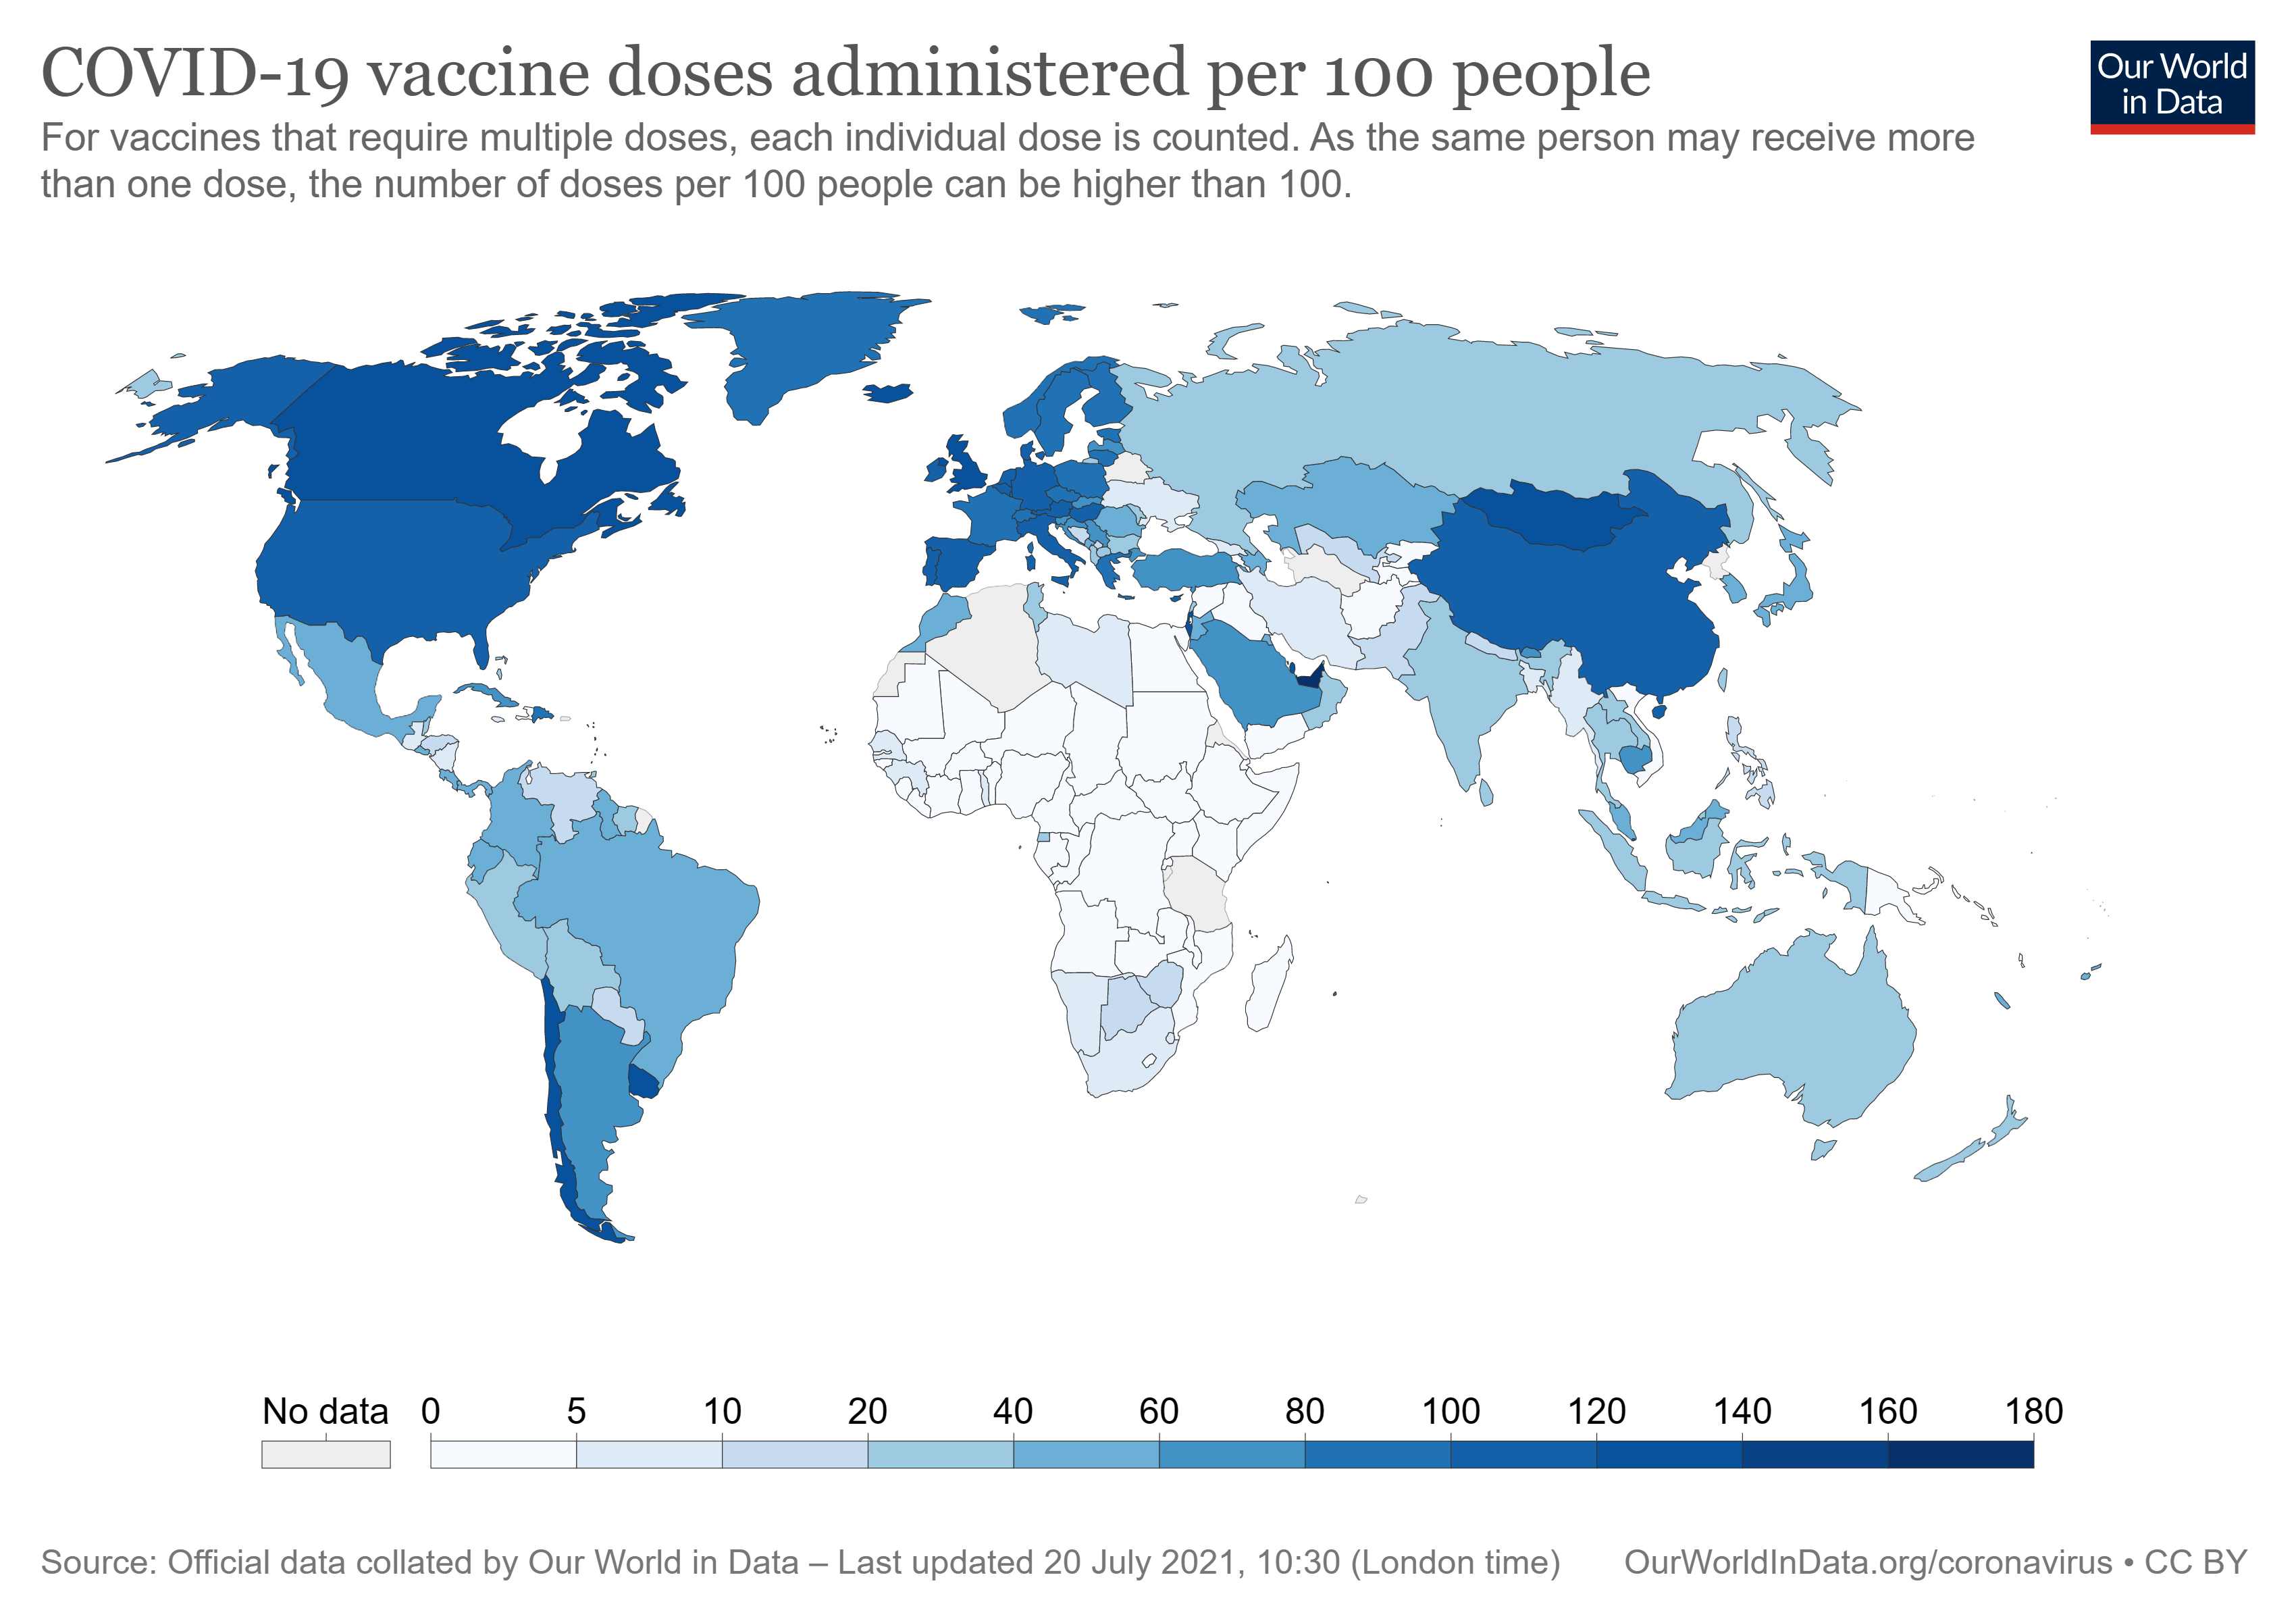
The World Bank reported: “As is the case with access to vaccines, there is an emerging gap in the economic recovery between high-income and low- and middle-income economies. … While the global economy is set to expand 5.6 percent in 2021—its strongest post-recession pace in 80 years, the recovery will be uneven. Low-income economies are forecast to expand by only 2.9 percent in 2021, the slowest growth in the past 20 years, other than 2020, partly due to the slow pace of vaccination.”
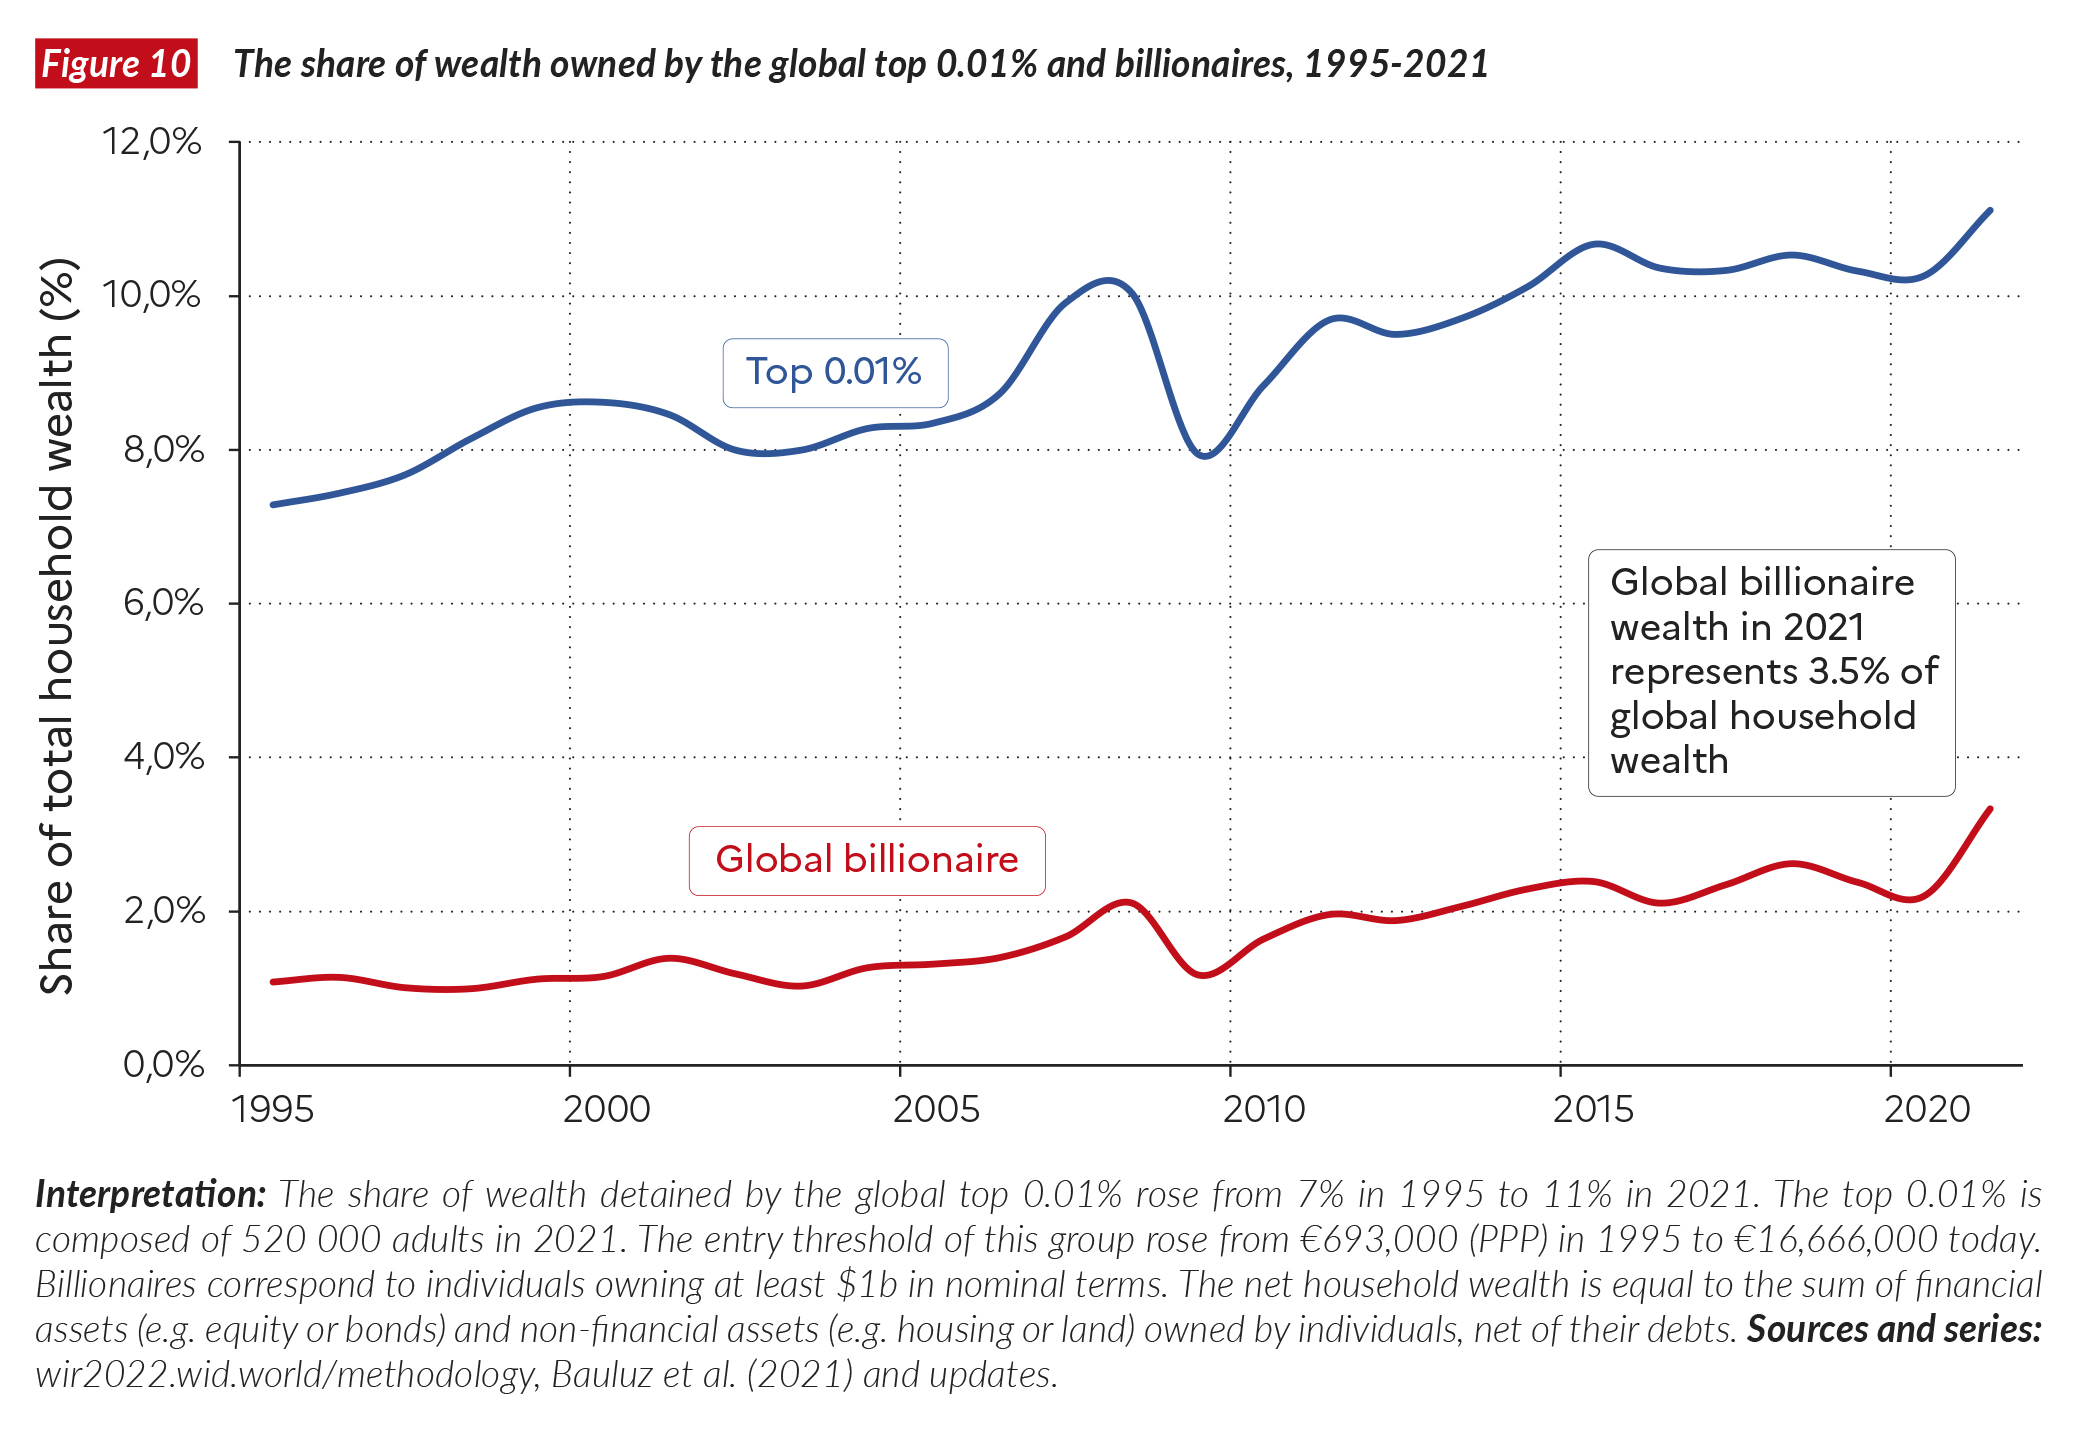
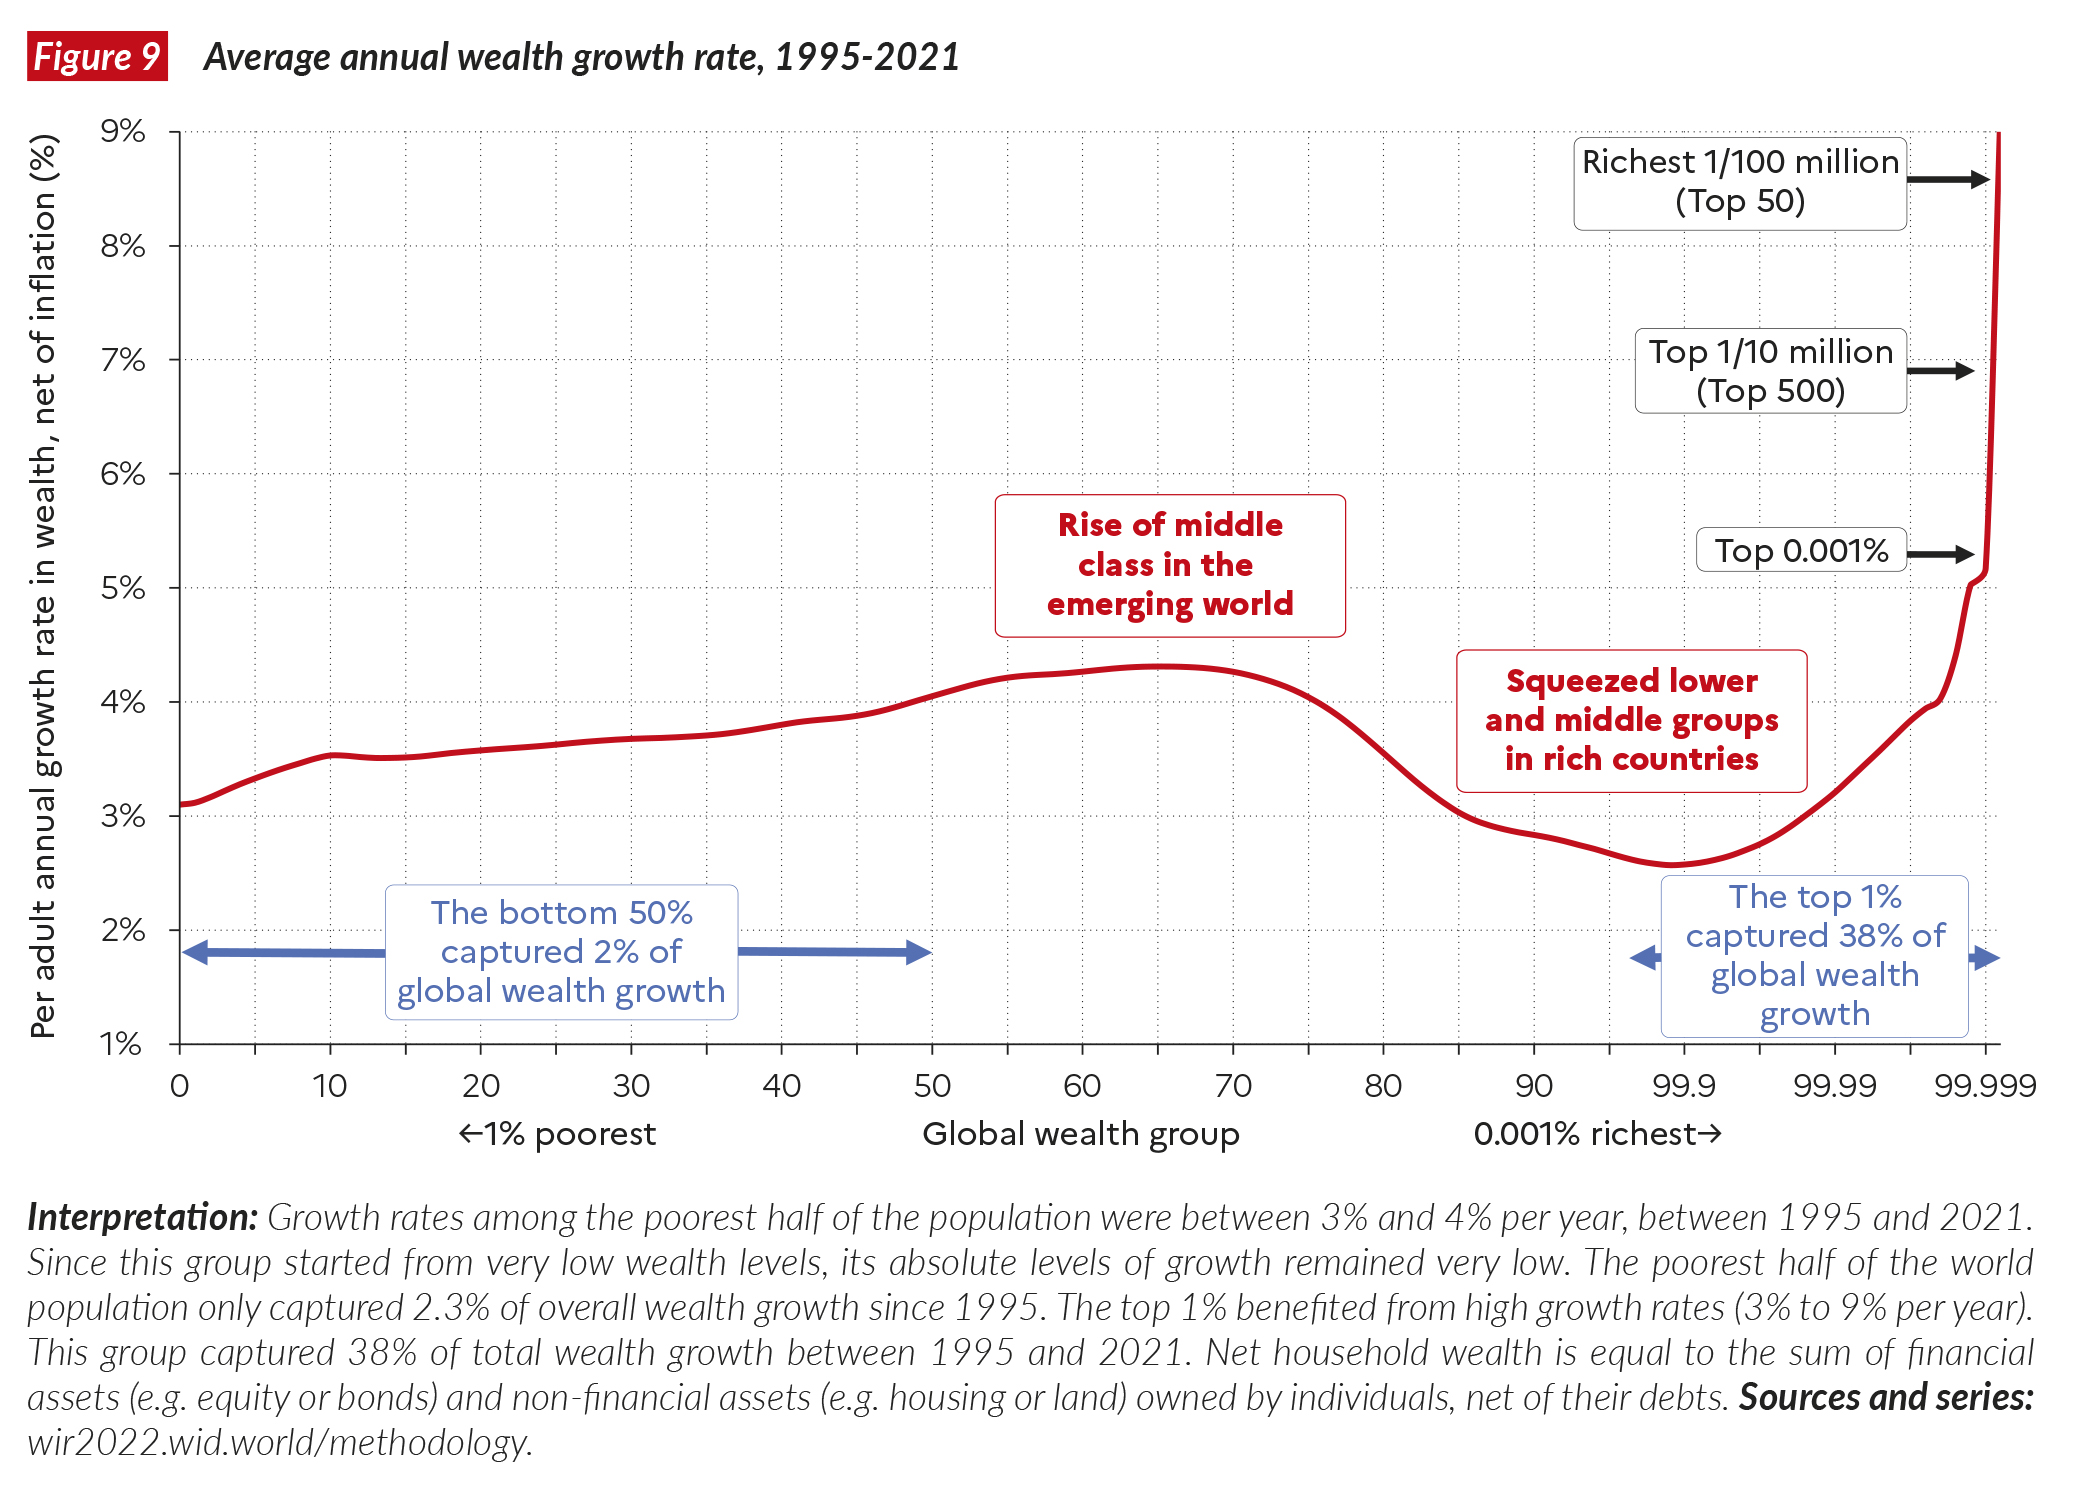
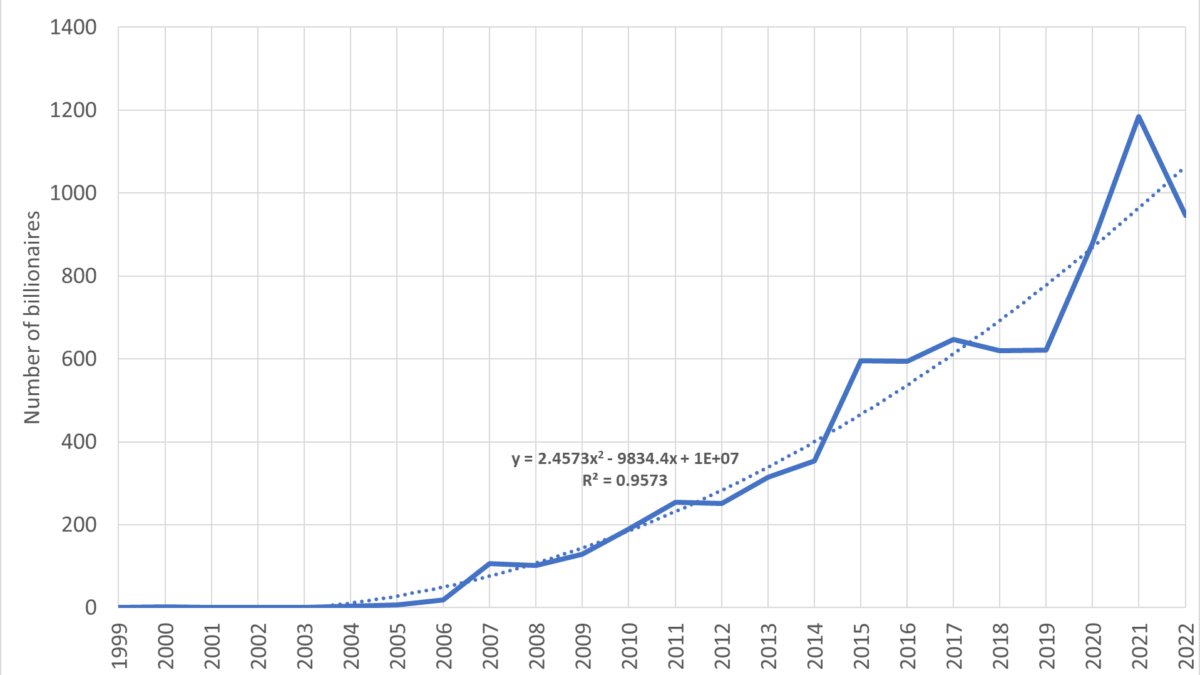
The coronavirus pandemic has been good for the world’s billionaires, with the already-impressive trend in wealth capture – which rose from 1 percent to more than 3 percent since 1995 – accelerating to 3.5 percent in 2020, the steepest increase on record in the wealth share captured by billionaires. Ten of the richest men in the world enjoyed an increase in their wealth of more than $400 billion since the pandemic began.
America’s billionaires grew $2.1 trillion richer during the pandemic, with their wealth increasing by 70 percent, from around $3 trillion at the start of the pandemic to more than $5 trillion in October 2021. The top one percent of U.S. earners now hold more wealth than the entire middle class. Meanwhile, 94 million U.S. citizens filed for unemployment in 2021.
Health declined
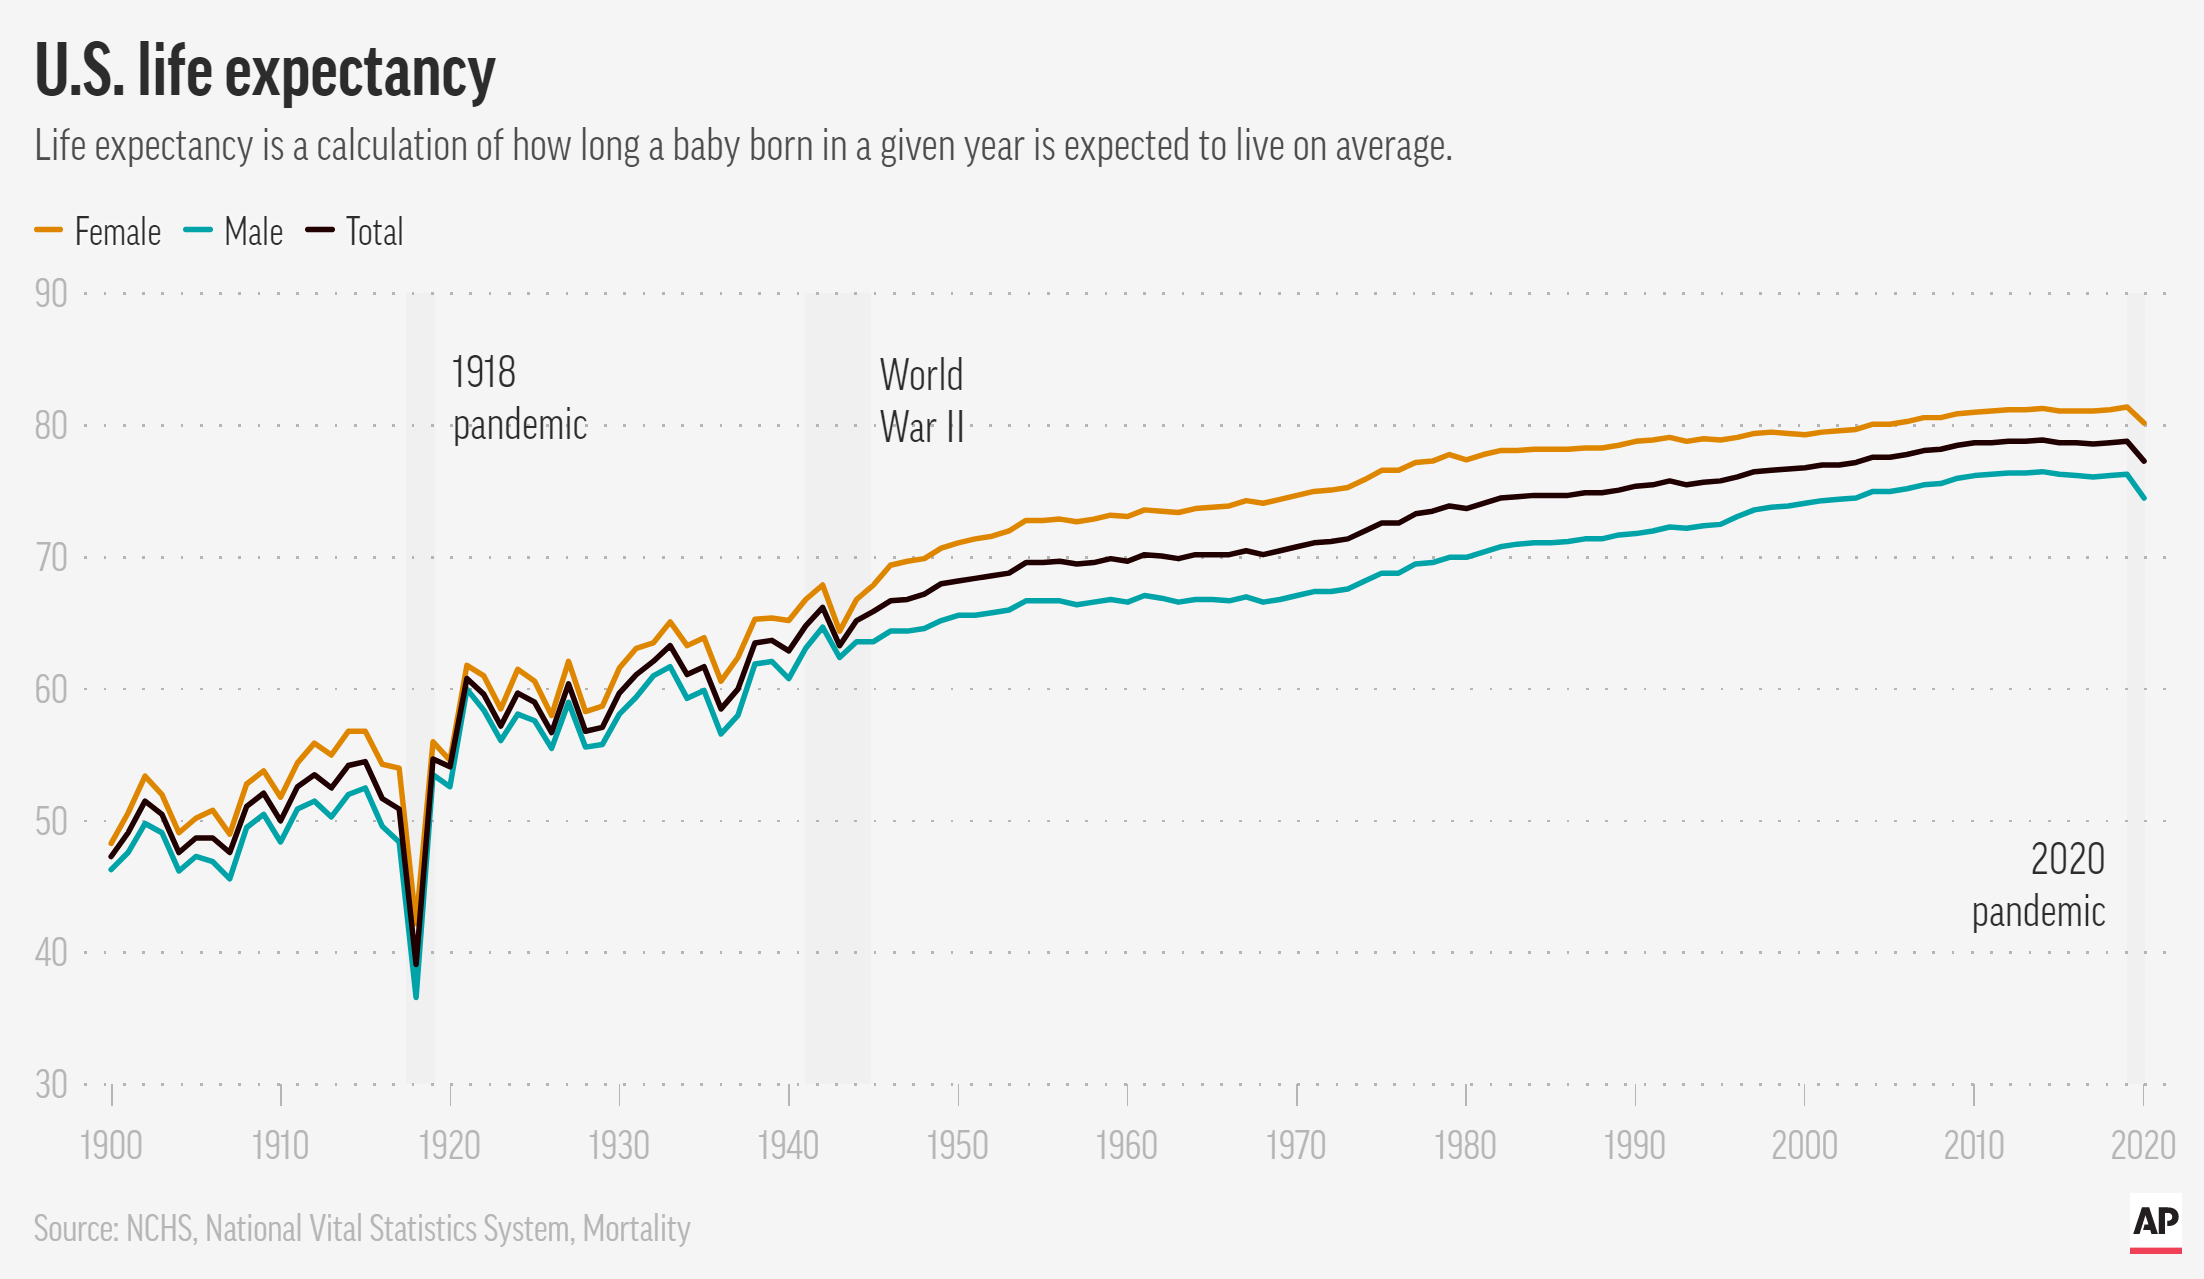
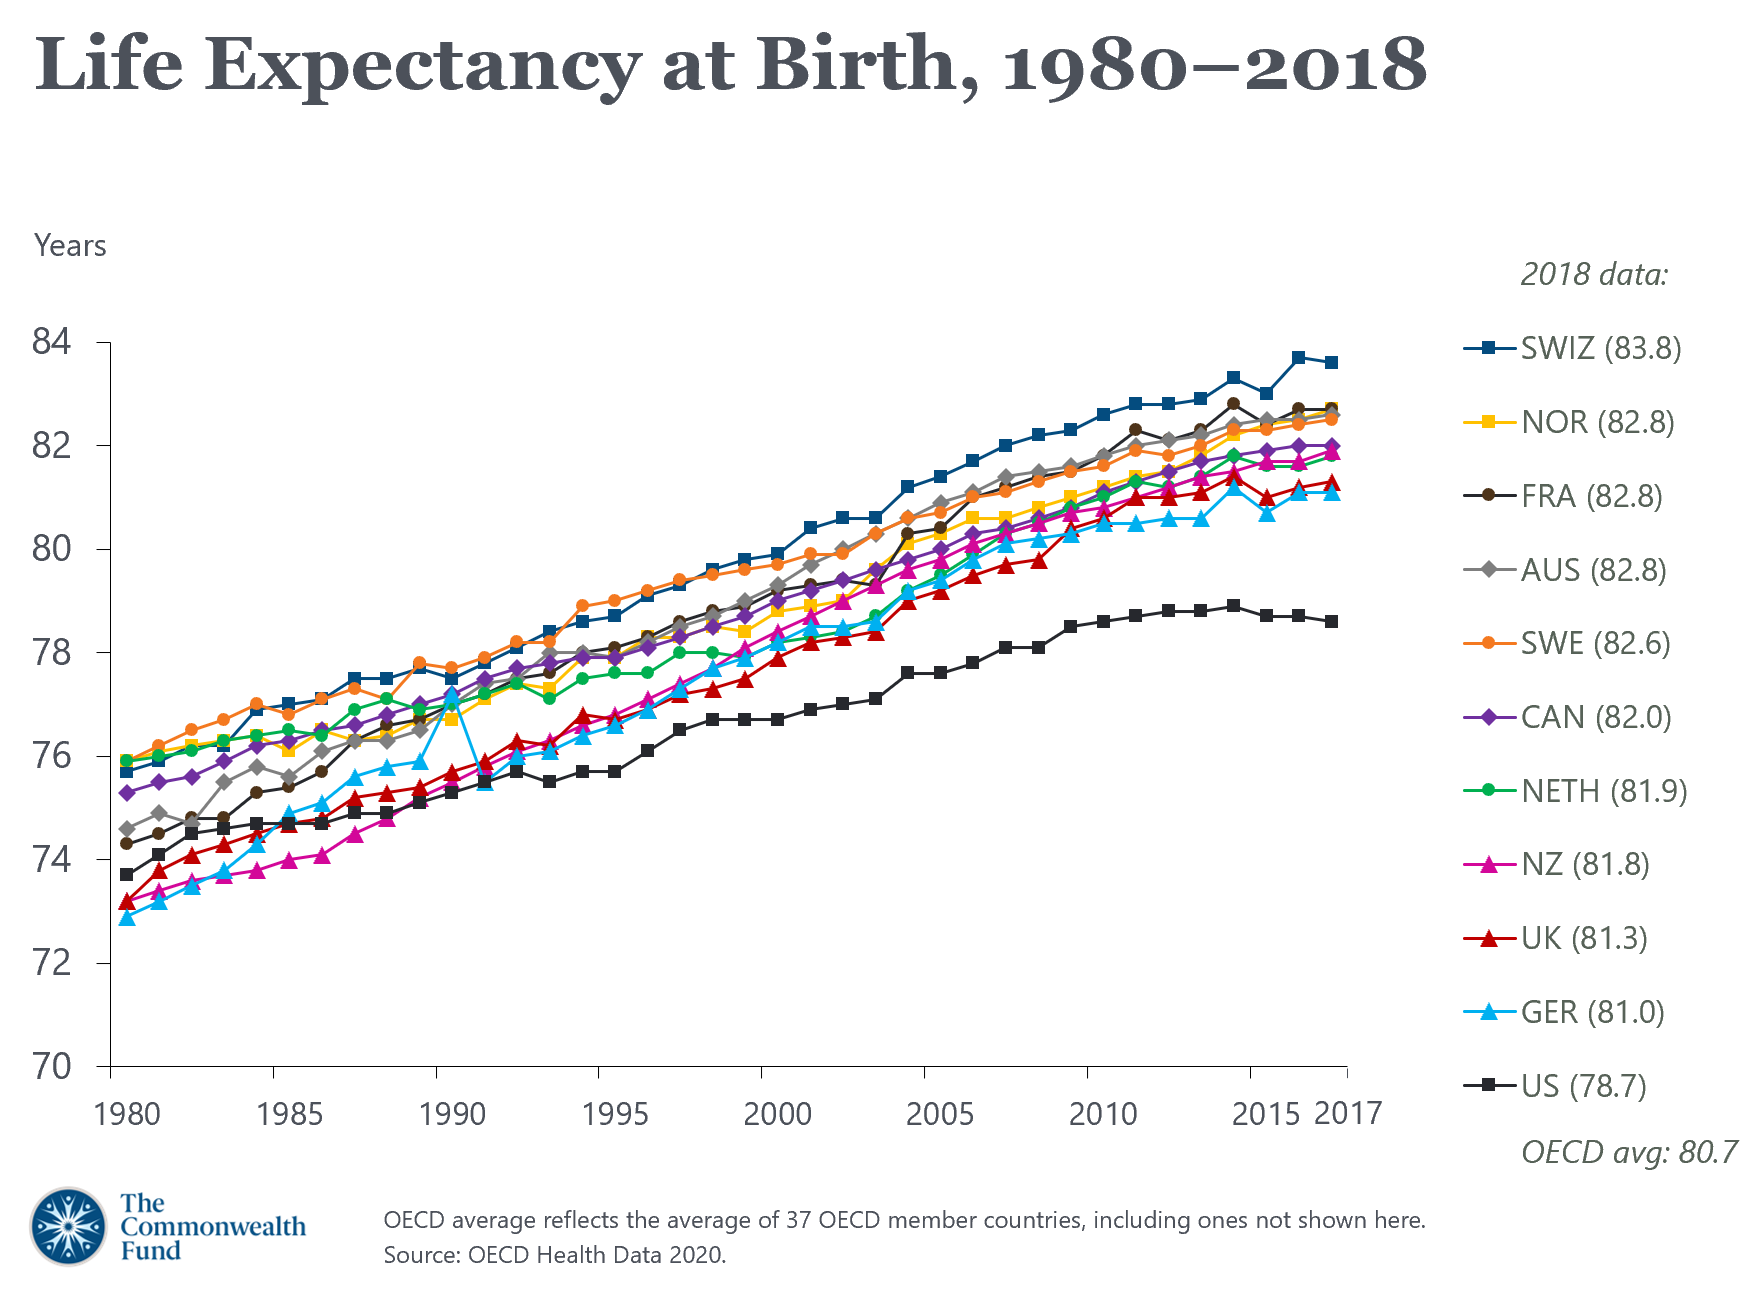
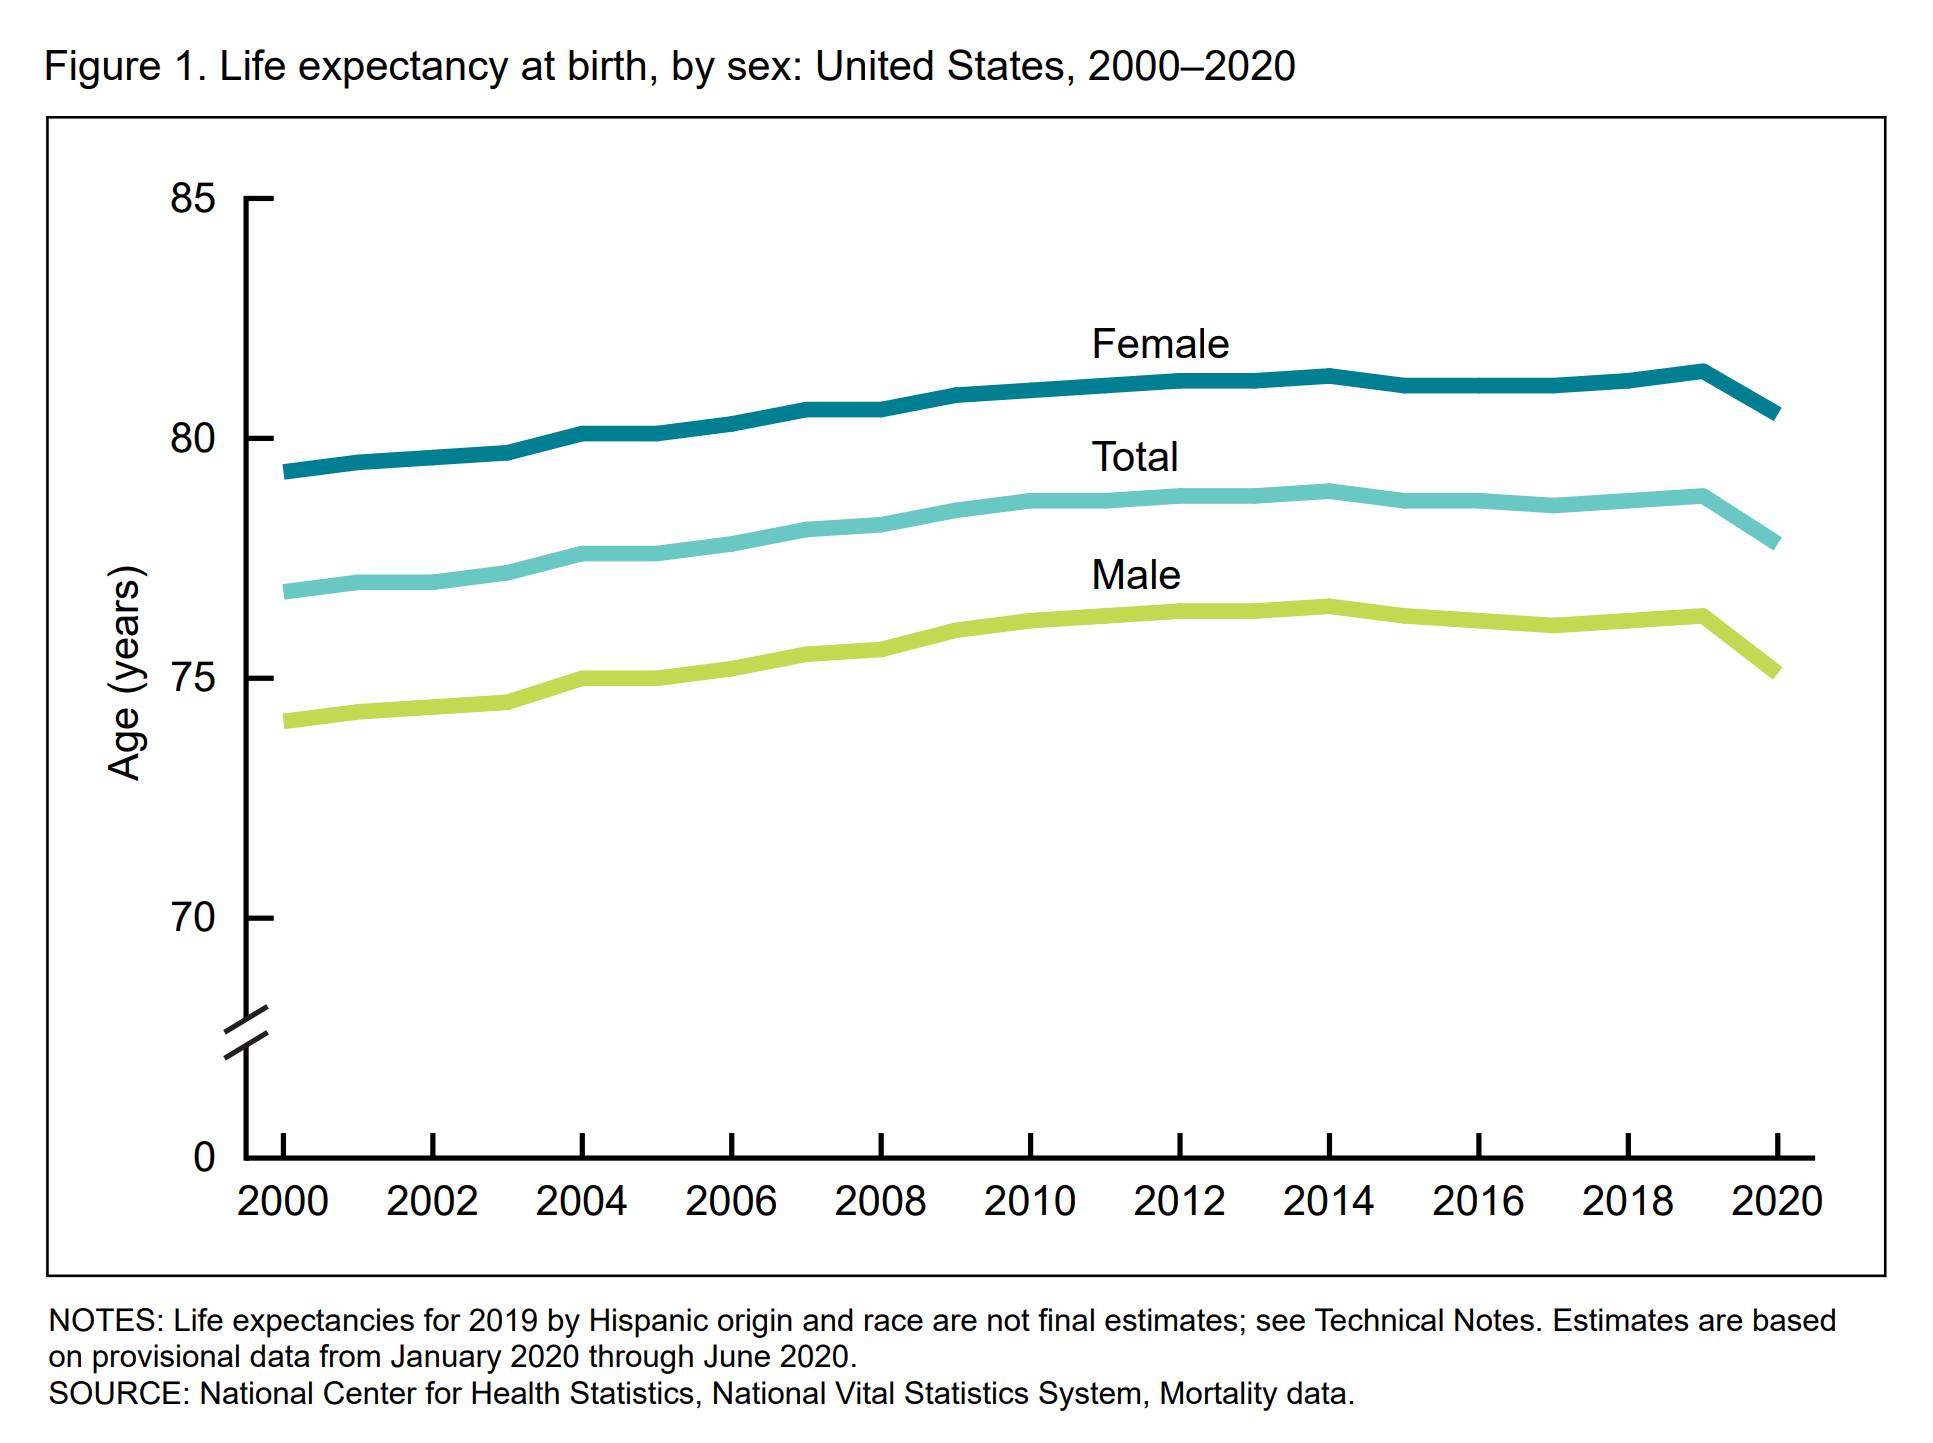
In the U.S., life expectancy continued its exceptional decline, which is unique among all the developed countries. Life expectancy for Black Americans saw the steepest drop in one year since the mid-1930s, during the Great Depression. The abrupt fall is “basically catastrophic,” said Mark Hayward, a University of Texas sociology professor who studies changes in U.S. mortality.
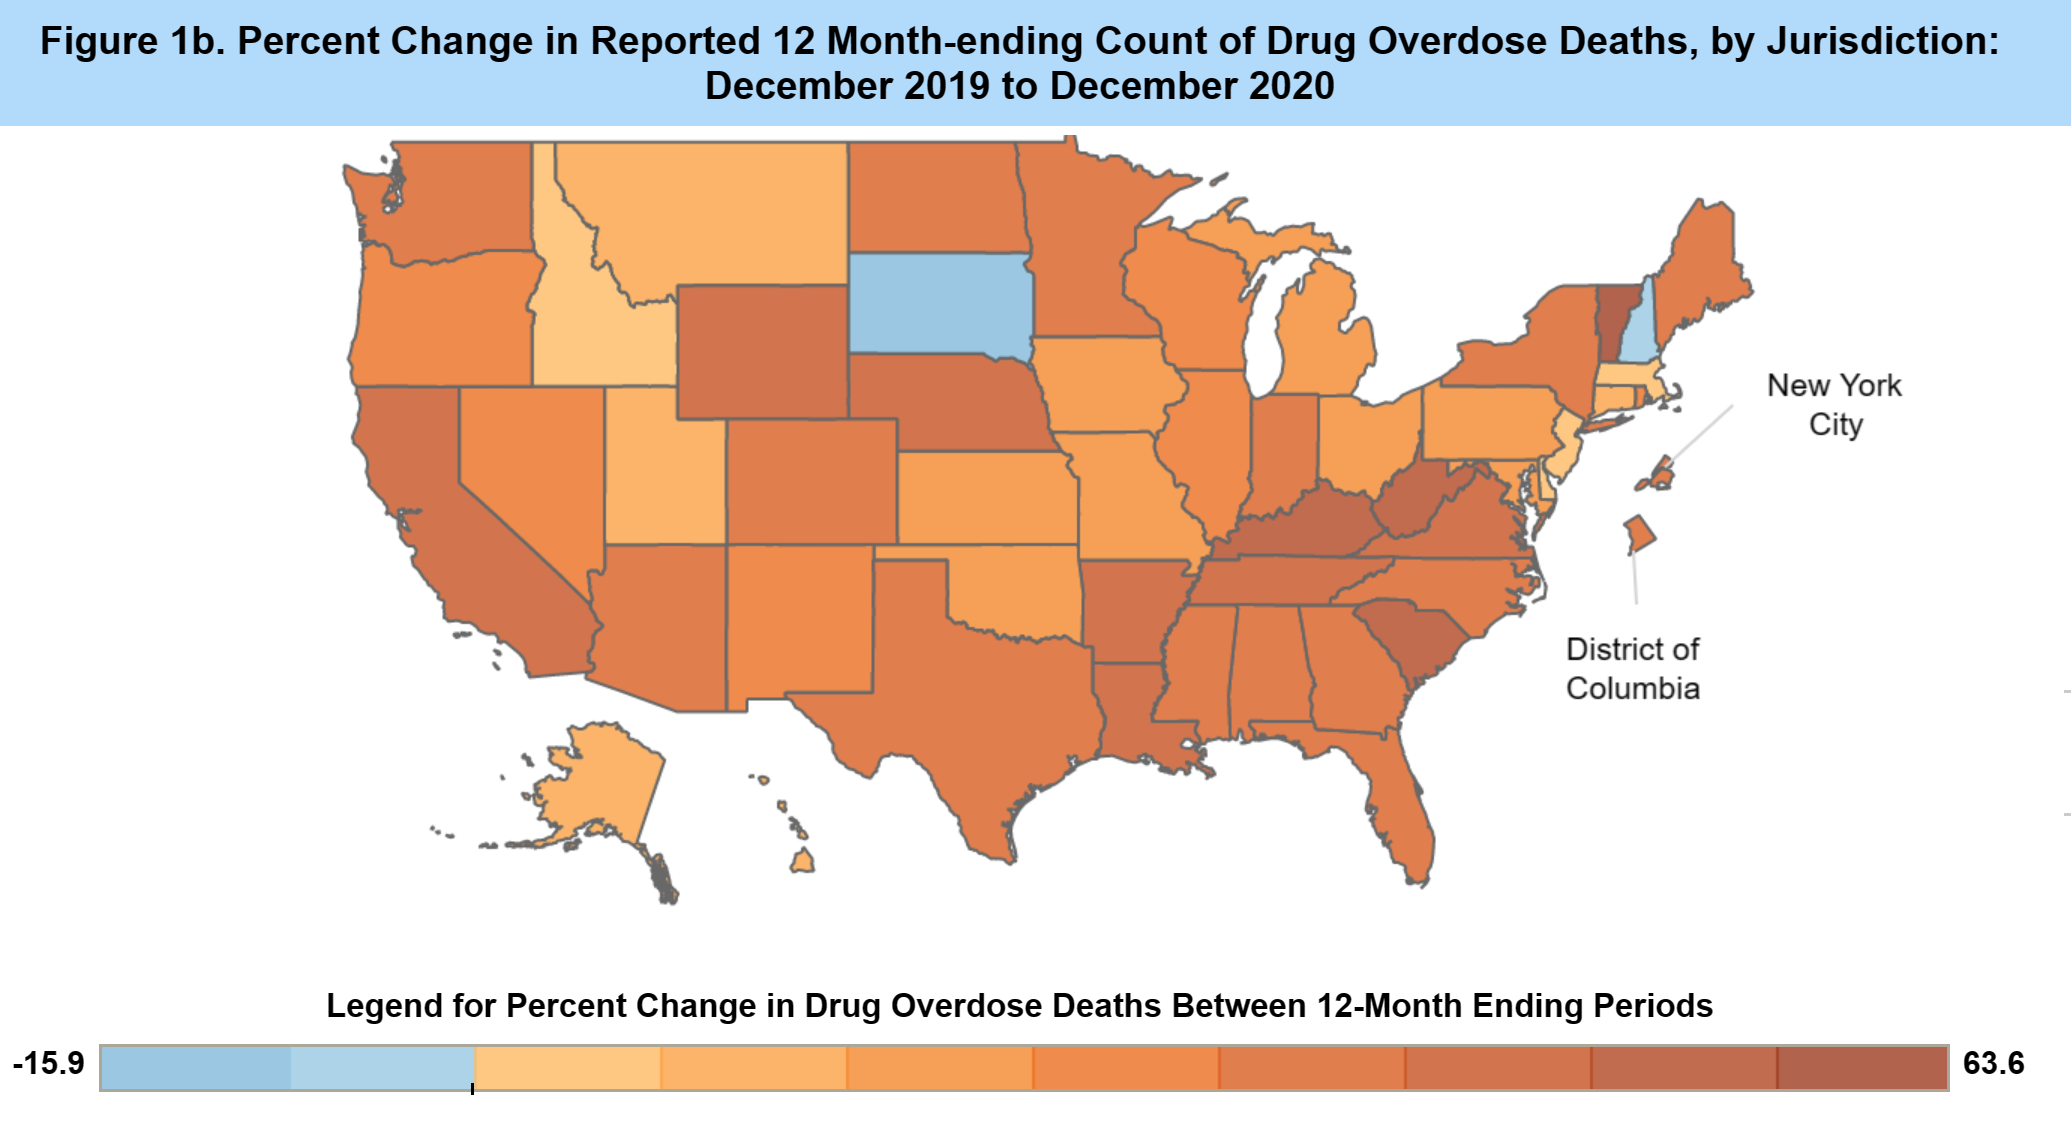
Rising inequality, a pandemic stretching into the foreseeable future, declining life expectancy, crazy weather caused by climate instability – it’s no surprise that “deaths of despair” in the U.S. from drug overdoses reached a record high in 2021, with no peak in sight.
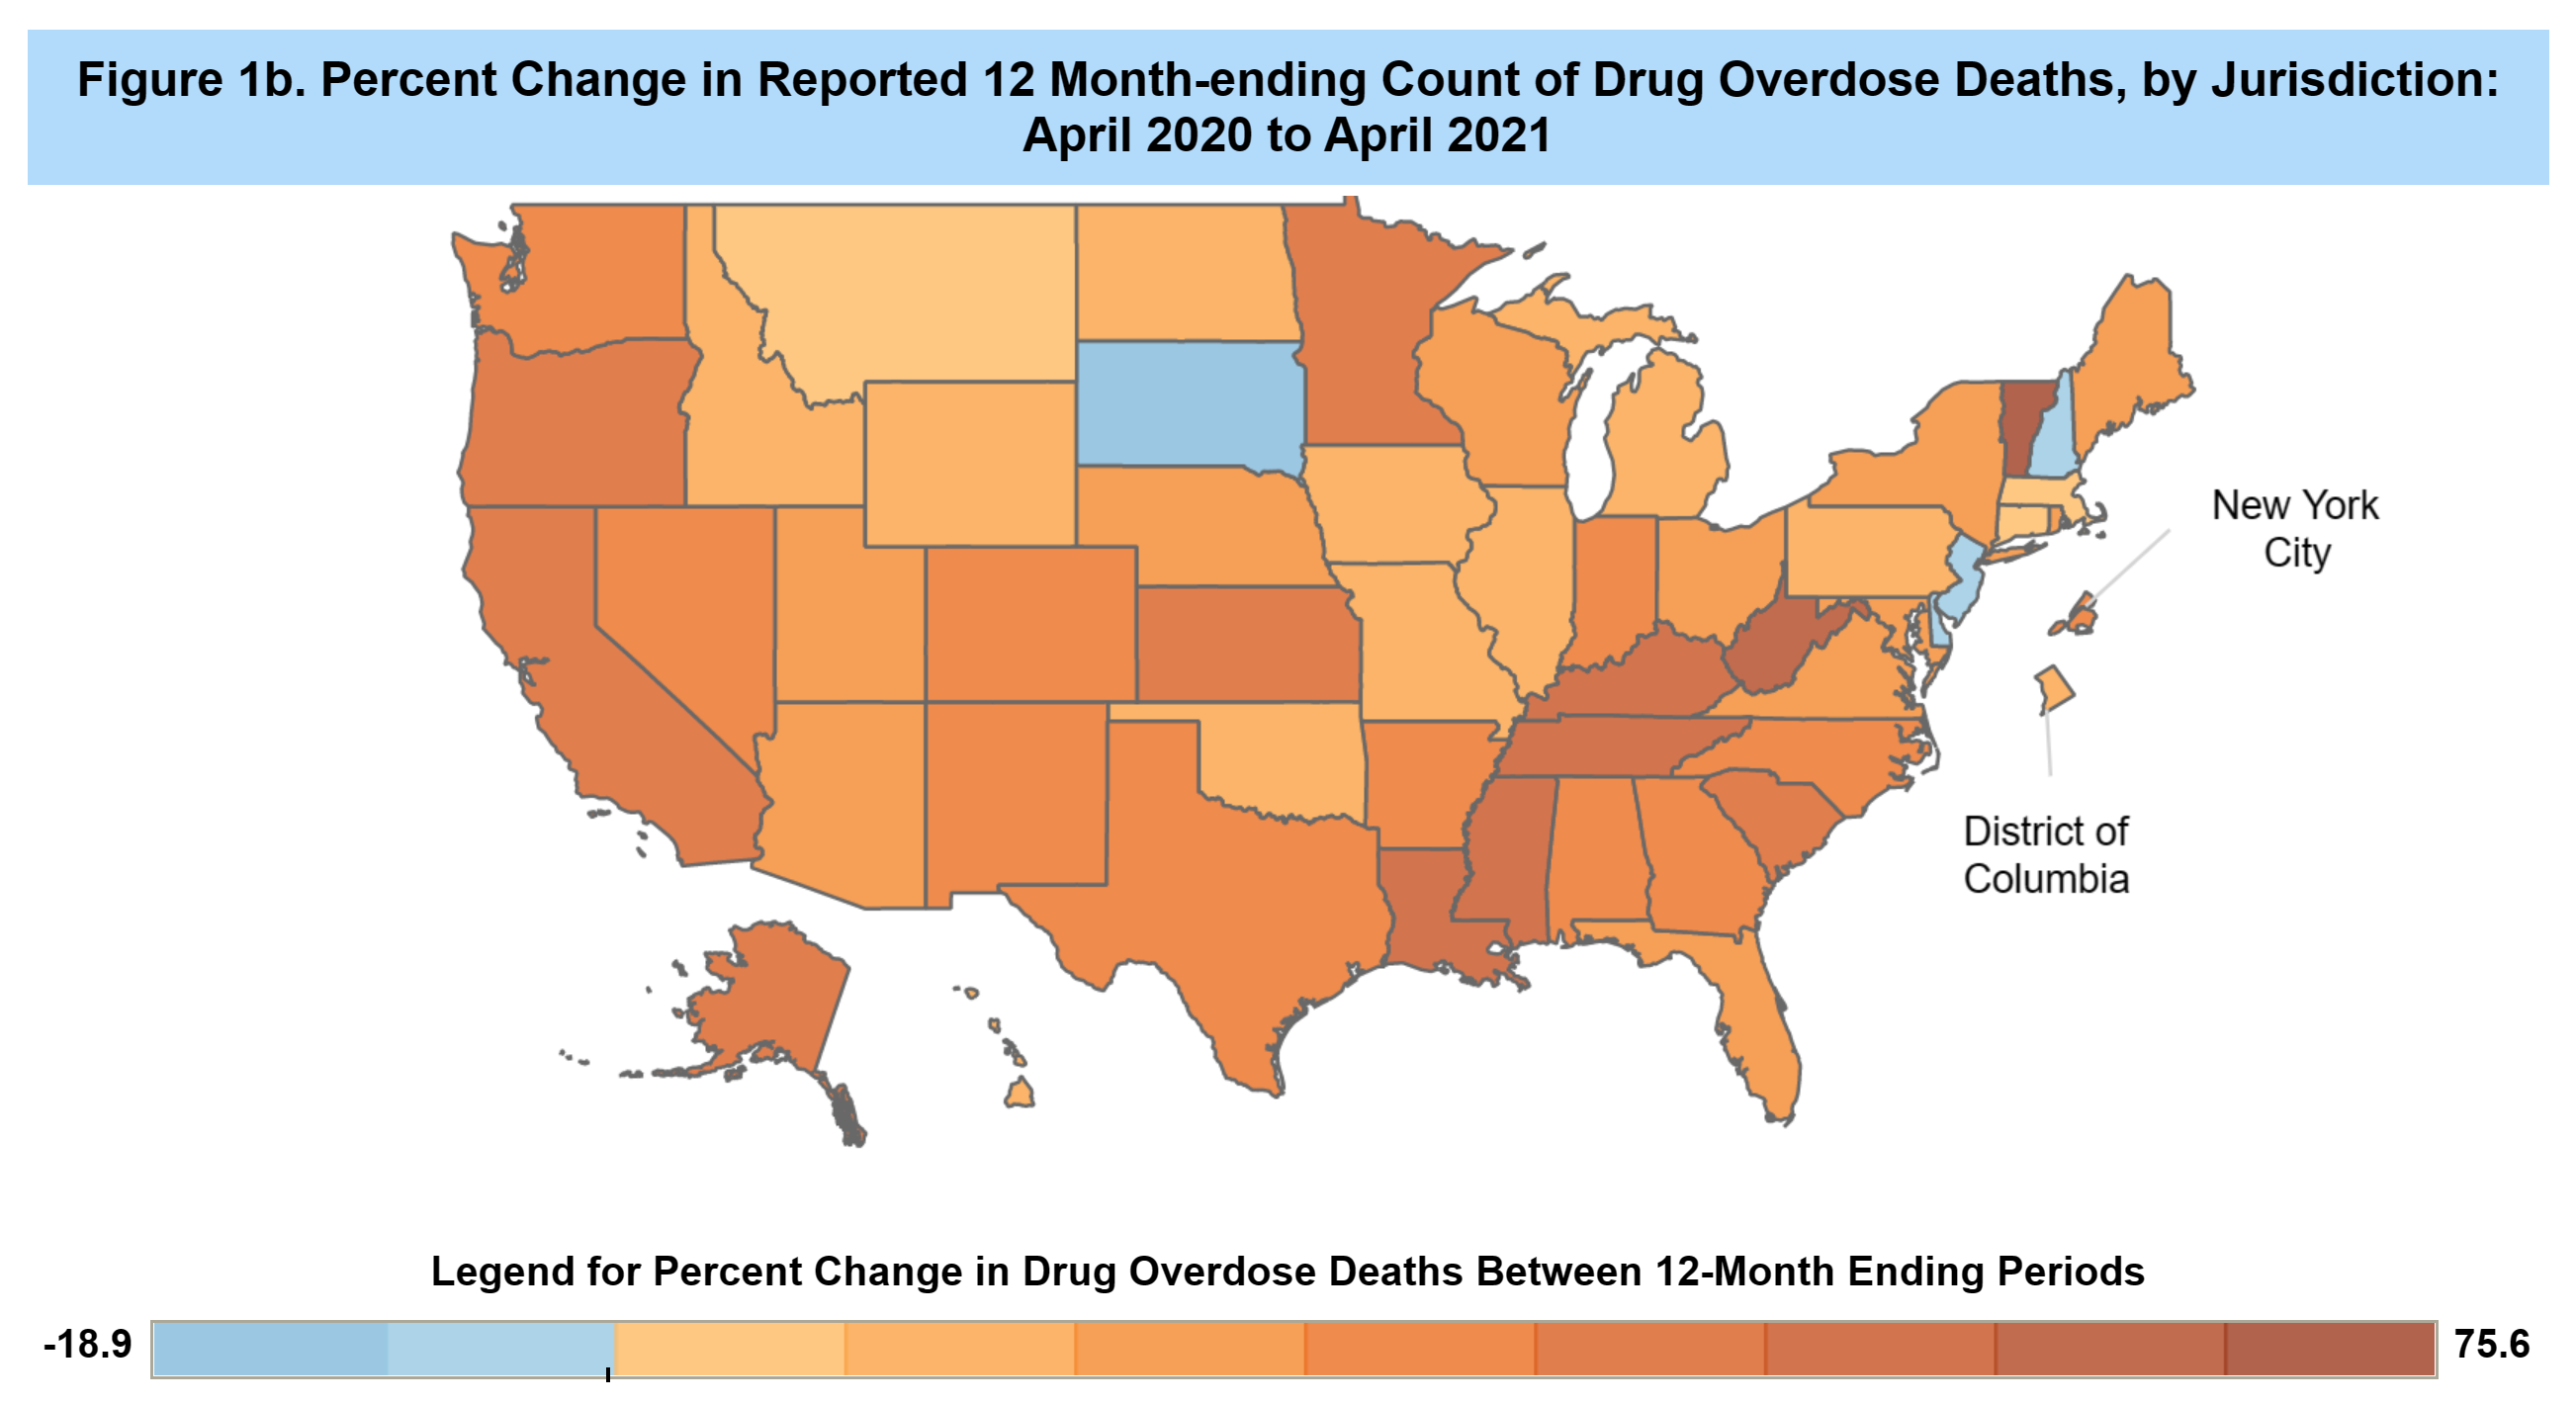
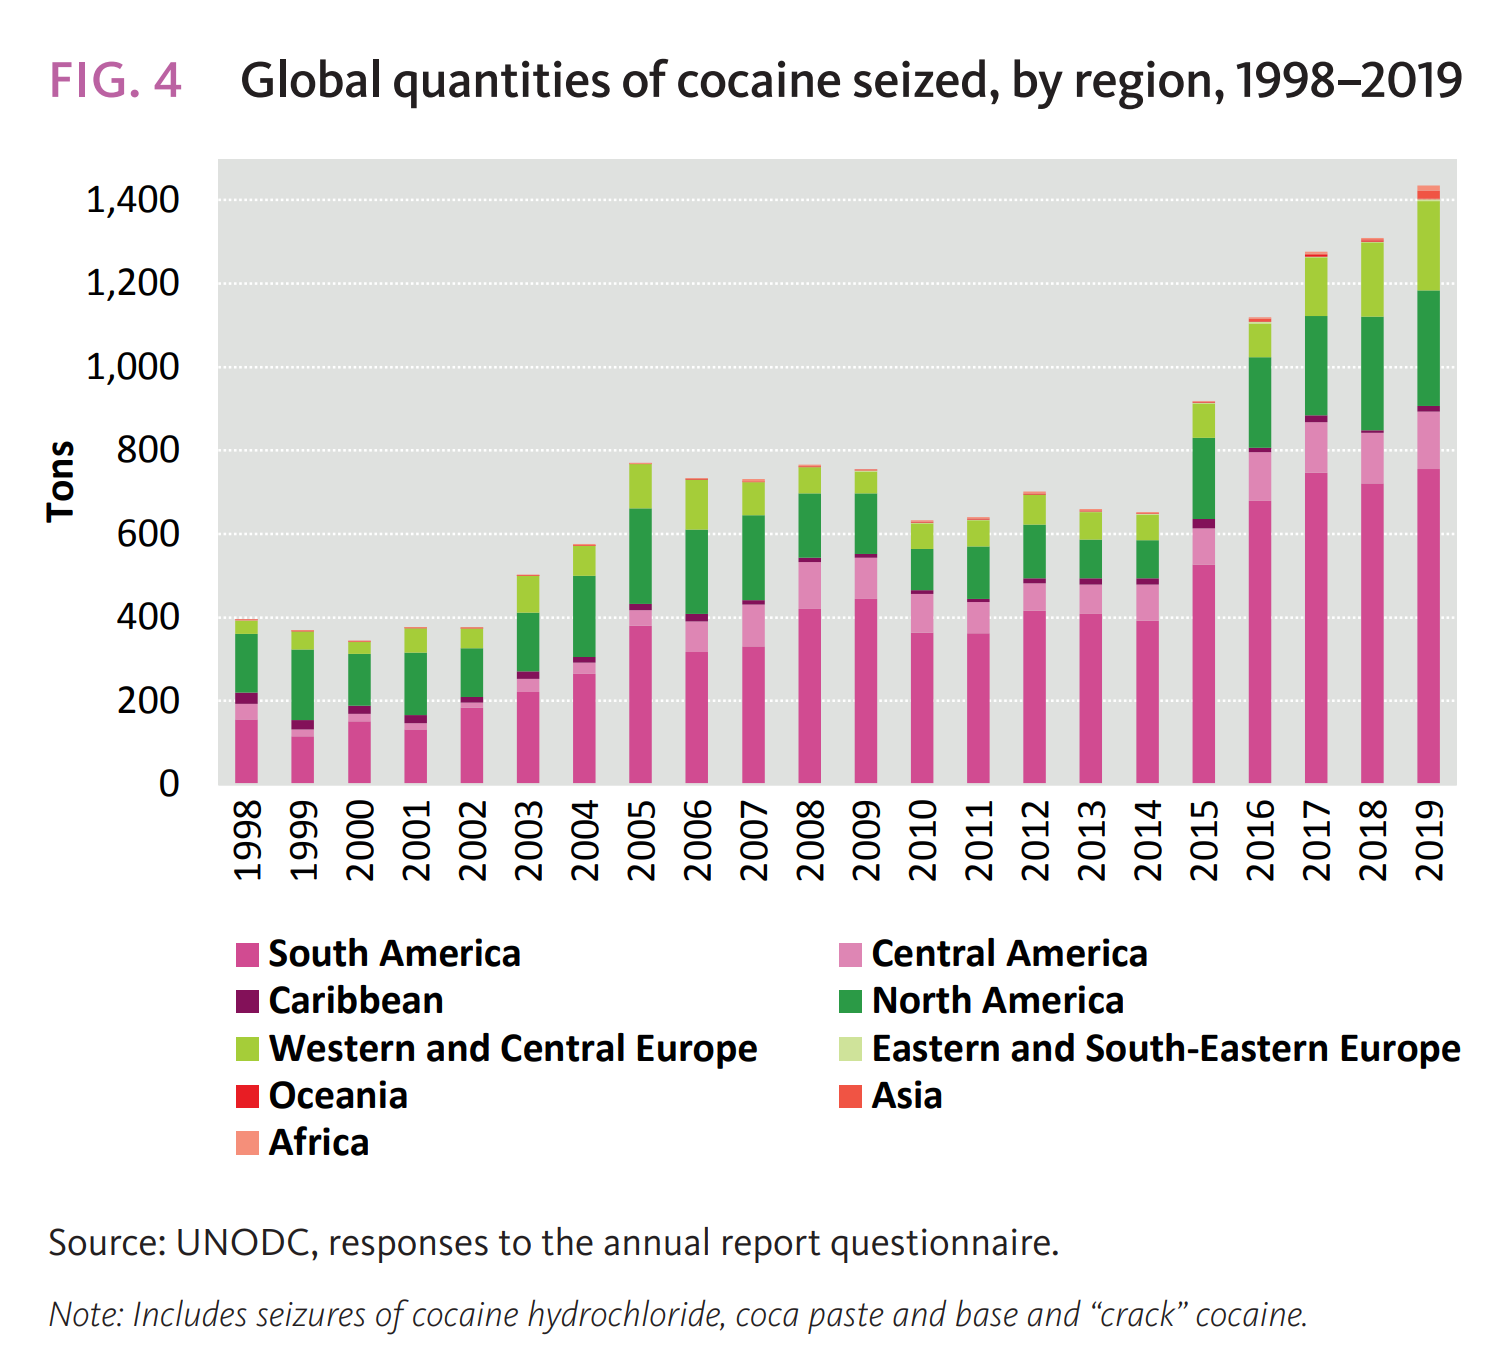
The Sackler family may be out of the opioid business, but the underworld has stepped in to fill the demand: the vast majority of U.S. overdose deaths are now caused by synthetic opioids, fueled by widespread use of fentanyl, a fast-acting drug that is immensely more powerful than morphine.
The Invisible Hand of the market works its magic again.
- Don’t miss the doomiest images for 2021.
- For the doomiest content going back to 2010, check out the Doomiest Images and Graphs Index.
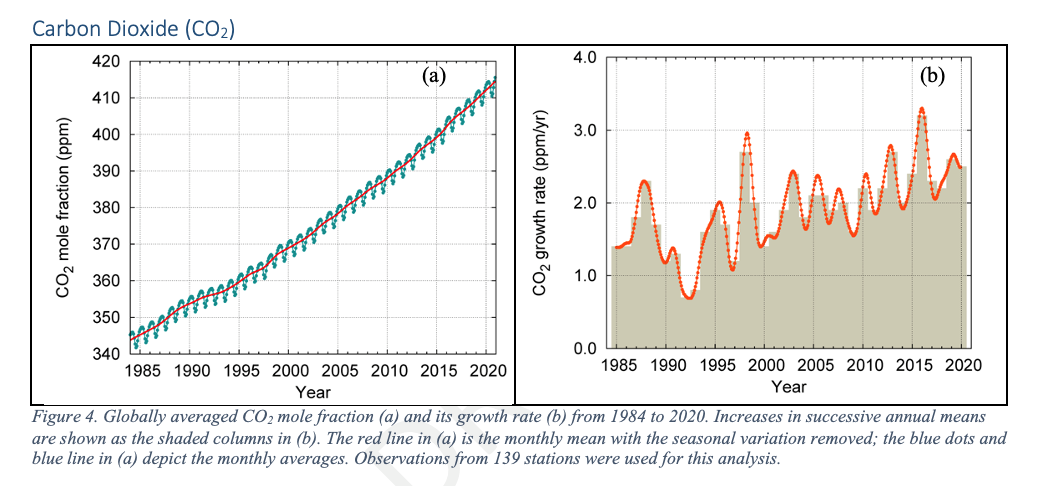


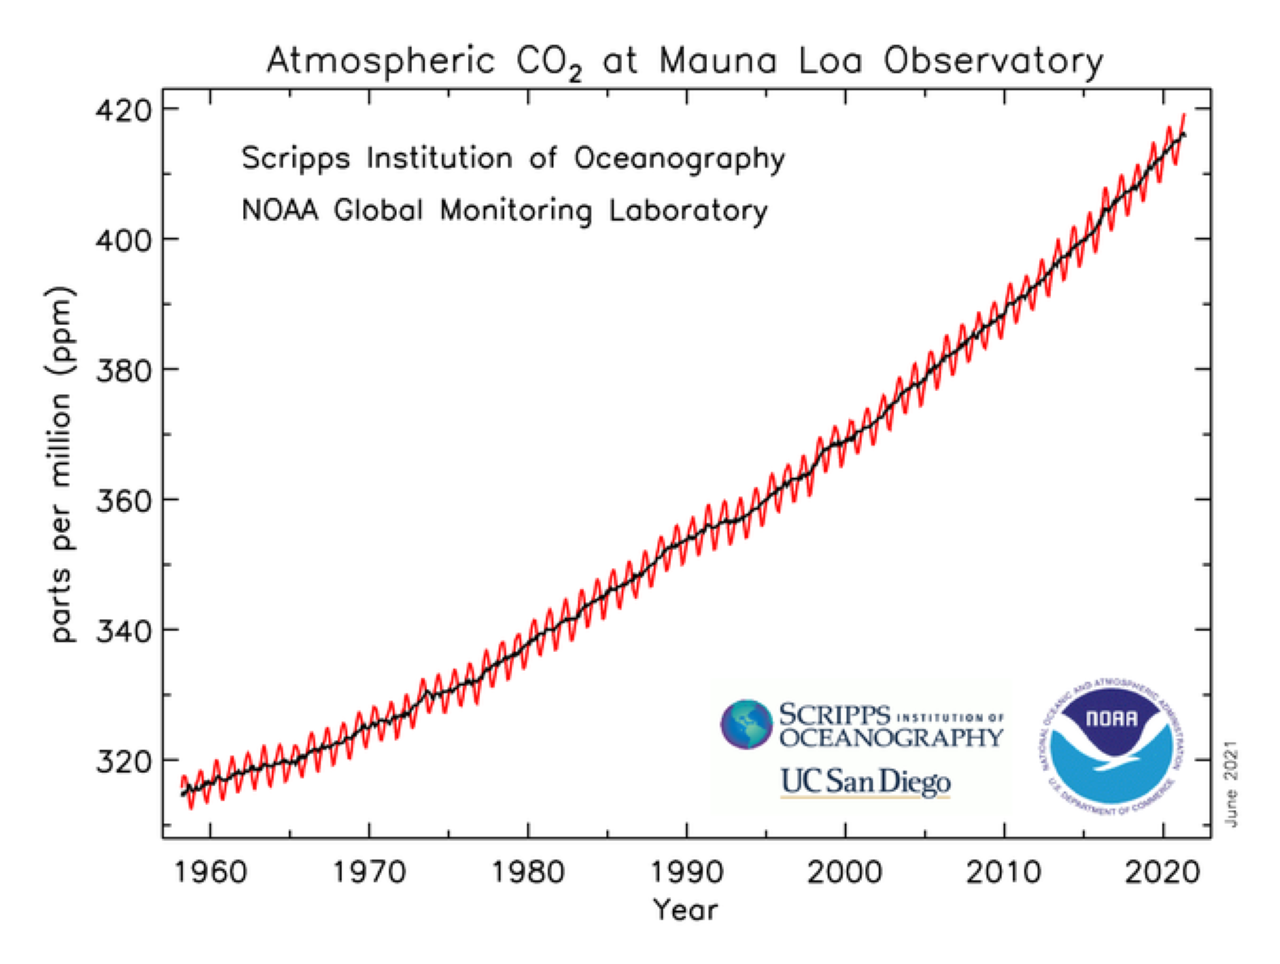
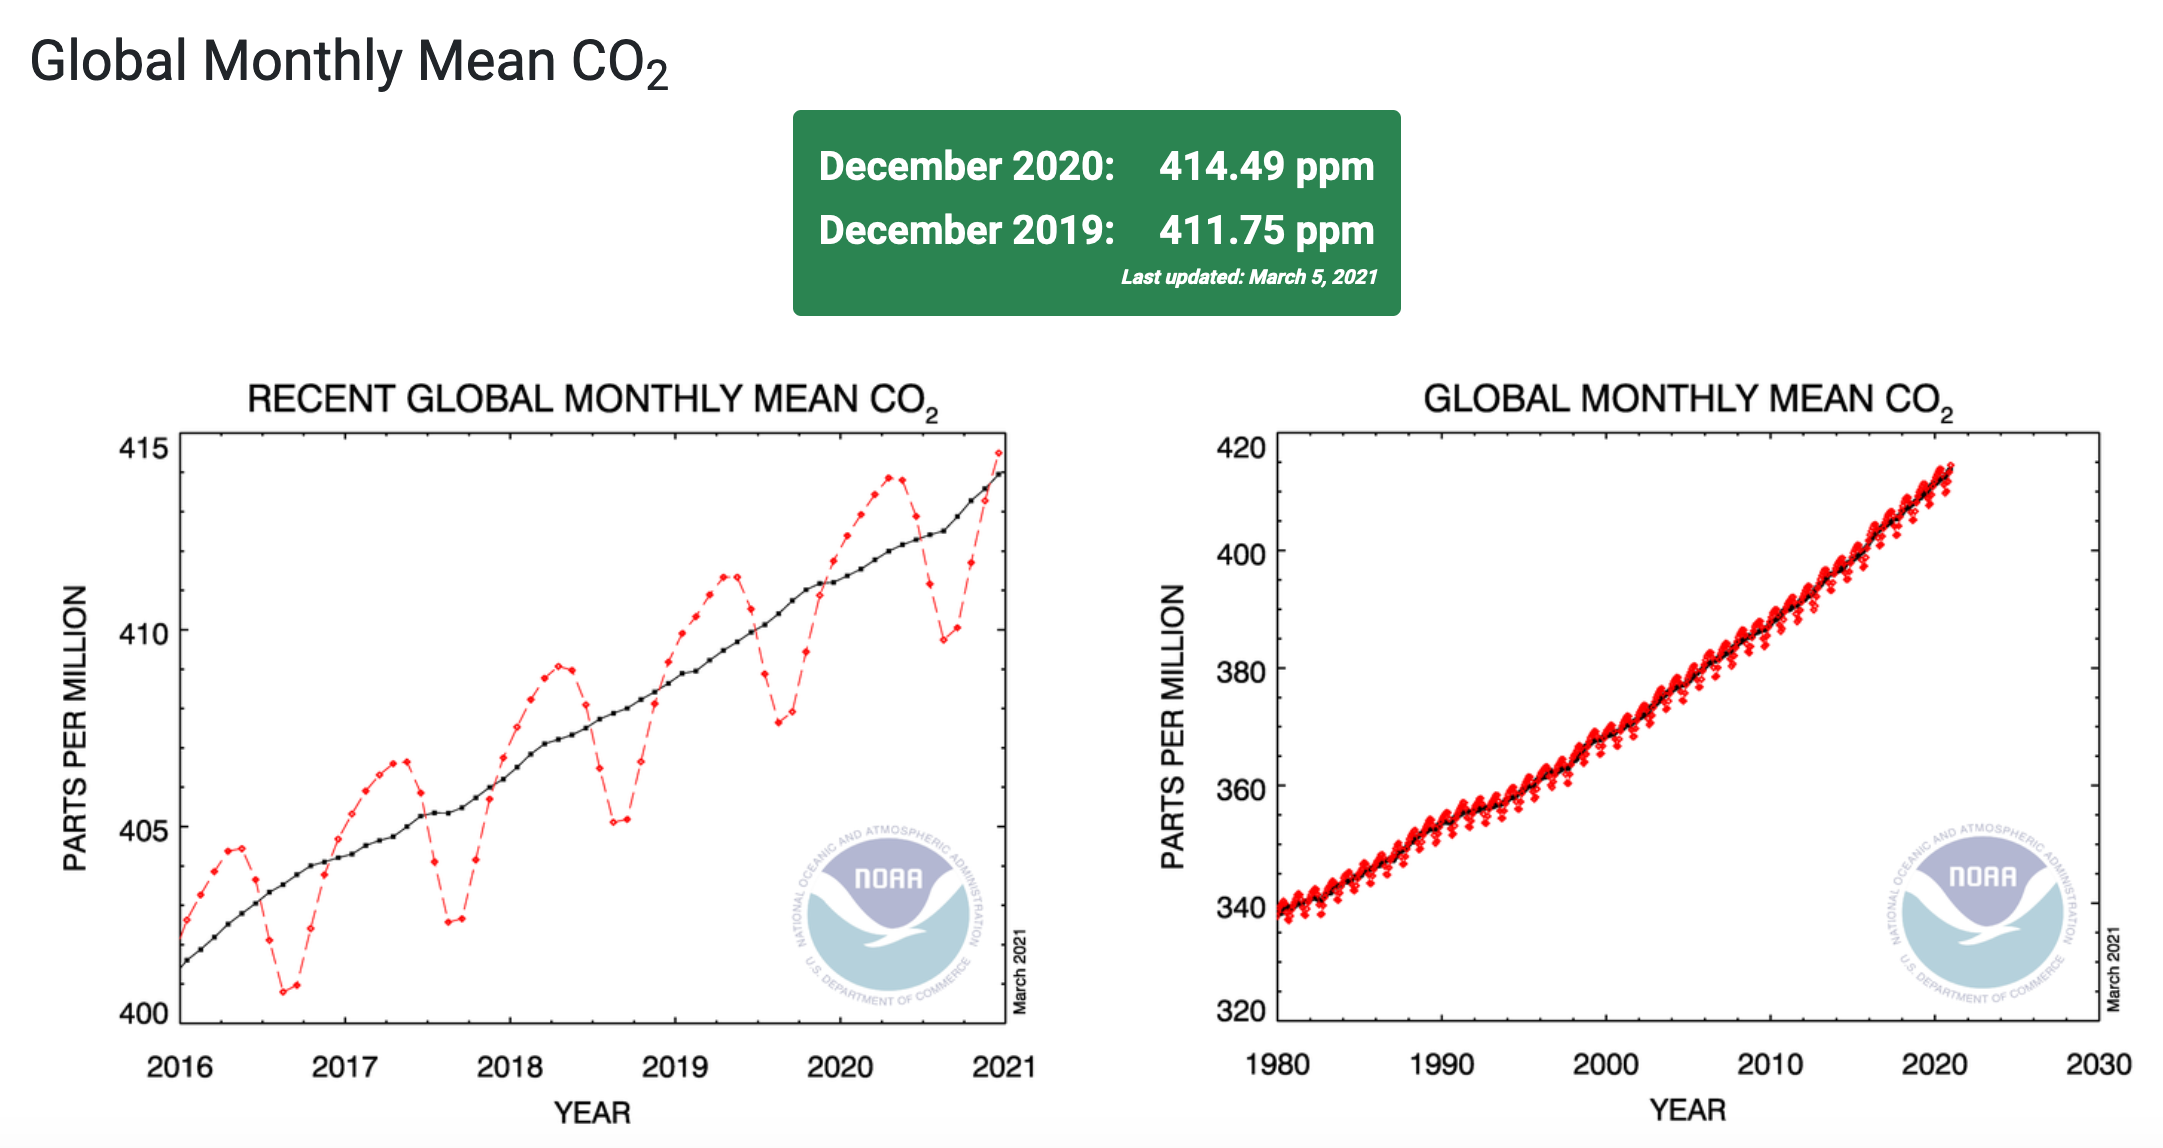
![Annual Greenhouse Gas Index (AGGI), 1750-2020. For 2020, the AGGI was a record high 1.47, representing an increase in total direct radiative forcing of 47 percent since 1990. This increase in CO2 is accelerating — while it averaged about 1.6 ppm per year in the 1980s and 1.5 ppm per year in the 1990s, the growth rate increased to 2.4 ppm per year during the last decade (2009-2020). Pre-1978 changes in the CO2-equivalent abundance and AGGI based on the ongoing measurements of all greenhouse gases reported here, measurements of CO2 going back to the 1950s from C.D. Keeling [Keeling et al., 1958], and atmospheric changes derived from air trapped in ice and snow above glaciers [Machida et al., 1995, Battle et al., 1996, Etheridge, et al., 1996; Butler, et al., 1999]. Equivalent CO2 atmospheric amounts (in ppm) are derived with the relationship between CO2 concentrations and radiative forcing from all long-lived greenhouse gases. Graphic: Butler and Montzka, 2021 / NOAA](https://desdemonadespair.net/wp-content/uploads/2021/05/AGGI-1750-2020-Butler-and-Montzka-2021-NOAA.png)


One Response
Comments are closed.