Global wealth inequalities are close to early 20th century levels, at the peak of Western imperialism – “The share of income presently captured by the poorest half of the world’s people is about half what it was in 1820”
8 December 2021 (World Inequality Lab) – […] An average adult individual earns PPP €16,700 (PPP USD23,380) per year in 2021, and the average adult owns €72,900 (USD102,600). These averages mask wide disparities both between and within countries. The richest 10% of the global population currently takes 52% of global income, whereas the poorest half of the population earns 8% of it. On average, an individual from the top 10% of the global income distribution earns €87,200 (USD122,100) per year, whereas an individual from the poorest half of the global income distribution makes €2,800 (USD3,920) per year (Figure 1).
Global wealth inequalities are even more pronounced than income inequalities. The poorest half of the global population barely owns any wealth at all, possessing just 2% of the total. In contrast, the richest 10% of the global population own 76% of all wealth. On average, the poorest half of the population owns PPP €2,900 per adult, i.e. USD4,100 and the top 10% own €550,900 (or USD771,300) on average (Figure 4).
MENA is the most unequal region in the world, Europe has the lowest inequality levels
Figure 2 shows income inequality levels across the regions. Inequality varies significantly between the most equal region (Europe) and the most unequal (Middle East and North Africa i.e. MENA). In Europe, the top 10% income share is around 36%, whereas in MENA it reaches 58%. In between these two levels, we see a diversity of patterns. In East Asia, the top 10% makes 43% of total income and in Latin America, 55%. […]
Contemporary global inequalities are close to early 20th century levels, at the peak of Western imperialism
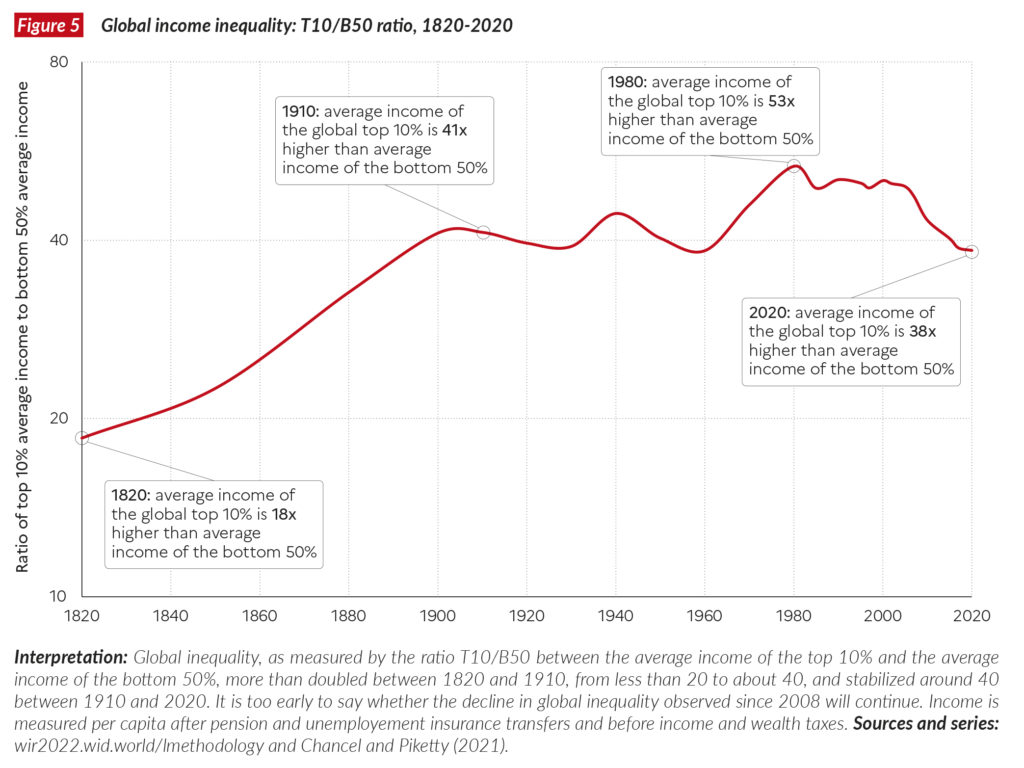
While inequality has increased within most countries, over the past two decades, global inequalities between countries have declined. The gap between the average incomes of the richest 10% of countries and the average incomes of the poorest 50% of countries dropped from around 50x to a little less than 40x (Figure 5). At the same time, inequalities increased significantly within countries. The gap between the average incomes of the top 10% and the bottom 50% of individuals within countries has almost doubled, from 8.5x to 15x (see Chapter 2). This sharp rise in within country inequalities has meant that despite economic catch-up and strong growth in the emerging countries, the world remains particularly unequal today. It also means that inequalities within countries are now even greater than the significant inequalities observed between countries (Figure 6).
Global inequalities seem to be about as great today as they were at the peak of Western imperialism in the early 20th century. Indeed, the share of income presently captured by the poorest half of the world’s people is about half what it was in 1820, before the great divergence between Western countries and their colonies (Figure 7). In other words, there is still a long way to go to undo the global economic inequalities inherited from the very unequal organization of world production between the mid-19th and mid-20th centuries.
Nations have become richer, but governments have become poor
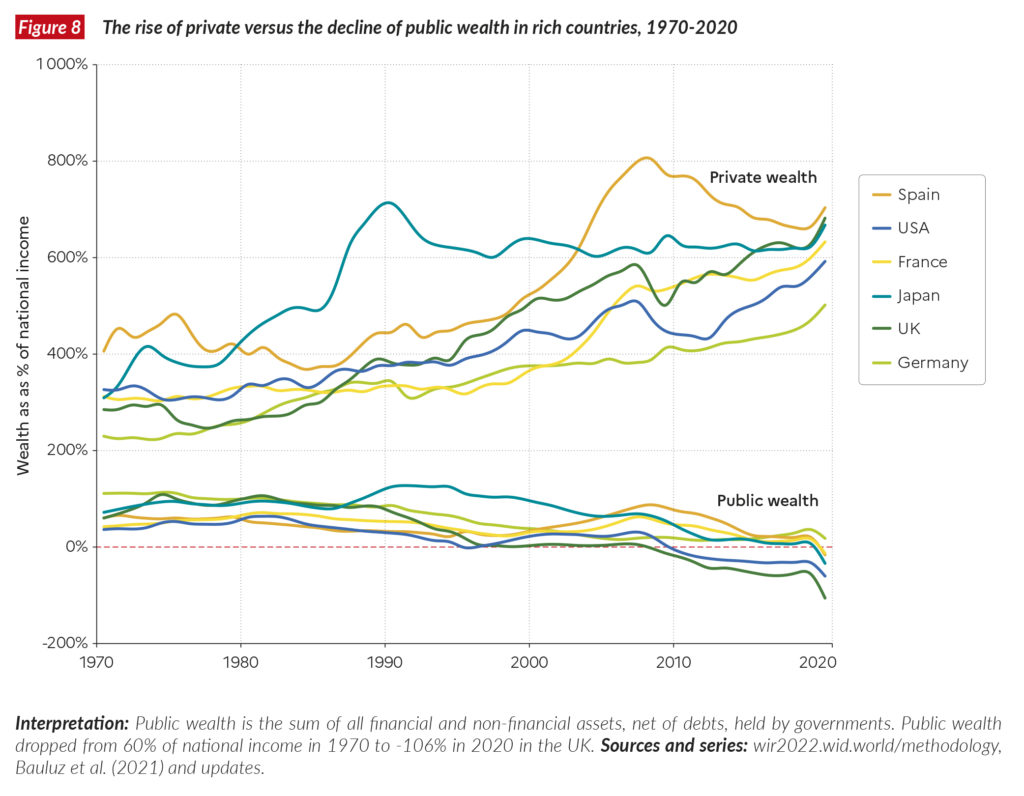
One way to understand these inequalities is to focus on the gap between the net wealth of governments and net wealth of the private sector. Over the past 40 years, countries have become significantly richer, but their governments have become significantly poorer. The share of wealth held by public actors is close to zero or negative in rich countries, meaning that the totality of wealth is in private hands (Figure 8). This trend has been magnified by the Covid crisis, during which governments borrowed the equivalent of 10-20% of GDP, essentially from the private sector. The currently low wealth of governments has important implications for state capacities to tackle inequality in the future, as well as the key challenges of the 21st century such as climate change.
Wealth inequalities have increased at the very top of the distribution
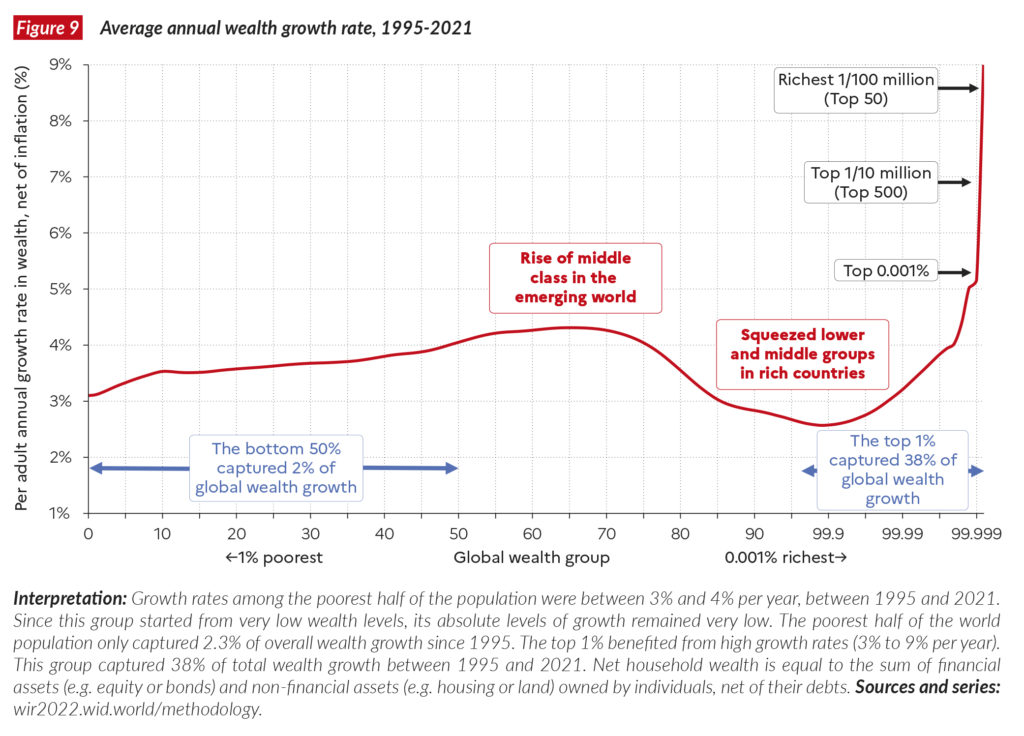
The rise in private wealth has also been unequal within countries and at the world level. Global multimillionaires have captured a disproportionate share of global wealth growth over the past several decades: the top 1% took 38% of all additional wealth accumulated since the mid-1990s, whereas the bottom 50% captured just 2% of it. This inequality stems from serious inequality in growth rates between the top and the bottom segments of the wealth distribution. The wealth of richest individuals on earth has grown at 6 to 9% per year since 1995, whereas average wealth has grown at 3.2% per year (Figure 9). Since 1995, the share of global wealth possessed by billionaires has risen from 1% to over 3%. This increase was exacerbated during the COVID pandemic. In fact, 2020 marked the steepest increase in global billionaires’ share of wealth on record (Figure 10). [more]