State of the Climate in 2021: Past seven years are on track to be the seven warmest on record – “Extreme events are the new norm”
GENEVA, 31 October 2021 (WMO) – Record atmospheric greenhouse gas concentrations and associated accumulated heat have propelled the planet into uncharted territory, with far-reaching repercussions for current and future generations, according to the World Meteorological Organization (WMO).
The past seven years are on track to be the seven warmest on record, according to the provisional WMO State of the Global Climate 2021 report, based on data for the first nine months of 2021. A temporary cooling “La Niña” event early in the year means that 2021 is expected to be “only” the fifth to seventh warmest year on record. But this does not negate or reverse the long-term trend of rising temperatures.
Global sea level rise accelerated since 2013 to a new high in 2021, with continued ocean warming and ocean acidification.
Extreme events are the new norm. There is mounting scientific evidence that some of these bear the footprint of human-induced climate change.
WMO Secretary-General Prof. Petteri
The report combines input from multiple United Nations agencies, national meteorological and hydrological services and scientific experts. It highlights impacts on food security and population displacement, harming crucial ecosystems and undermining progress towards the Sustainable Development Goals. It was released at a press conference on the opening day of the United Nations climate change negotiations, COP26.
“The provisional WMO State of the Global Climate 2021 report draws from the latest scientific evidence to show how our planet is changing before our eyes. From the ocean depths to mountain tops, from melting glaciers to relentless extreme weather events, ecosystems and communities around the globe are being devastated. COP26 must be a turning point for people and planet,” said United Nations Secretary-General António Guterres.
“Scientists are clear on the facts. Now leaders need to be just as clear in their actions. The door is open; the solutions are there. COP26 must be a turning point. We must act now – with ambition and solidarity – to safeguard our future and save humanity,” said Mr Guterres in a video statement.
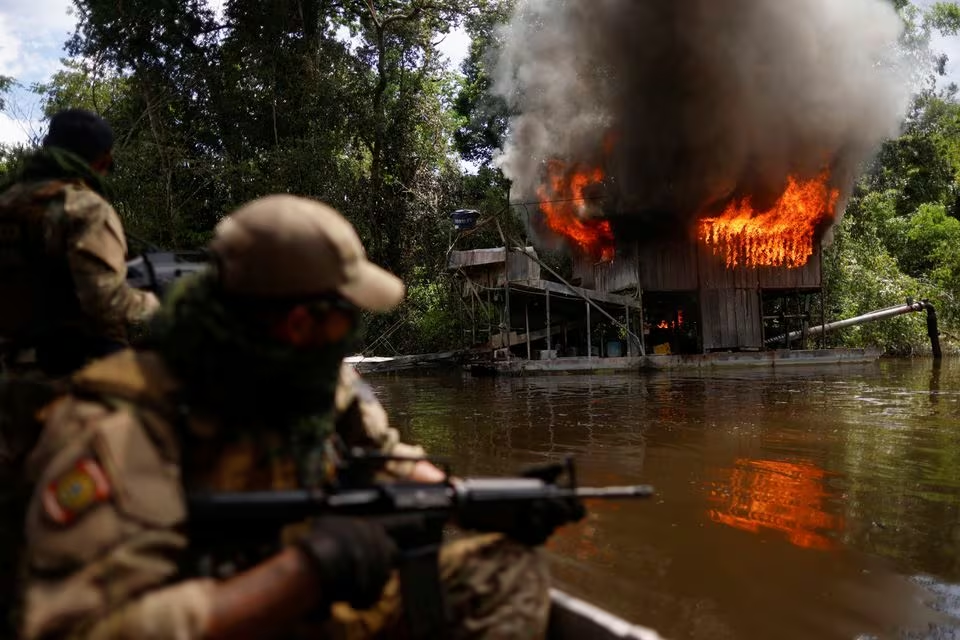
“It rained – rather than snowed – for the first time on record at the peak of the Greenland ice sheet. Canadian glaciers suffered rapid melting. A heatwave in Canada and adjacent parts of the USA pushed temperatures to nearly 50°C in a village in British Columbia. Death Valley, California reached 54.4 °C during one of multiple heatwaves in the southwestern USA, whilst many parts of the Mediterranean experienced record temperatures. The exceptional heat was often accompanied by devastating fires,” said WMO Secretary-General Prof. Petteri Taalas.
“Months’ worth of rainfall fell in the space of hours in China and parts of Europe saw severe flooding, leading to dozens of casualties and billions in economic losses. A second successive year of drought in sub-tropical South America reduced the flow of mighty river basins and hit agriculture, transport, and energy production,” said Prof. Taalas.
“Extreme events are the new norm,” said Prof. Taalas. “There is mounting scientific evidence that some of these bear the footprint of human-induced climate change.”
“At the current rate of increase in greenhouse gas concentrations, we will see a temperature increase by the end of this century far in excess of the Paris Agreement targets of 1.5 to 2 degrees Celsius above pre-industrial levels,” said Prof. Taalas. “COP26 is a make-or-break opportunity to put us back on track.” […]
Greenhouse Gases
In 2020, greenhouse gas concentrations reached new highs. Levels of carbon dioxide (CO2) were 413.2 parts per million (ppm), methane (CH4) at 1889 parts per billion (ppb)) and nitrous oxide (N2O) at 333.2 ppb, respectively, 149%, 262% and 123% of pre-industrial (1750) levels. The increase has continued in 2021.
Temperatures
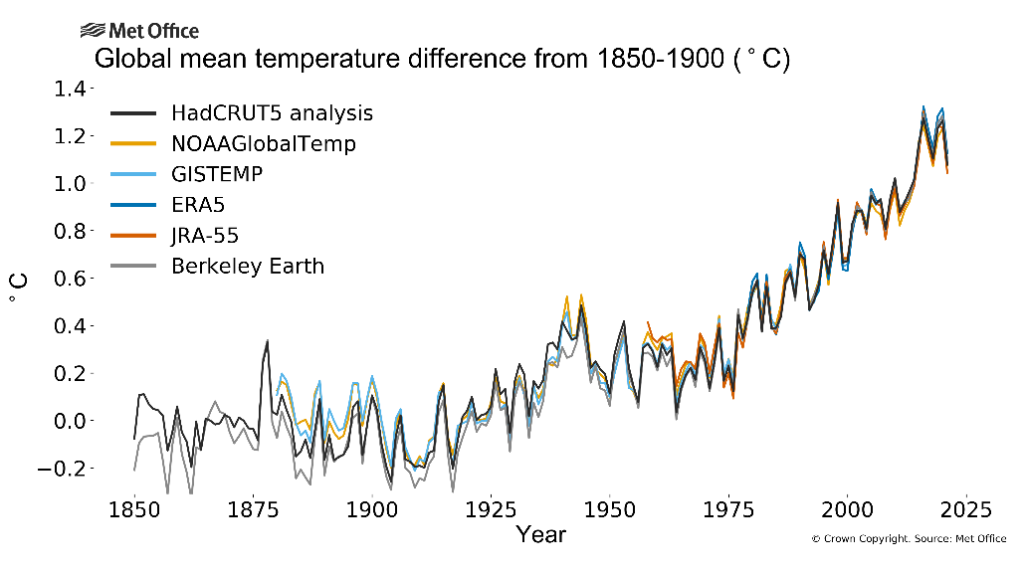
The global mean temperature for 2021 (based on data from January to September) was about 1.09°C above the 1850-1900 average. Currently, the six datasets used by WMO in the analysis place 2021 as the sixth or seventh warmest year on record globally. But the ranking may change at the end of the year.
It is nevertheless likely that 2021 will be between the 5th and 7th warmest year on record and that 2015 to 2021 will be the seven warmest years on record.
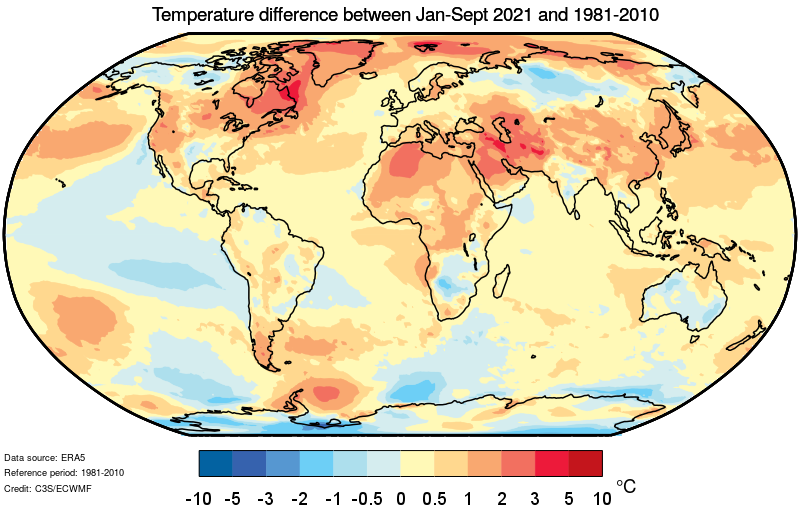
2021 is less warm than recent years due to the influence of a moderate La Niña at the start of the year. La Niña has a temporary cooling effect on the global mean temperature and influences regional weather and climate. The imprint of La Niña was clearly seen in the tropical Pacific in 2021.
The last significant La Niña event was in 2011. 2021 is around 0.18°C to 0.26 °C warmer than 2011.
As the 2020-21 La Niña has waned, monthly global temperatures have increased. The year 2016, which started during a strong El Niño, remains the warmest year on record in most of the data sets surveyed. […]
Sea level
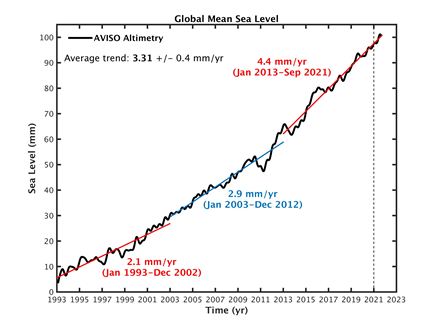
Global mean sea level changes primarily result from ocean warming via thermal expansion of sea water and land ice melt.
Measured since the early 1990s by high precision altimeter satellites, the mean global mean sea level rise was 2.1 mm per year between 1993 and 2002 and 4.4 mm per year between 2013 and 2021, an increase by a factor of 2 between the periods. This was mostly due to the accelerated loss of ice mass from glaciers and ice sheets. [more]