Changes to giant ocean eddies could have “devastating effects” globally – Scientists find “a global-scale reorganization of the ocean’s energy over the past three decades”
By Graham Readfearn
22 April 2021
(The Guardian) – Twirling and meandering ocean currents that help shape the world’s climate have gone through a “global-scale reorganisation” over the past three decades, according to new research.
The amount of energy in these ocean currents, which can be from 10km to 100km across and are known as eddies, has increased, having as yet unknown affects on the ocean’s ability to lock-away carbon dioxide and heat from fossil fuel burning.
One expert said the changes described in the research could affect the ability of the Southern Ocean, one of the world’s biggest natural carbon stores, to absorb CO2.
The study, published in the journal Nature Climate Change [pdf], analysed the temperature and height of the ocean with the help of data from altimeters on satellites from 1993 until 2020.
Like clouds and storms in the atmosphere, eddies are like weather events in the oceans happening from the surface down to a depth of several hundreds metres. The research found that eddies were intensifying in places where they are known to be most active.
As well as detecting changes in the Southern Ocean, the research also found changes in the southern Atlantic and the East Australian Current.
They found a significant increase in eddy strength over the Southern Ocean, as well as significant changes in their activity over the boundary currents – the intense flows of water along the boundaries of the major ocean basins, such as the Gulf Stream and the East Australian Current.
Lead researcher Josué Martínez Moreno, of the ARC Centre of Excellence for Climate Extremes and Australian National University, said the eddies were constantly merging and detaching from more permanent ocean currents.
The eddies played a “profound role” in moving heat, carbon and nutrients through the ocean and regulating the climate at regional and global scales, the research said.
Martínez Moreno said the research had revealed “a global-scale reorganisation of the ocean’s energy over the past three decades”. [more]
Changes to giant ocean eddies could have ‘devastating effects’ globally
Satellites reveal ocean currents are getting stronger, with potentially significant implications for climate change
By Navid Constantinou, Adele Morrison, Andrew Kiss, Andy Hogg, Josué Martínez Moreno, and Matthew England
22 April 2021
(The Conversation) – Scientists already know the oceans are rapidly warming and sea levels are rising. But that’s not all. Now, thanks to satellite observations, we have three decades’ worth of data on how the speeds of ocean surface currents are also changing over time.
In research published today in the journal Nature Climate Change we detail our findings on how ocean currents have become more energetic over large parts of the ocean. […]
How eddies have been changing
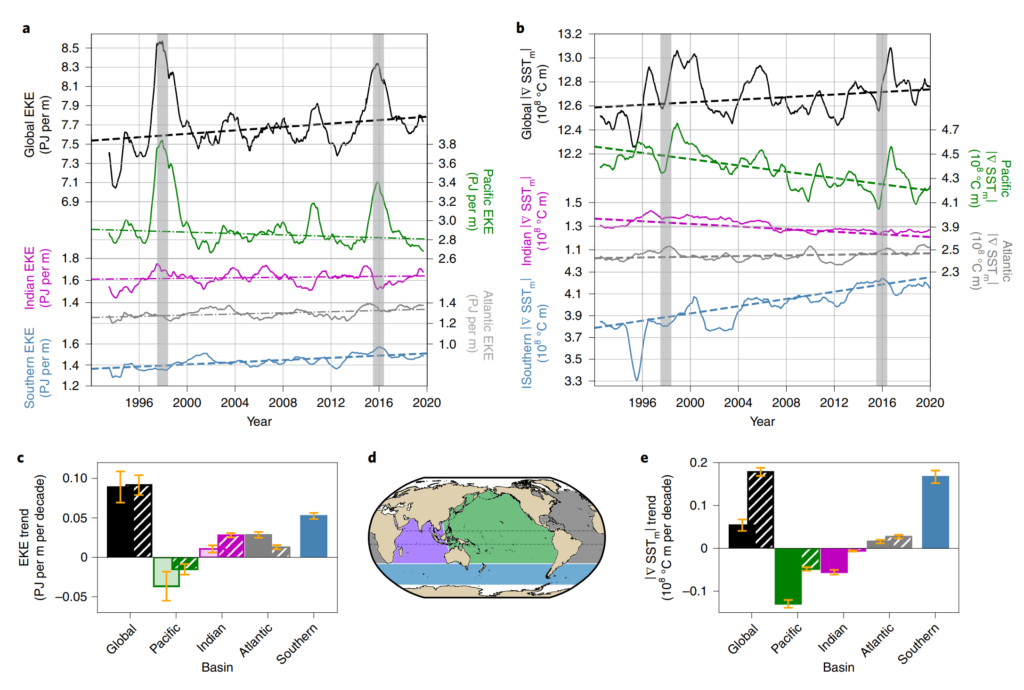
Using available data from 1993 until 2020, we analysed changes in the strength of eddies across the globe. We found regions already rich in eddies are getting even richer! And on average, eddies are becoming up to 5% more energetic each decade.
One of the regions we found with the biggest change is the Southern Ocean, where a massive 5% increase per decade was detected in eddy activity. The Southern Ocean is known to be a hotspot for ocean heat uptake and carbon storage.
Until recently, scientists could only observe changes in ocean eddies by using either sparse ocean measurements or the limited satellite record. The satellite record has only just become long enough for experts to draw robust conclusions about the likely longer-term trends of eddy behaviour.
Why is this important?
Ocean eddies play a profound role in the climate by regulating the mixing and transport of heat, carbon, biota, and nutrients in the oceans. Thus, our research may have far-reaching implications for future climate.
Scientists have known for decades that eddies in the Southern Ocean affect the overturning circulation of the ocean. As such, changes of the magnitude observed for eddies could impact the rate at which the ocean draws down heat and carbon.
But eddies are often not taken into account in climate predictions of a warming world. Since they are relatively small, they remain practically “invisible” in current models used to project future climate. [more]
Global changes in oceanic mesoscale currents over the satellite altimetry record
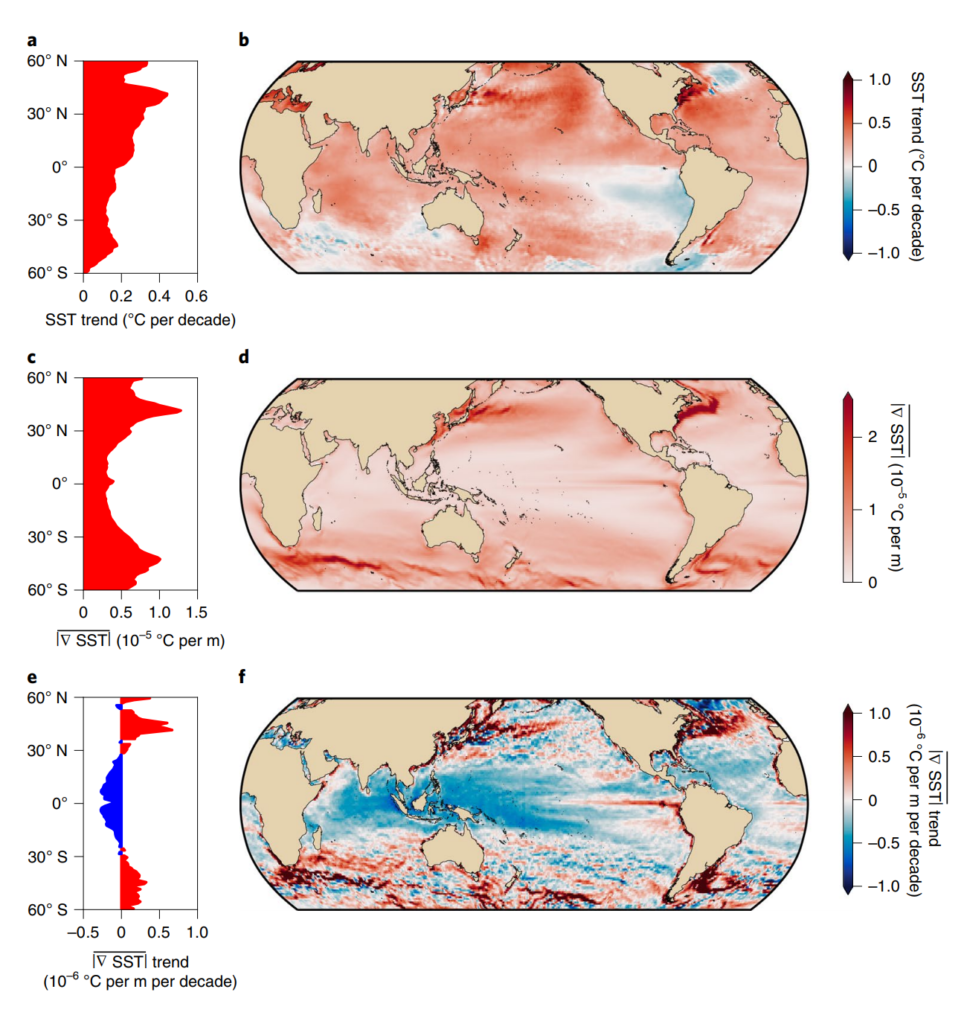
ABSTRACT: Oceanic mesoscale eddies play a profound role in mixing tracers such as heat, carbon and nutrients, thereby regulating regional and global climate. Yet, it remains unclear how the eddy field has varied over the past few decades. Furthermore, climate model predictions generally do not resolve mesoscale eddies, which could limit their accuracy in simulating future climate change. Here we show a global statistically significant increase of ocean eddy activity using two independent observational datasets of surface mesoscale eddy variability (one estimates surface currents, and the other is derived from sea surface temperature). Maps of mesoscale variability trends show heterogeneous patterns, with eddy-rich regions showing a significant increase in mesoscale variability of 2–5% per decade, while the tropical oceans show a decrease in mesoscale variability. This readjustment of the surface mesoscale ocean circulation has important implications for the exchange of heat and carbon between the ocean and atmosphere.
Global changes in oceanic mesoscale currents over the satellite altimetry record [pdf]

One Response
Comments are closed.