U.S. sea-level report cards: 2020 again trends toward acceleration – Water levels at 26 of 32 stations rose at higher rate than in 2019
By David Malmquist
24 January 2021
(VIMS) – Sea level “report cards” issued annually by researchers at William & Mary’s Virginia Institute of Marine Science add further evidence of an accelerating rate of sea-level rise during 2020 at nearly all tidal stations along the U.S. coastline.
The team’s web-based report cards project sea level to the year 2050 based on an ongoing analysis of tide-gauge records for 32 localities along the U.S. coast from Maine to Alaska. The analysis now includes 52 years of water-level observations, from January 1969 through December 2020. The interactive charts are available online at www.vims.edu/sealevelreportcards.
The project’s founder, VIMS emeritus professor John Boon, says “The year-to-year trends are becoming very informative. The 2020 report cards continue a clear trend toward acceleration in rates of sea-level rise at 27 of our 28 tide-gauge stations along the continental U.S. coastline.” The one continental outlier—in Crescent City, California—joins four Alaskan stations as sites where coastal uplift makes it appear sea level is falling relative to land.
VIMS marine scientist Molly Mitchell says “Seeing acceleration at so many of our stations suggests that—when we look at the multiple sea-level scenarios that NOAA puts out based on global models—we may be moving towards the higher projections.” Mitchell has partnered with Boon to generate the report cards each year since 2017.
“Acceleration can be a game changer in terms of impacts and planning, so we really need to pay heed to these patterns,” says Boon. “We have increasing evidence from the tide-gauge records that these higher sea-level curves need to be seriously considered in resilience-planning efforts,” adds Mitchell.
Boon says the report cards add value by providing sea-level projections that are updated more frequently than those issued by NOAA or other agencies. Boon and colleagues also use a statistical approach that includes evidence for the recent acceleration in the rate of sea-level change at many U.S. tide-gauge stations, and stress their use of relative sea-level measurements—changes in water level relative to the land surface on which people live and work. The relative sea-level rise in Virginia and other East and Gulf coast areas is due to both rising water and sinking land. […]
Overall Trends
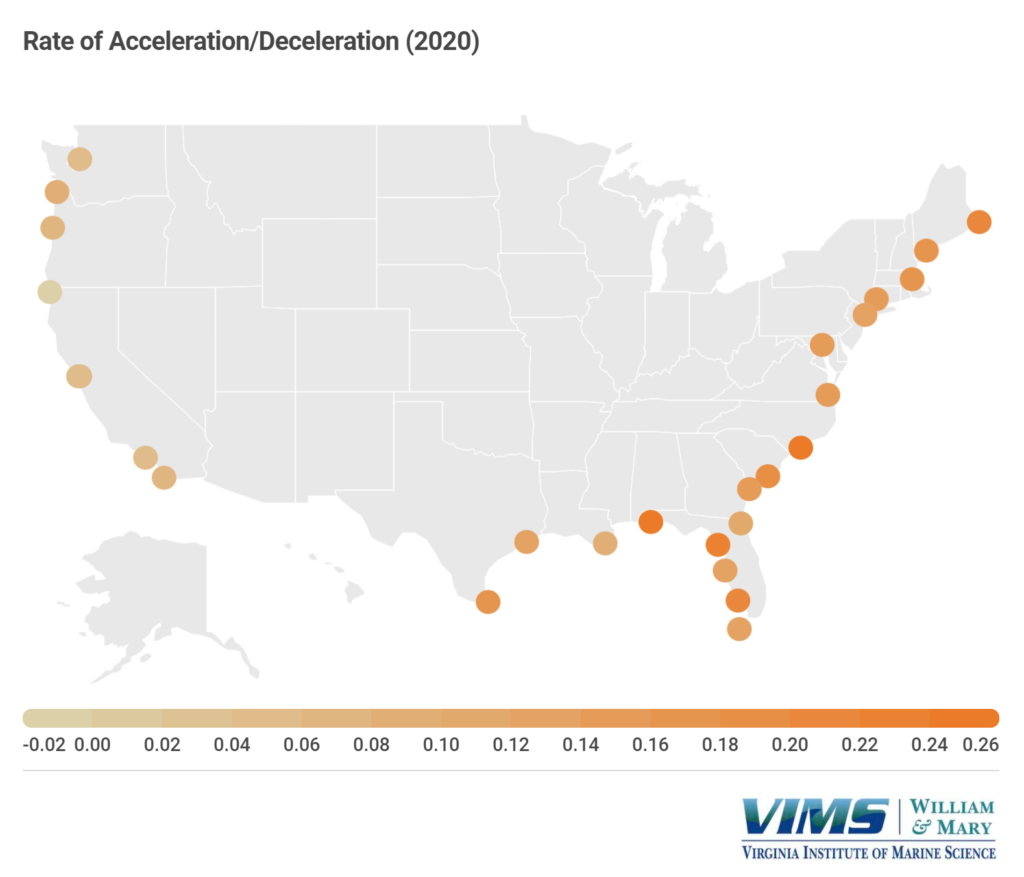
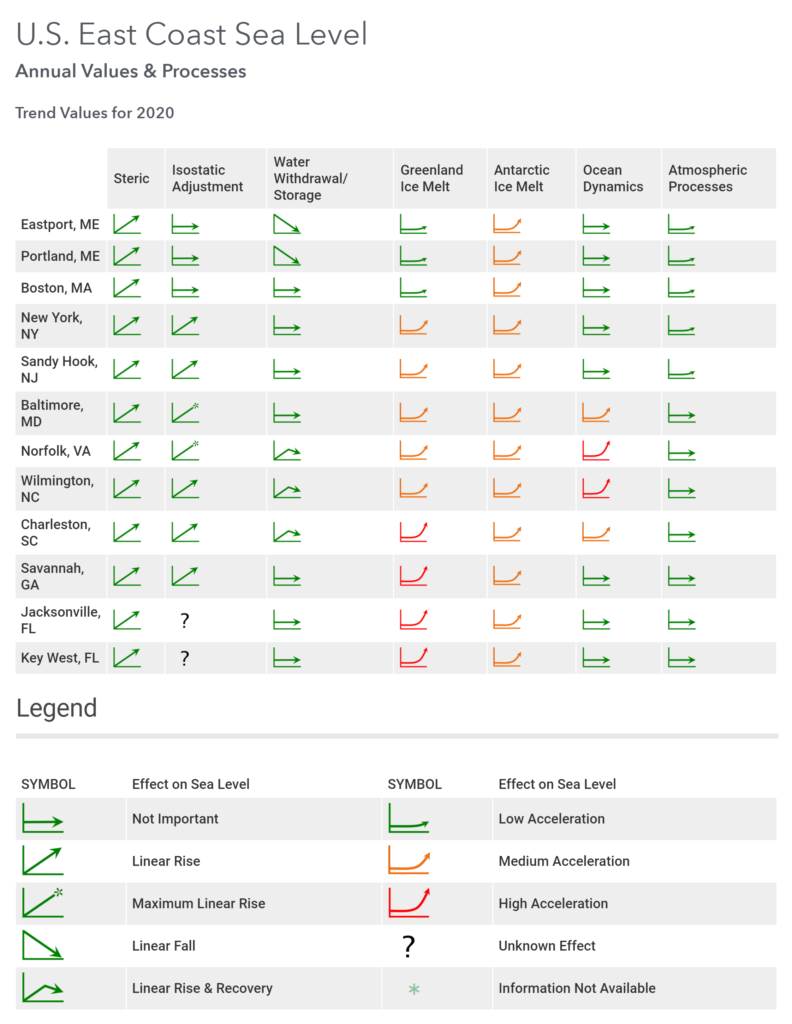
Previous work by Boon, Mitchell, and VIMS colleague Derek Loftis suggests the current acceleration in rates of sea-level rise began around 2013 or 2014, likely associated with ocean dynamics and ice-sheet loss. In 2020, rates of sea-level rise accelerated at all 21 of the report-card stations along the U.S. East and Gulf coasts, and at 7 of the 8 monitored stations along the U.S. West Coast excluding Alaska. All four stations monitored in Alaska show relative sea level falling at increasingly rapid rates. This is due to various processes causing rapid uplift of the coast, tide gauges rising along with the land they rest on.
Notable 2020 findings
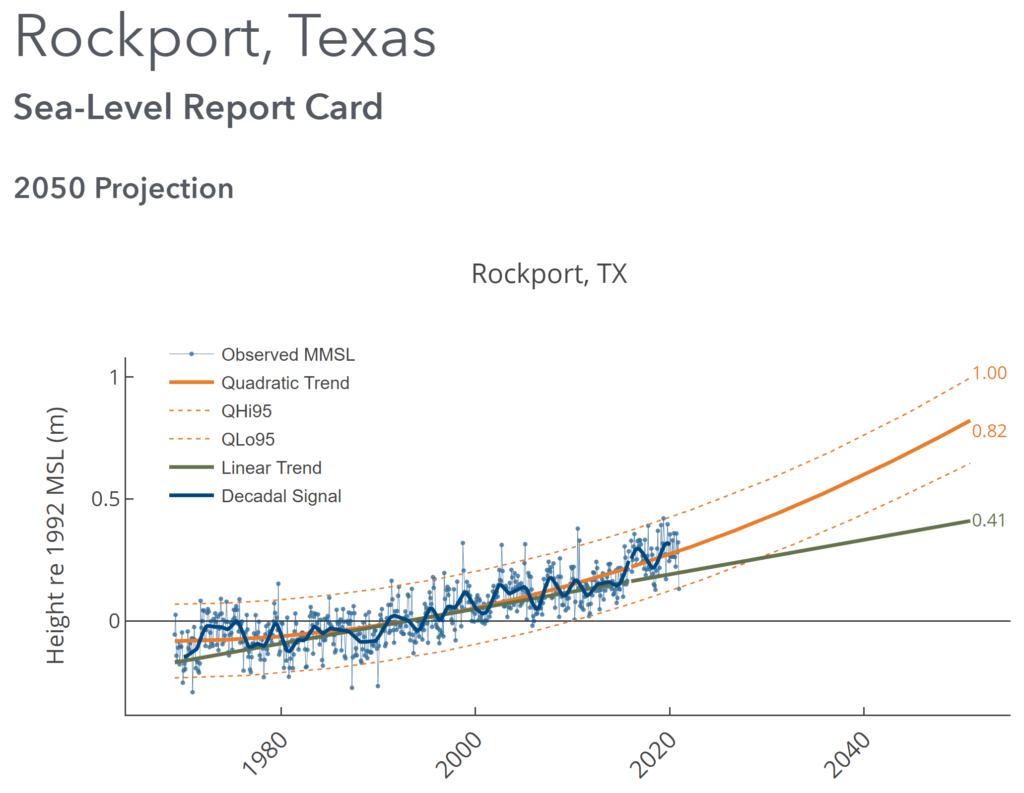
The 2020 report cards show an accelerating rate of sea-level rise at 27 of the 32 monitored stations. Rockport, Texas recorded the highest acceleration rate in 2020, with a value of 0.262 mm/y2. The next highest rates of acceleration were observed at Pensacola, FL (0.24 mm/yr2); Wilmington, NC (0.238 mm/yr2); Cedar Key, FL (0.21 mm/yr2); Naples, FL (0.199 mm/yr2); Eastport, ME (0.195 mm/yr2); Charleston, SC (0.181 mm/yr2); Portland, ME (0.166 mm/yr2); Boston, MA (0.165 mm/yr2); and Port Isabel, TX (0.16 mm/yr2). Significant acceleration in rates of sea-level rise at these widely distributed localities hints at global drivers, with climate change the obvious suspect. NOAA recently reported that 2020 was tied with 2016 as the warmest year on record. […]
Boon and Mitchell note that acceleration at these and other locations sharply increases their quadratic, “best-estimate” sea-level projections for 2050, despite in several cases a relatively low 2020 rise rate. For instance, Eastport, Maine had a rise rate of only 2.02 mm in 2020, but sea level there is projected to rise 0.41 m (1.3 feet) above 1992 levels by 2050. That 2050 projection is on par with the 0.51-m projection for Norfolk, Virginia (1.67 ft), even though the latter’s 2020 rise rate was 5.39 mm/yr, almost three times higher than in Eastport.
Mitchell explains further, “If you cross a threshold in terms of something like sea-level rise, what came before—say a tide-gauge record that began in 1900—is biased in terms of seeing where you’re going. We think ice sheets are melting faster today, and if that’s true then the previous 90 years of data won’t accurately predict the future.” [more]
U.S. sea-level report cards: 2020 again trends toward acceleration