Major wind-driven ocean currents are shifting toward the poles – “Over the past 40 years, all eight wind-driven surface current systems had shifted poleward”

24 February 2020 (AWI) – In the course of the past 40 years, the major wind-driven current systems in the ocean have steadily shifted toward the poles. Experts at the Alfred Wegener Institute, Helmholtz Centre for Polar and Marine Research (AWI), came to this conclusion after analysing long-term global satellite data on the ocean surface temperature and sea level height. Both datasets offer insights into the evolution of large-scale surface currents, and indicate that, in the Northern and Southern Hemisphere alike, the borders of the ocean gyres and their boundary currents are moving closer to the poles, at a rate of over 800 metres per year. This displacement of tremendous water masses is chiefly driven by global warming, as e.g. calculations using a new AWI climate model confirm. According to the AWI researchers, the consequences of this change can already be felt by human beings and the environment alike: in affected regions, the sea level is rising, indigenous species are migrating, and storms are now following new courses. The study was released today in the journal Geophysical Research Letters.
In our planet’s major wind-driven ocean currents, the water essentially moves around in a circle. There are eight such massive currents, technically referred to as ocean gyres – three in the Atlantic, three in the Pacific, and one each in the Indian and Antarctic Oceans. These rotating current systems largely determine the weather and marine productivity in our planet’s coastal regions. For example, at their western edge (e.g. the Gulf Stream), the five subtropical ocean gyres transport warmth and moisture from the tropics to the middle and higher latitudes, which in turn influences local air temperatures and precipitation. In contrast, at their eastern edge (e.g. the Canary Current), a phenomenon known as upwelling pushes nutrient-rich water up to the surface. This water is so teeming with algae, microorganisms and fish that the upwelling areas are also known as the “pantries” of the ocean.
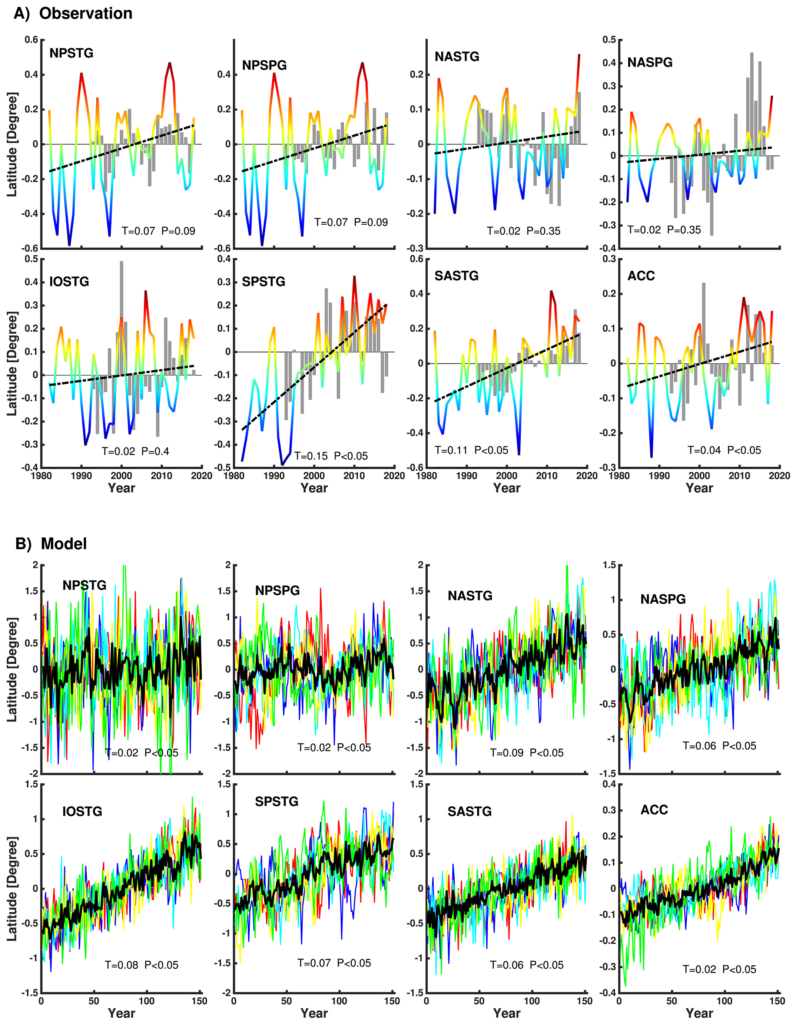
Until recently, monitoring the ocean gyres globally and on an extended basis was infeasible, due to the enormous costs involved in long-term oceanographic observation. But the AWI experts have now developed a new approach that solves the problem in a relatively simple way: the researchers analysed long-term satellite data on the ocean surface temperature and sea level height, and used the differences in temperature and height to reconstruct the positions and spatial extents of the major current systems. “When we compared the data, it became clear that, over the past 40 years, all eight wind-driven surface current systems had shifted poleward,” says AWI oceanographer Hu Yang, first author of the study.
The new method also makes it possible to measure the rate at which these currents are shifting: currently 800 metres per year on average. “These changes are particularly apparent in the Southern Hemisphere. In the Northern Hemisphere, factors like the positions of the continents and changes in the Arctic sea ice also affect the courses of the currents; as a result, we also found considerable natural fluctuations, which motivated us to find out which processes are responsible for the shift, and to what extent,” Yang explains.
Simulations with the new AWI climate model reveal the influence of global warming
To do so, the researchers simulated the evolution of the current systems, e.g. with the new AWI climate model. In the first simulations, the starting conditions were equivalent to those for a world with the same level of atmospheric carbon dioxide content as in 1850, the dawn of industrialisation. The experts then gradually raised the amount of CO2 in the Earth’s atmosphere until it was twice the 1850 level, and calculated the potential current development for a range of initial climatic conditions.
Thanks to their advanced modelling efforts, the team succeeded in precisely discriminating between changes caused by global warming, and those produced by natural variations. “Our calculations for a world with high carbon dioxide values produced the same trends that we saw in the satellite data. And we’re seeing similar changes in the analyses we run with other available model runs from around the globe. In this way, we can show that global warming is a major motor for these shifting currents,” says co-author and AWI climate modeller Prof Gerrit Lohmann.
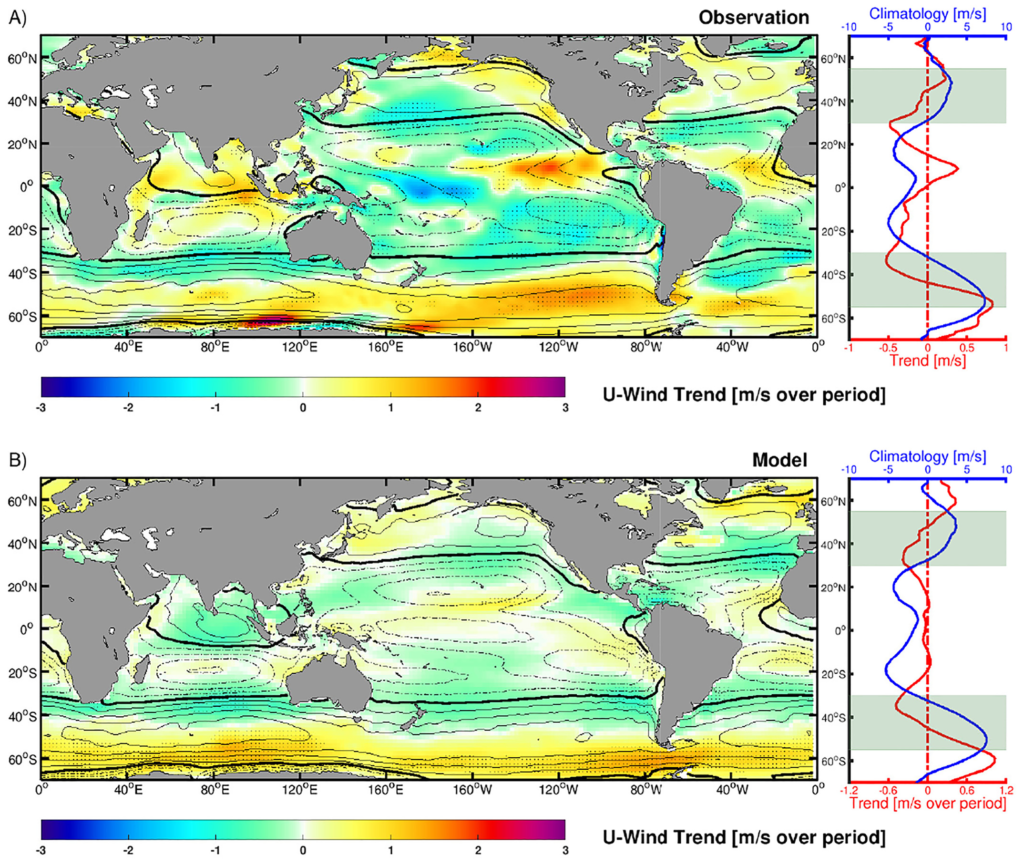
In addition, the climate simulations offer clues as to which processes in the interaction of the ocean and atmosphere are contributing to the shift. According to Lohmann, “We can see, in various types of observational data, and in our model runs, that the winds powering the currents are now moving poleward. How the individual components of the climate system are interlinked in this regard is an aspect we’re now investigating in follow-up projects.”
The team’s new findings build on those from previous studies, which indicated that especially the gyres’ eastern and western boundary currents were moving toward the poles. “For example, the climate data confirm that during the last ice age, the Agulhas Current was seven degrees of latitude closer to the Equator than it is today,” says Hu Yang. In order to more precisely measure the speed and the drivers of the shift, the long-term satellite data would need to be combined with historical climate data of the water temperature near the gyres’ borders.
The beginnings of a fundamental change in the ocean?
But one thing is already certain: these shifts in the major current systems will have far-reaching consequences for human beings and the environment alike. “For example, as the western boundary currents continue to shift, the courses of winter storms and of the jet stream are following suit. At the edges of the eastern boundary currents, we’re now seeing the rich ecosystems begin to shrink, because the shifting currents are changing the living conditions too quickly for marine organisms to adapt,” Yang explains. Dramatic temperature changes have been observed e.g. in the Gulf of Maine (due to the shifting Gulf Stream), resulting in a migration of the cod stocks. Researchers have observed similar changes off the Atlantic coasts of Uruguay and Argentina, where the Brazil Current is gradually moving south.
In addition, when boundary currents penetrate higher latitudes, the local sea level rises disproportionately – a problem that especially communities on the northeast coast of North America are now confronted with. And to make matters worse, the displacement of the major subtropical gyres is causing the nutrient-poor regions to expand, reducing the productivity of the ocean as a whole. Accordingly, the shift in the gyres could represent the beginning of a fundamental change in the ocean.
The satellite data used in the study covers the timeframe from 1982 to 2018 for the ocean surface temperature, and from 1992 to 2018 for the sea level height.
Contact
- Gerrit Lohmann, +49(471)4831-1758, Gerrit.Lohmann@awi.de
- Hu Yang, +49(471)4831-1897, hu.yang@awi.de
- Ulrike Windhövel, +49(471)4831-2008, ulrike.windhoevel@awi.de
Major wind-driven ocean currents are shifting toward the poles
Poleward Shift of the Major Ocean Gyres Detected in a Warming Climate
ABSTRACT: Recent evidence shows that wind‐driven ocean currents, like the western boundary currents, are strongly affected by global warming. However, due to insufficient observations both on temporal and spatial scales, the impact of climate change on large‐scale ocean gyres is still not clear. Here, based on satellite observations of sea surface height and sea surface temperature, we find a consistent poleward shift of the major ocean gyres. Due to strong natural variability, most of the observed ocean gyre shifts are not statistically significant, implying that natural variations may contribute to the observed trends. However, climate model simulations forced with increasing greenhouse gases suggest that the observed shift is most likely to be a response of global warming. The displacement of ocean gyres, which is coupled with the poleward shift of extratropical atmospheric circulation, has broad impacts on ocean heat transport, regional sea level rise, and coastal ocean circulation.
SIGNIFICANCE: Ocean circulation plays a vital role in regulating the weather and climate and supporting marine life. Therefore, it is important to understand whether and how it responds to global warming. However, the available observations are currently sparse and short in duration, making it difficult to track the dynamic changes of large‐scale ocean circulation. Here, we show for the first time, independent satellite observational evidence demonstrating that the large‐scale ocean gyres are moving poleward during the past four decades. Further analysis based on climate models and various other data sets reveal that the poleward shifting of the ocean gyre circulation is most likely to be a consequence of global warming, which so far has not been well recognized by the public and the scientific community.
Poleward Shift of the Major Ocean Gyres Detected in a Warming Climate