Exploration of ocean currents beneath the “Doomsday Glacier” by an autonomous underwater vehicle – Net melting of 75 cubic km of ice per year means “the glacier is not stable over time”
9 April 2021 (University of Gothenburg) – For the first time, researchers have been able to obtain data from underneath Thwaites Glacier, also known as the “Doomsday Glacier”. They find that the supply of warm water to the glacier is larger than previously thought, triggering concerns of faster melting and accelerating ice flow.
With the help of the uncrewed submarine Ran that made its way under Thwaites glacier front, the researchers have made a number of new discoveries. Professor Karen Heywood of the University of East Anglia commented:
“This was Ran’s first venture to polar regions and her exploration of the waters under the ice shelf was much more successful than we had dared to hope. We plan to build on these exciting findings with further missions under the ice next year.”
The submersible has, among other things, measured the strength, temperature, salinity and oxygen content of the ocean currents that go under the glacier.
Global sea level is affected by how much ice there is on land, and the biggest uncertainty in the forecasts is the future evolution of the West Antarctic Ice Sheet, says Anna Wåhlin, professor of oceanography at the University of Gothenburg and lead author of the new study now published in Science Advances.
Impacts global sea level
The ice sheet in West Antarctica accounts for about ten percent of the current rate of sea level rise; but also the ice in West Antarctica holds the most potential for increasing that rate because the fastest changes worldwide are taking place in the Thwaites Glacier. Due to its location and shape, Thwaites is particularly sensitive to warm and salty ocean currents that are finding their way underneath it.
This process can lead to an accelerated melting taking place at the bottom of the glacier and inland movement of the so-called grounding zone, the area where the ice transitions from resting on the seabed to floating in the ocean.
Due to its inaccessible location, far from research stations, in an area that is usually blocked by thick sea ice and many icebergs, there has been a great shortage of in situ measurements from this area. This means that there are big knowledge gaps for the ice-ocean boundary processes in this region.

First measurements performed
In the study, the researchers present the results from the submersible that measured strength, temperature, salinity and oxygen content of the ocean currents that go under the glacier.
“These were the first measurements ever performed beneath Thwaites glacier”, says Anna Wåhlin.
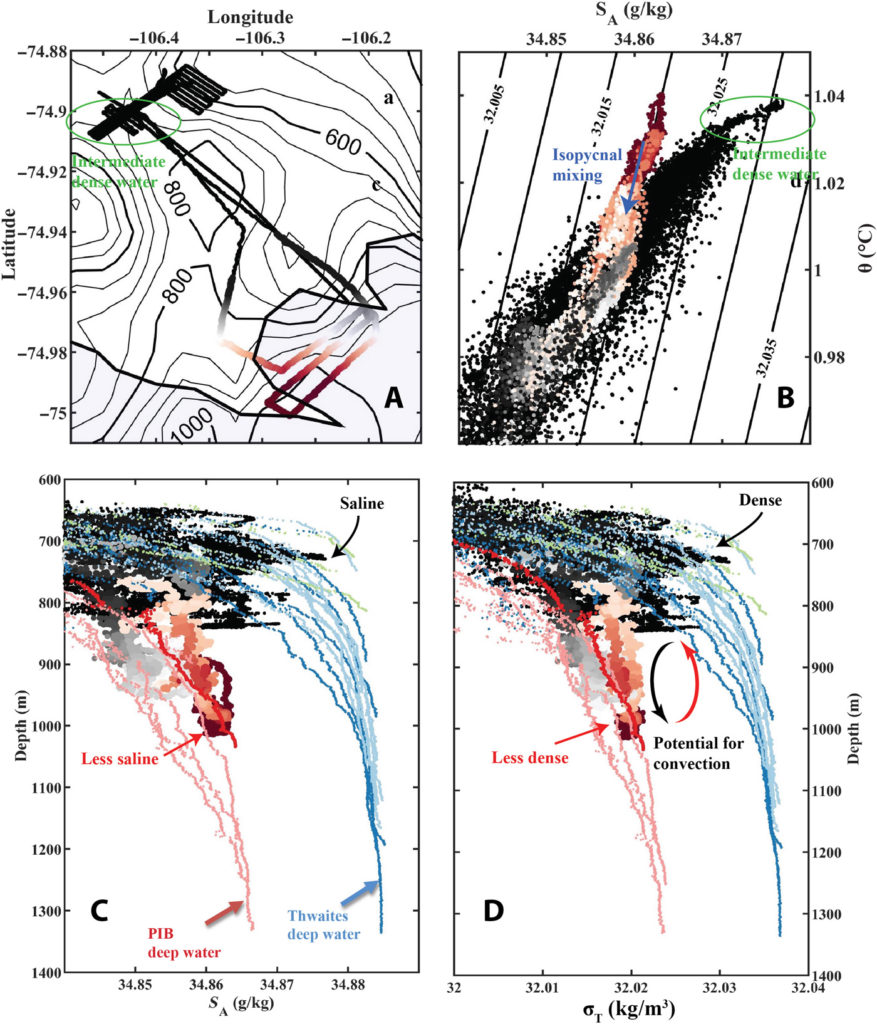
The results have been used to map the ocean currents underneath the floating part of the glacier. The researchers discovered that there is a deep connection to the east through which deep water flows from Pine Island Bay, a connection that was previously thought to be blocked by an underwater ridge.
The research group has also measured the heat transport in one of the three channels that lead warm water towards Thwaites Glacier from the north. ”The channels for warm water to access and attack Thwaites weren’t known to us before the research. Using sonars on the ship, nested with very high-resolution ocean mapping from Ran, we were able to find that there are distinct paths that water takes in and out of the ice shelf cavity, influenced by the geometry of the ocean floor” says Dr Alastair Graham, University of Southern Florida.
The value measured there, 0.8 TW, corresponds to a net melting of 75 km3 of ice per year, which is almost as large as the total basal melt in the entire ice shelf. Although the amount of ice that melts as a result of the hot water is not much compared to other global freshwater sources, the heat transport has a large effect locally and may indicate that the glacier is not stable over time.
Not sustainable over time
The researchers also noted that large amounts of meltwater flowed north away from the front of the glacier.
Variations in salinity, temperature and oxygen content indicate that the area under the glacier is a previously unknown active area where different water masses meet and mix with each other, which is important for understanding the melting processes at the base of the ice.
The observations show warm water approaching from all sides on pinning points, critical locations where the ice is connected to the seabed and give stability to the ice shelf. Melting around these pinning points may lead to instability and retreat of the ice shelf and, subsequently, the upstream glacier flowing off the land. Dr Rob Larter of the British Antarctic Survey commented:
“This work highlights that how and where warm water impacts Thwaites Glacier is influenced by the shape of the sea floor and the ice-shelf base as well as the properties of the water itself. The successful integration of new sea-floor survey data and observations of water properties from the Ran missions shows the benefits of the multidisciplinary ethos within the International Thwaites Glacier Collaboration.”
“The good news is that we are now, for the first time, collecting data that is necessary to model the dynamics of Thwaite’s glacier. This data will help us better calculate ice melting in the future. With the help of new technology, we can improve the models and reduce the great uncertainty that now prevails around global sea-level variations.” says Anna Wåhlin.
Contact
- Professor Anna Wåhlin, +46 766-18 28 66, +46 31-786 28 66, anna.wahlin@marine.gu.se
- Communications Officer Carina Eliasson, +46 766-22 98 73, +46 31-786 98 73, carina.eliasson@science.gu.se
Exploration of ocean currents beneath the ‘Doomsday Glacier’ by an autonomous underwater vehicle

Pathways and modification of warm water flowing beneath Thwaites Ice Shelf, West Antarctica
ABSTRACT: Thwaites Glacier is the most rapidly changing outlet of the West Antarctic Ice Sheet and adds large uncertainty to 21st-century sea-level rise predictions. Here, we present the first direct observations of ocean temperature, salinity, and oxygen beneath Thwaites Ice Shelf front, collected by an autonomous underwater vehicle. On the basis of these data, pathways, and modification of water flowing into the cavity are identified. Deepwater underneath the central ice shelf derives from a previously underestimated eastern branch of warm water entering the cavity from Pine Island Bay. Inflow of warm and outflow of melt-enriched waters are identified in two seafloor troughs to the north. Spatial property gradients highlight a previously unknown convergence zone in one trough, where different water masses meet and mix. Our observations show warm water impinging from all sides on pinning points critical to ice-shelf stability, a scenario that may lead to unpinning and retreat.
Pathways and modification of warm water flowing beneath Thwaites Ice Shelf, West Antarctica

One Response
Comments are closed.