Sunny-day flooding is about to become more than a nuisance – “What’s scary about this paper is the idea of the inflection point. Can we adapt fast enough to keep pace?”
By Jim Morrison
2 August 2021
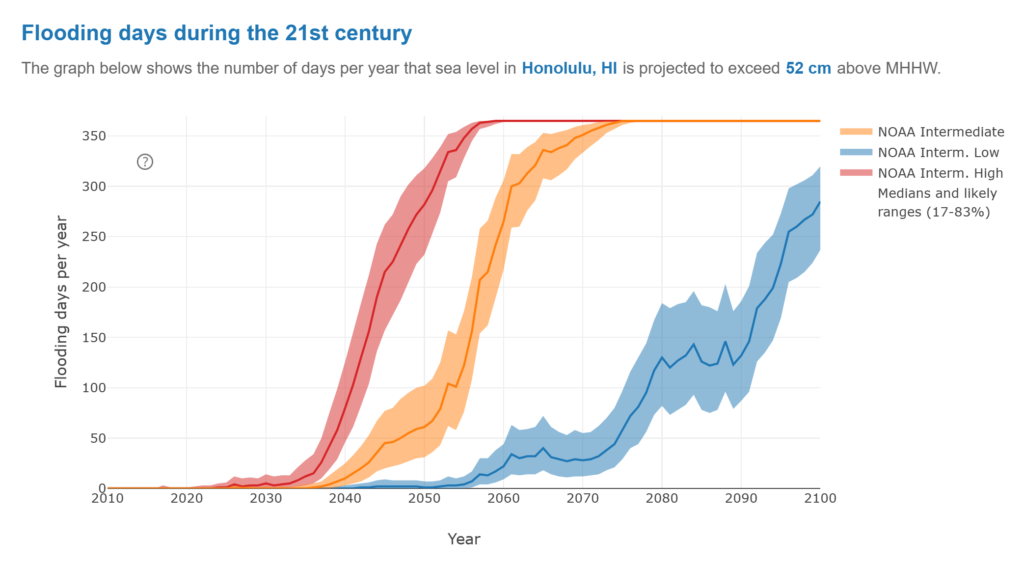
(WIRED) – During the summer of 2017, the tide rose to historic heights again and again in Honolulu, higher than at any time in the 112 years that records had been kept. Philip Thompson, director of the Sea Level Center at the University of Hawaii, wanted to know why. “Where did this come from?” he asked. “How often is this going to happen? Is this our window into the future?”
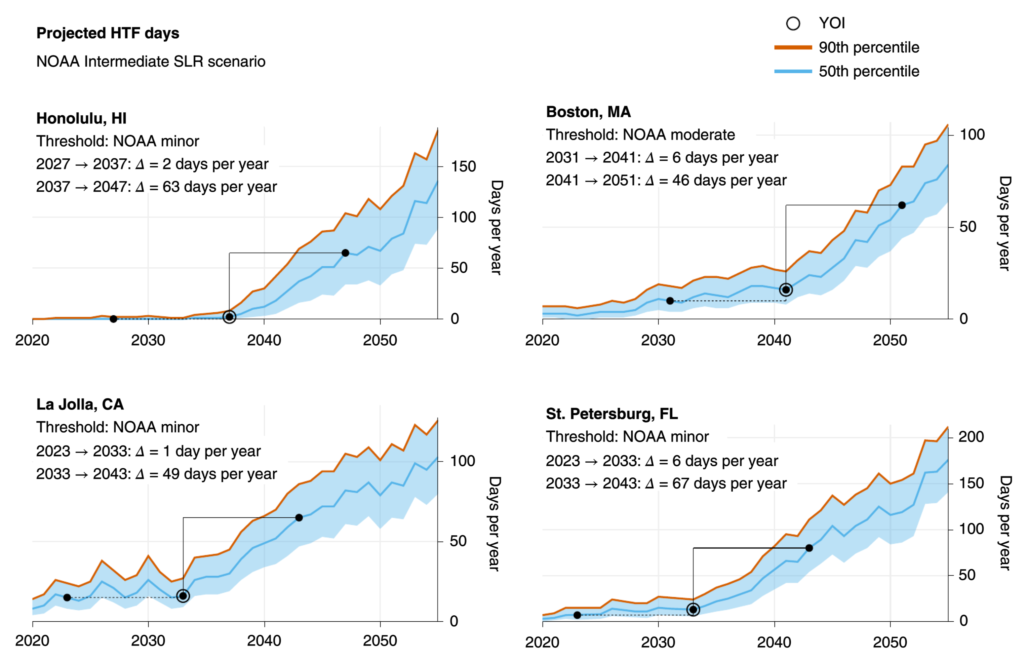
What Thompson and a group of researchers discovered is that the future has arrived. The summer of ’17 was a glimpse of the watery reality coming to Honolulu and other coastal communities. The study, published this June in Nature Climate Change, found that higher and more frequent tides will reach an inflection point in the 2030s, particularly along the West Coast and at islands like those in Hawaii, making what’s been labeled as “nuisance flooding” common.
“Many areas along the East Coast are already experiencing recurrent impacts,” Thompson says. “In the mid-2030s, these other areas are going to catch up rapidly. So then it’s a transition from being a regional East Coast issue to a national issue, where a majority of the nation’s coastlines are being affected by high-tide flooding on a regular basis.”
How regular? The study, which included researchers from NASA and the National Oceanic and Atmospheric Administration, shows that sunny-day floods will cluster in the fall, creating a nightmare for cities and businesses. Streets will be impassable, cars will be damaged in parking lots, and stormwater systems will be strained. In addition, tidal flooding also fouls local waterways with pollutants including oil, gasoline, trace metals, and nitrogen, spawning algae blooms that create oxygen-depleted dead zones.
Thompson notes that high-tide flooding is subtle, damaging a community with a thousand cuts―or, in this case, dozens of days a year when arriving at work or shopping for groceries becomes a hassle or even impossible. “If it’s happening 10 or 15 times in a month, it becomes an issue,” he adds. “A business can’t keep operating with its parking lot under water. People lose their jobs because they can’t get to work. Those impacts can really accumulate quickly.” …
Mikhail Chester, an associate professor at Arizona State’s School of Sustainable Engineering and the Built Environment and a leader of the Urban Resilience to Extremes Sustainability Research Network, says the study highlights the difficulty of designing long-term infrastructure like roads, storm sewers, and bridges for a rapidly-changing environment. In the past, infrastructure was designed on the assumption that the weather and climate are fairly stable. That’s no longer the case.
“You’ve got to make infrastructure agile and flexible,” he says. “You need different mental models, different ways of approaching infrastructure, because the Industrial Era–mindset that we remain rooted in is just wholly insufficient for the unpredictability and instability of the future.”
The study points to an even more unstable future with dramatically changing coastal tides. That worries Chester. “What’s scary about this paper is the idea of the inflection point,” he says, noting that it takes a long time to rebuild or replace infrastructure. “The question I have is, can we adapt fast enough to keep pace?” [more]
Sunny-Day Flooding Is About to Become More Than a Nuisance
Rapid increases and extreme months in projections of United States high-tide flooding
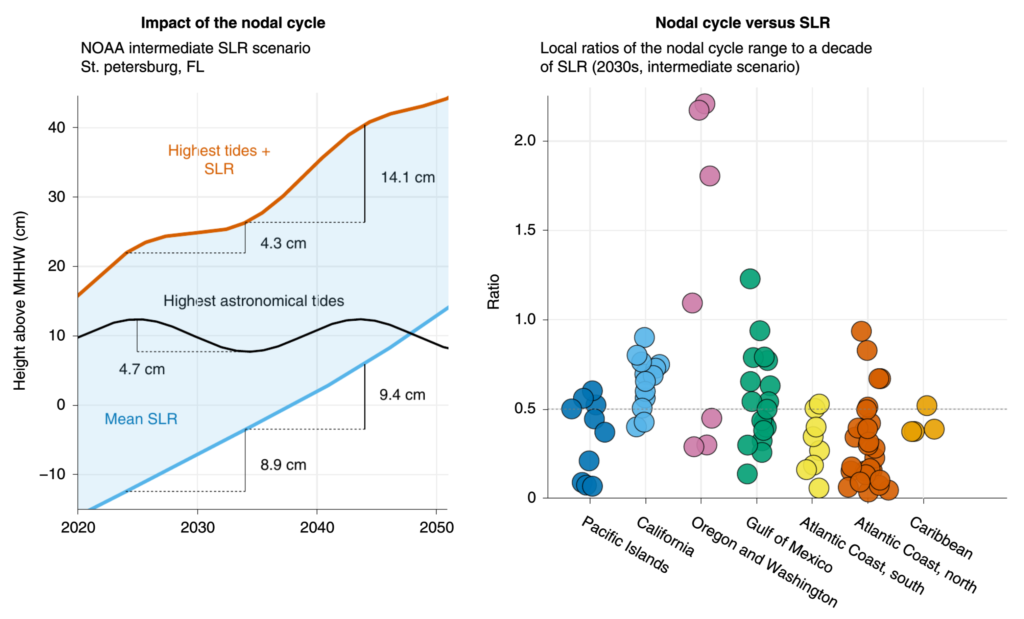
ABSTRACT: Coastal locations around the United States, particularly along the Atlantic coast, are experiencing recurrent flooding at high tide. Continued sea-level rise (SLR) will exacerbate the issue where present, and many more locations will begin to experience recurrent high-tide flooding (HTF) in the coming decades. Here we use established SLR scenarios and flooding thresholds to demonstrate how the combined effects of SLR and nodal cycle modulations of tidal amplitude lead to acute inflections in projections of future HTF. The mid-2030s, in particular, may see the onset of rapid increases in the frequency of HTF in multiple US coastal regions. We also show how annual cycles and sea-level anomalies lead to extreme seasons or months during which many days of HTF cluster together. Clustering can lead to critical frequencies of HTF occurring during monthly or seasonal periods one to two decades prior to being expected on an annual basis.
Rapid increases and extreme months in projections of United States high-tide flooding