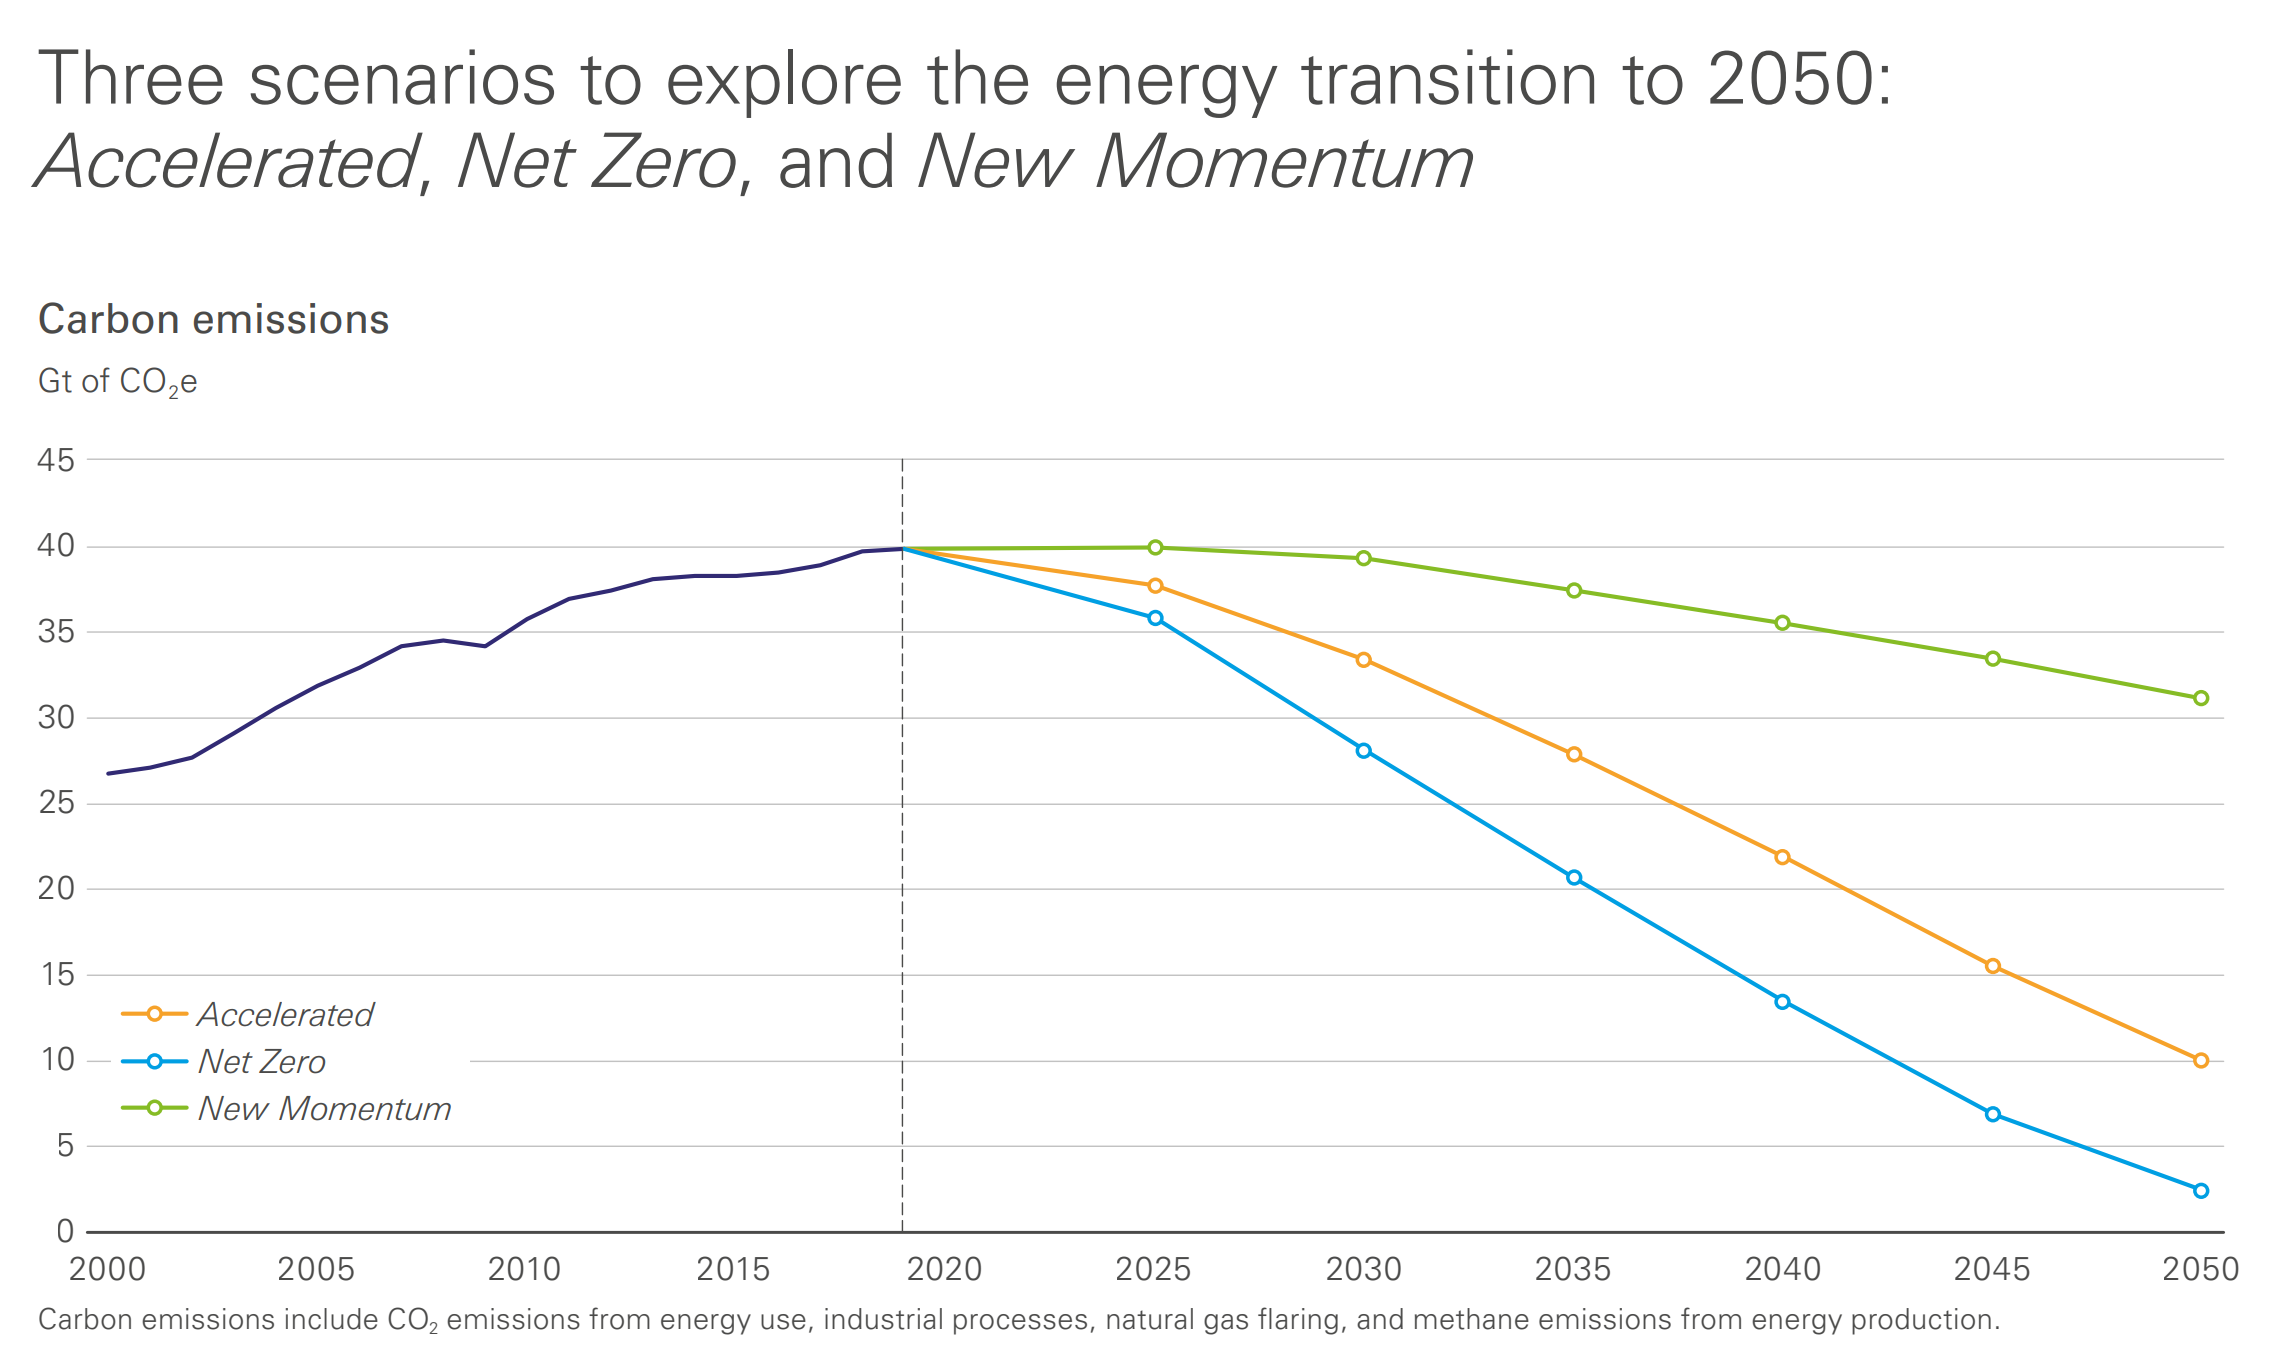
By Spencer Dale 14 March 2022 (BP) – At the time of writing, the world’s attention is focussed on the terrible events taking place in Ukraine. Our thoughts and hopes are with all those affected. The scenarios included in Energy Outlook 2022 were largely prepared before the outbreak of the military action and do not include any […]
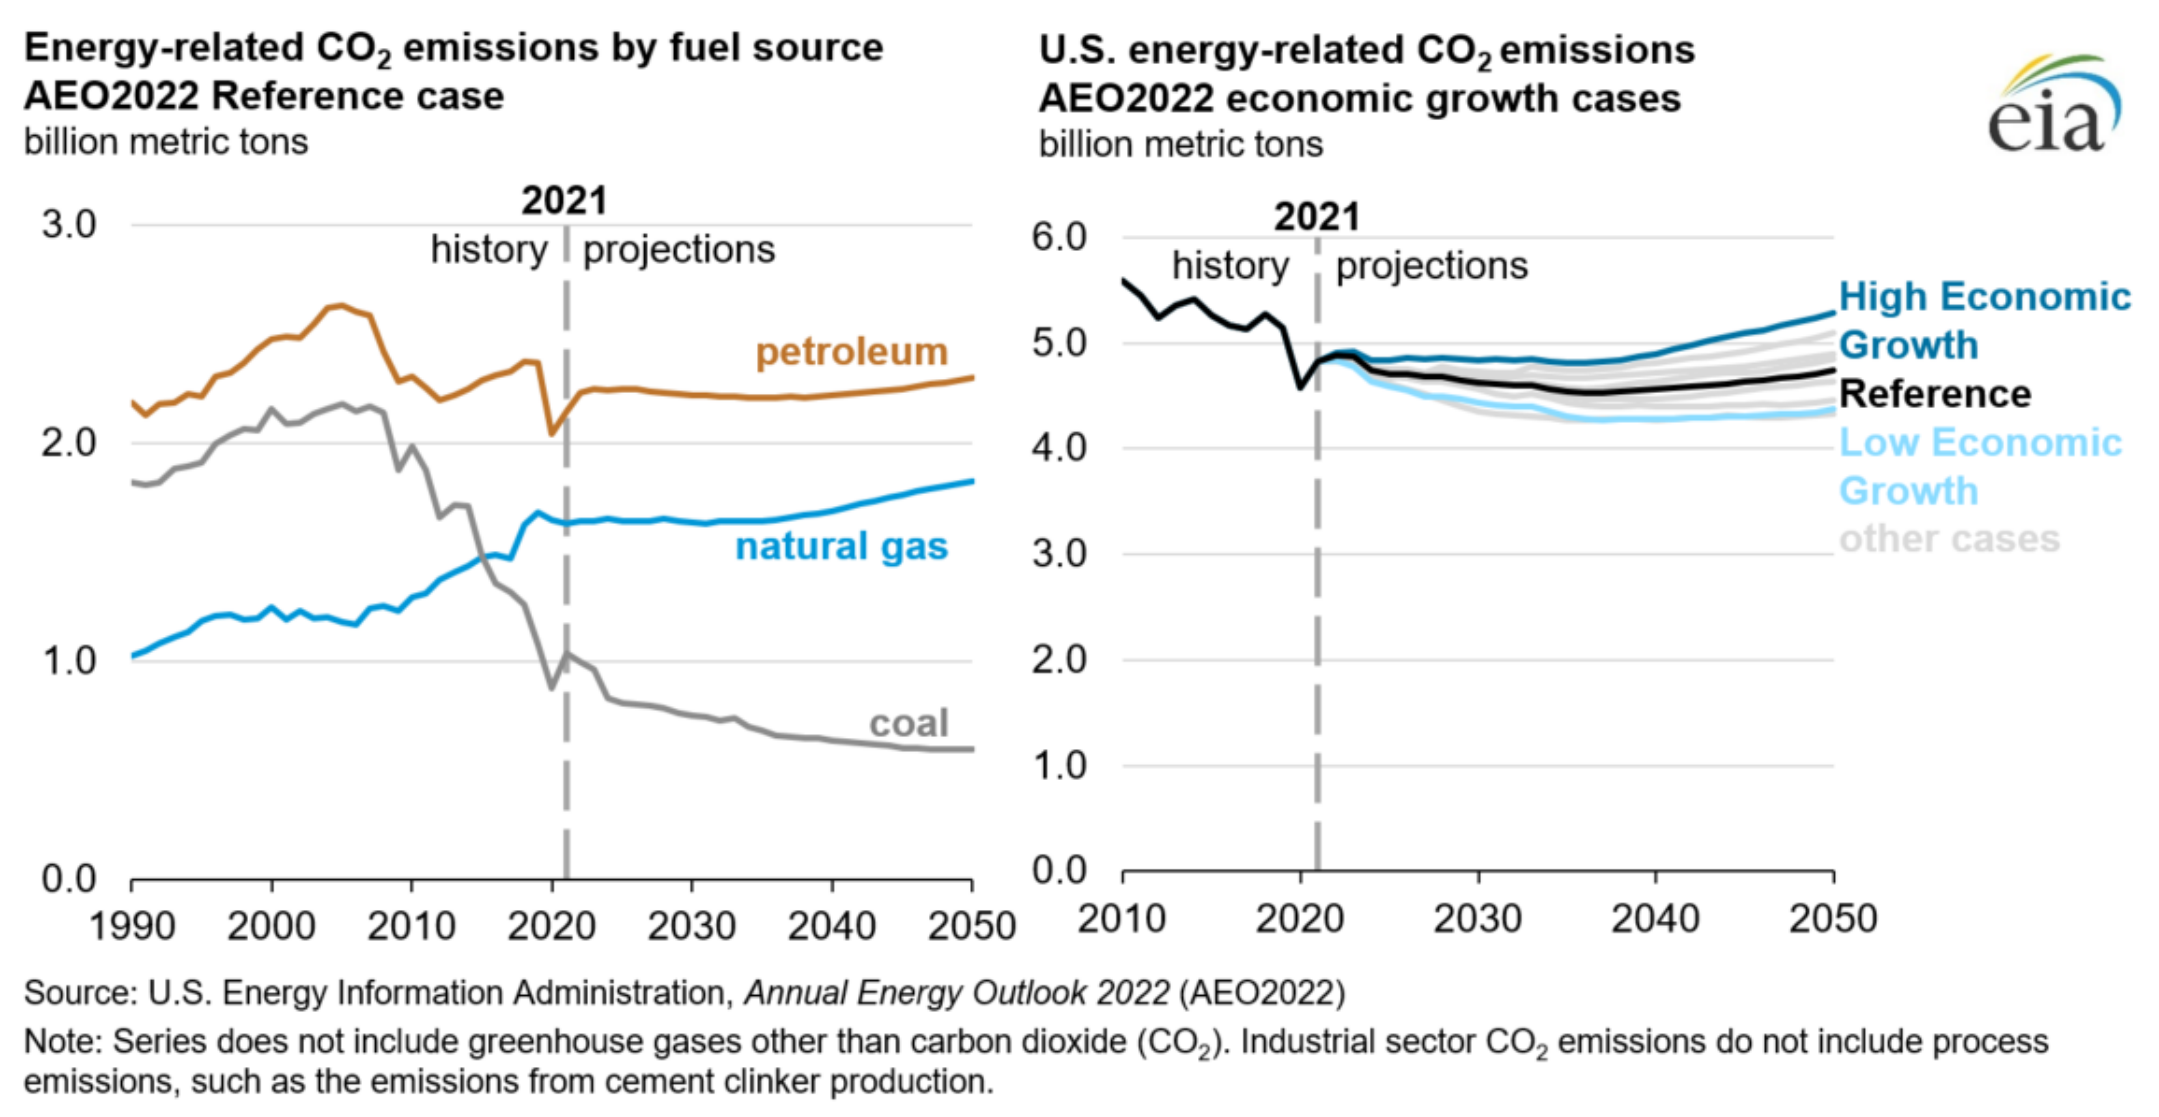
3 March 2022 (EIA) – Key takeaways from the Reference case and side cases: Petroleum and natural gas remain the most-consumed sources of energy in the United States through 2050, but renewable energy is the fastest growing Motor gasoline remains the most prevalent transportation fuel despite electric vehicles gaining market share Energy-related carbon dioxide (CO2) […]
By Stefanie Eschenbacher 23 February 2022 (Reuters) – It never gets completely dark in Colonia El Carmen, home to Mexico’s largest natural gas processing center, in the poor southern state of Chiapas. After sunset, a red glare emanates from flares dotted around the Cactus gas processing center, run by state oil company Petroleos Mexicanos (Pemex). […]
By Elles Houweling 20 December 2021 (Verdict) – The founder and director of Foxconn, the world’s largest contract manufacturer of electronics, Terry Gou, has said that “there will be a shortage of electricity in the next year.” Gou added that “people should not complain about the future lack of electricity.” Instead, they should “prepare”. Hon Hai Precision […]
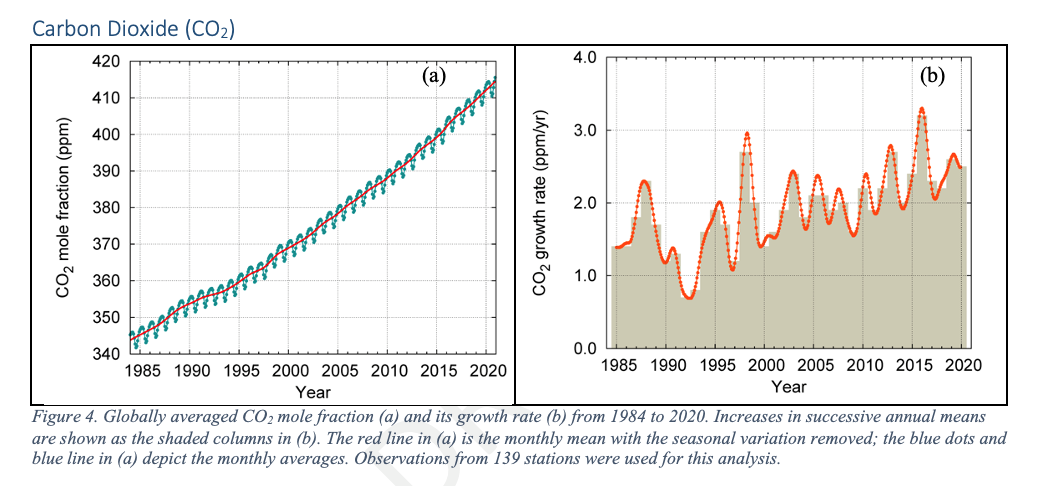
GENEVA, 25 October 2021 (WMO) – The abundance of heat-trapping greenhouse gases in the atmosphere once again reached a new record last year, with the annual rate of increase above the 2011-2020 average. That trend has continued in 2021, according to the World Meteorological Organization (WMO) Greenhouse Gas Bulletin. Concentration of carbon dioxide (CO2), the most […]
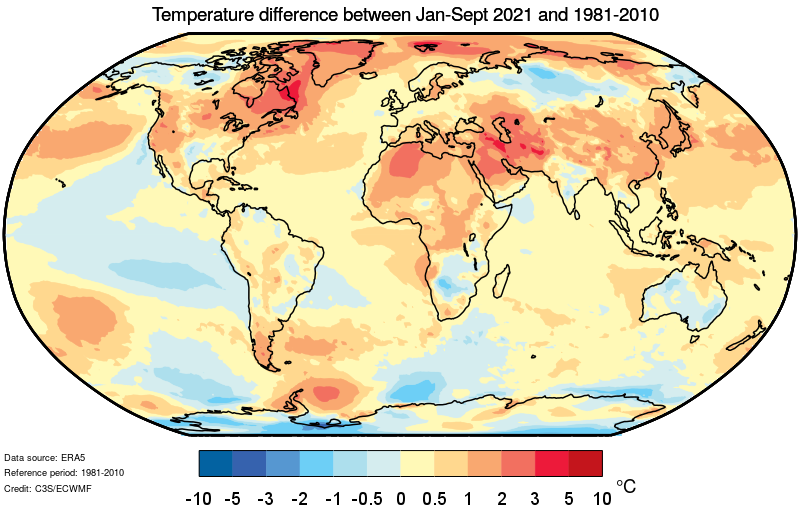
GENEVA, 31 October 2021 (WMO) – Record atmospheric greenhouse gas concentrations and associated accumulated heat have propelled the planet into uncharted territory, with far-reaching repercussions for current and future generations, according to the World Meteorological Organization (WMO). The past seven years are on track to be the seven warmest on record, according to the provisional WMO […]
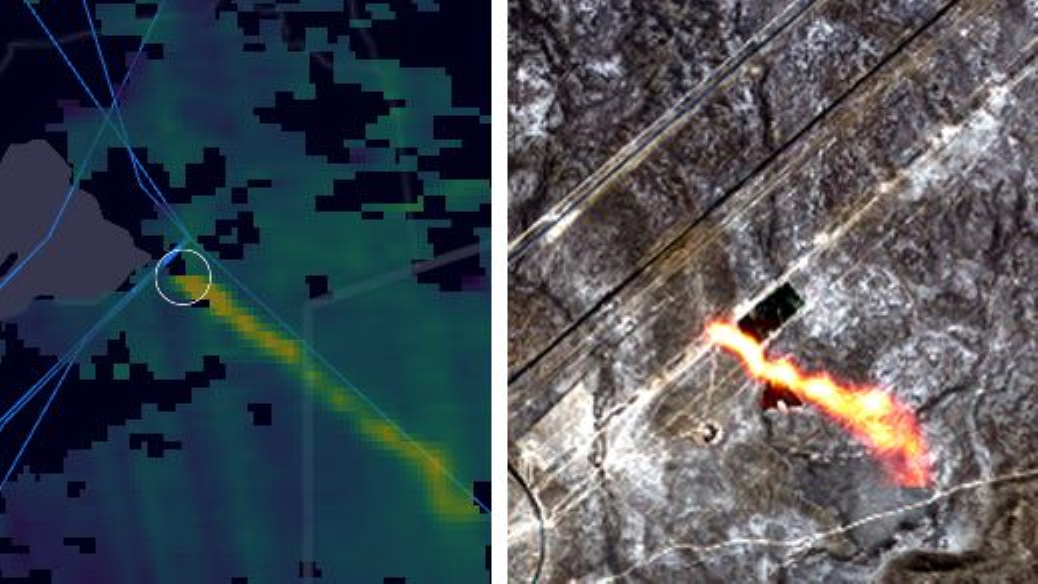
By Tereza Pultarova 16 November 2021 (Space.com) – Huge amounts of uncounted emissions of highly warming greenhouse gas methane are being released by “super-emitters” all over the world, satellite observations reveal. Scientists have only recently worked out how to detect methane emissions from space, but what they have seen since has taken them by surprise. […]
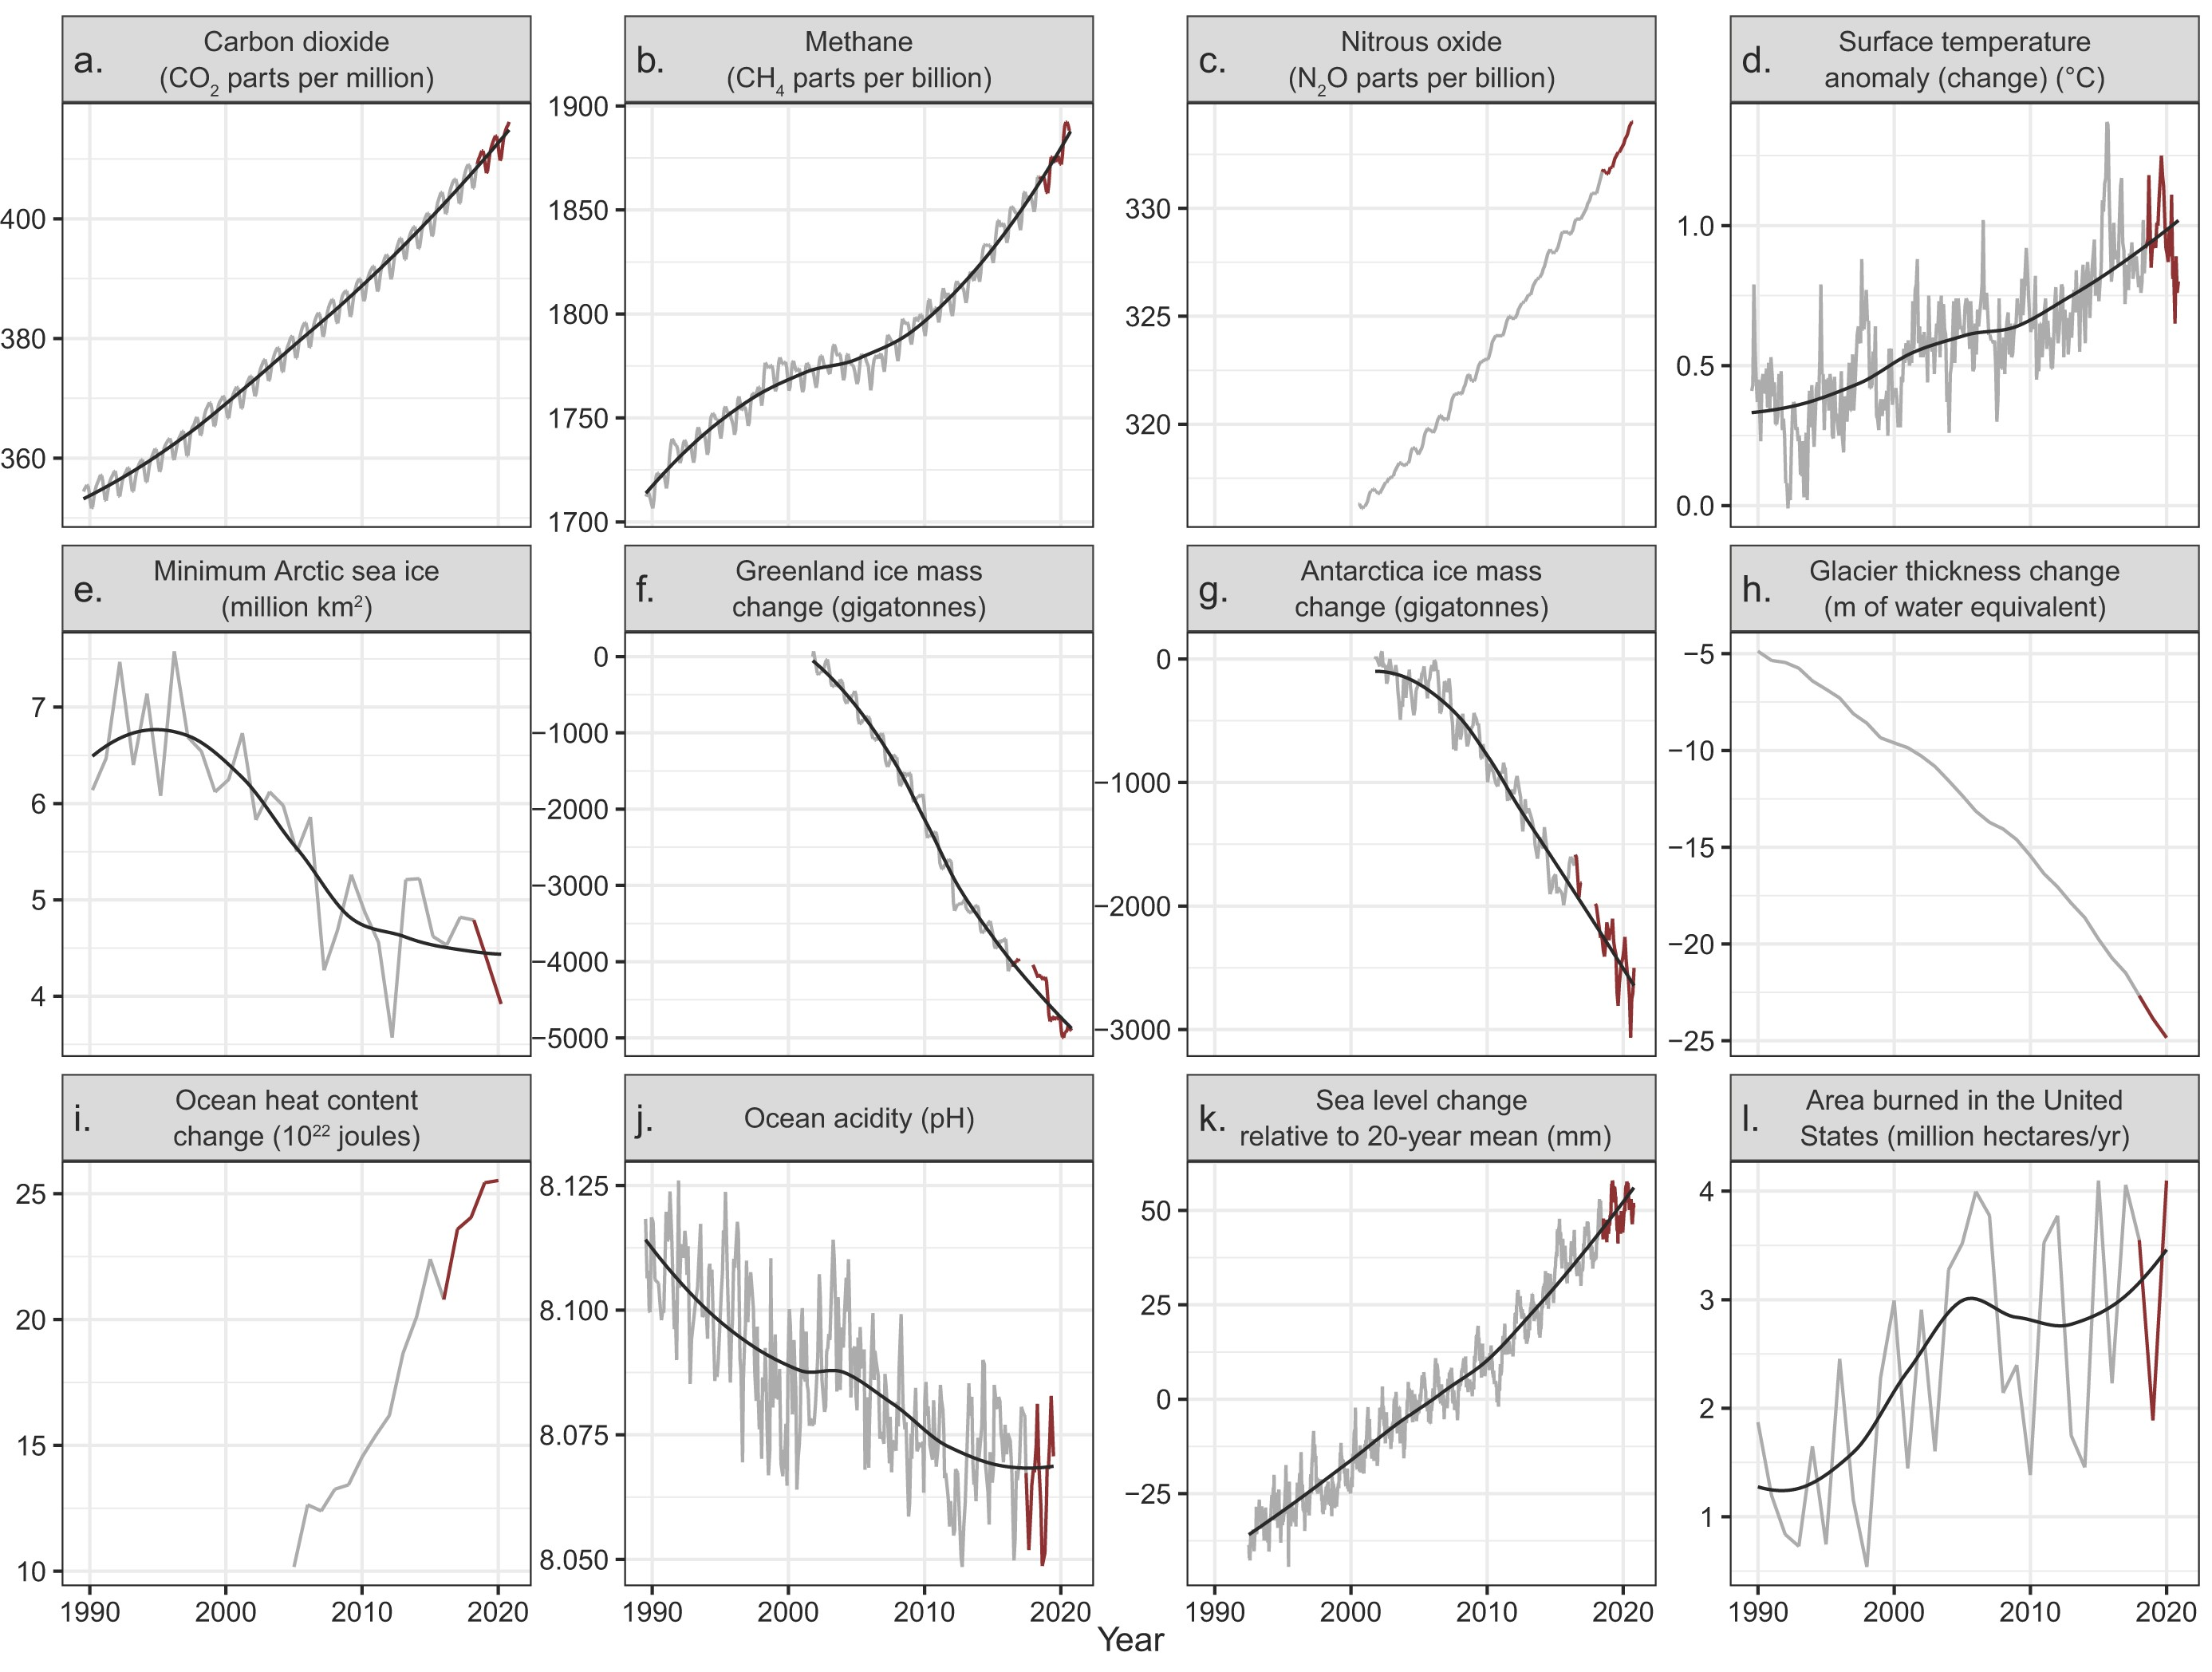
28 July 2021 (BioScience) – In 2019, Ripple and colleagues (2020) warned of untold suffering and declared a climate emergency together with more than 11,000 scientist signatories from 153 countries. They presented graphs of planetary vital signs indicating very troubling trends, along with little progress by humanity to address climate change. On the basis of […]
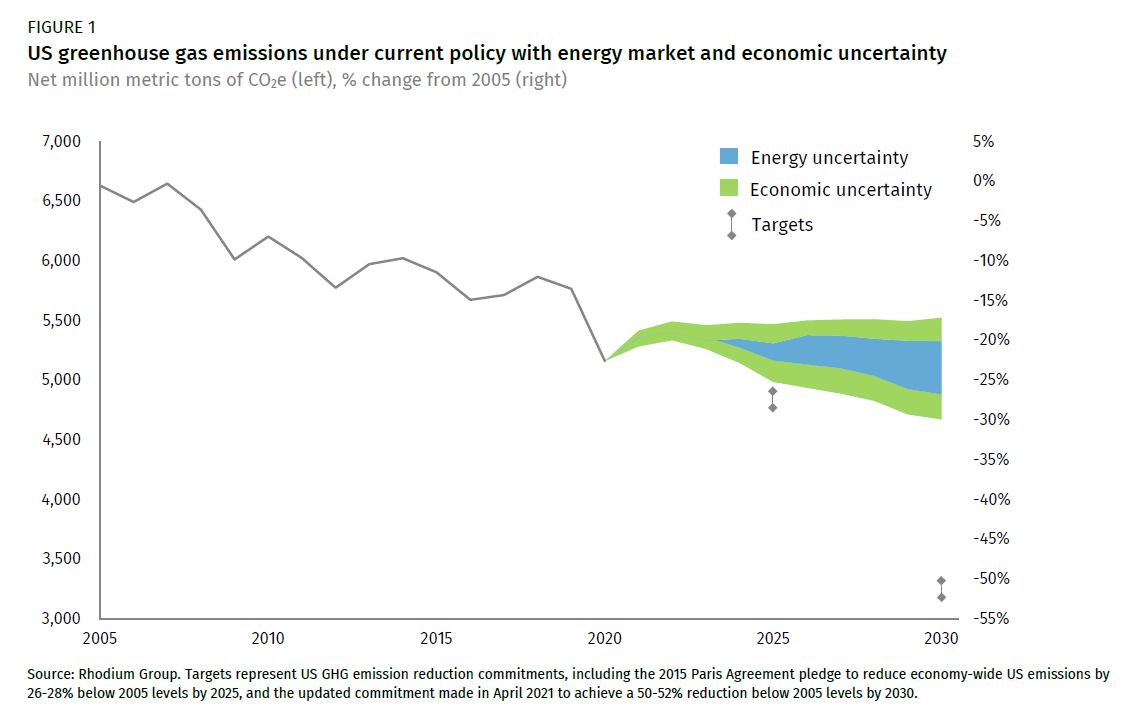
By Hannah Pitt, Kate Larsen, Hannah Kolus, Ben King, Alfredo Rivera, Emily Wimberger, Whitney Herndon, John Larsen, and Galen Hiltbrand 15 July 2021 (Rhodium Group) – For the past seven years, Rhodium Group has provided an independent annual outlook for US greenhouse gas (GHG) emissions under current federal and state policy. This current policy baseline […]
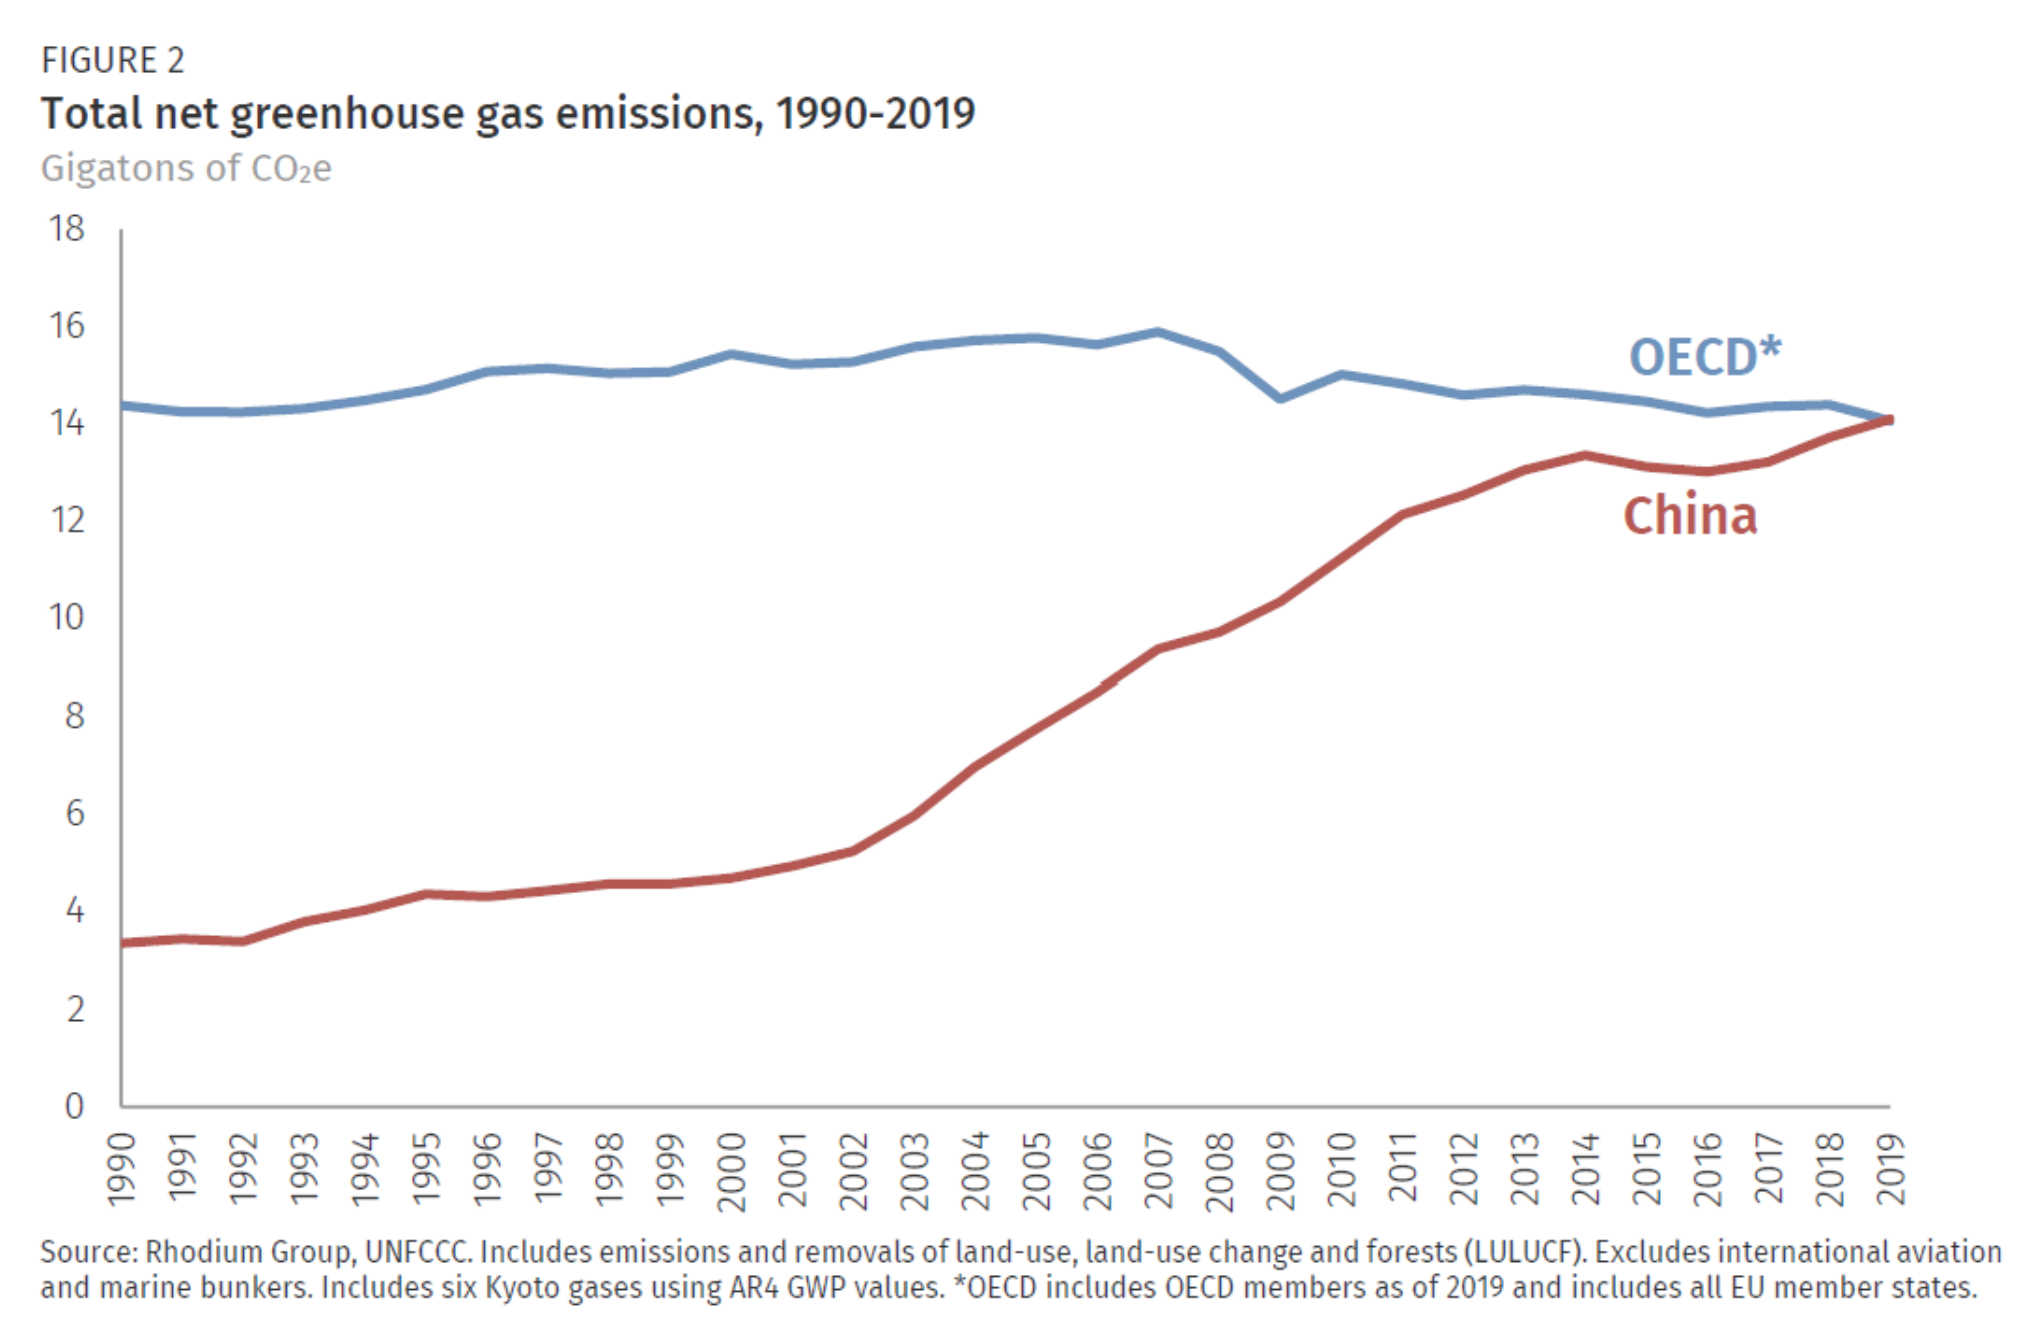
By Kate Larsen, Hannah Pitt, Mikhail Grant, and Trevor Houser 6 May 2021 (Rhodium Group) – Each year Rhodium Group provides the most up-to-date global and country-level greenhouse gas (GHG) emissions estimates through the ClimateDeck (a partnership with Breakthrough Energy). In addition to our preliminary US and China GHG estimates for 2020, Rhodium provides annual estimates of economy-wide emissions—including all […]