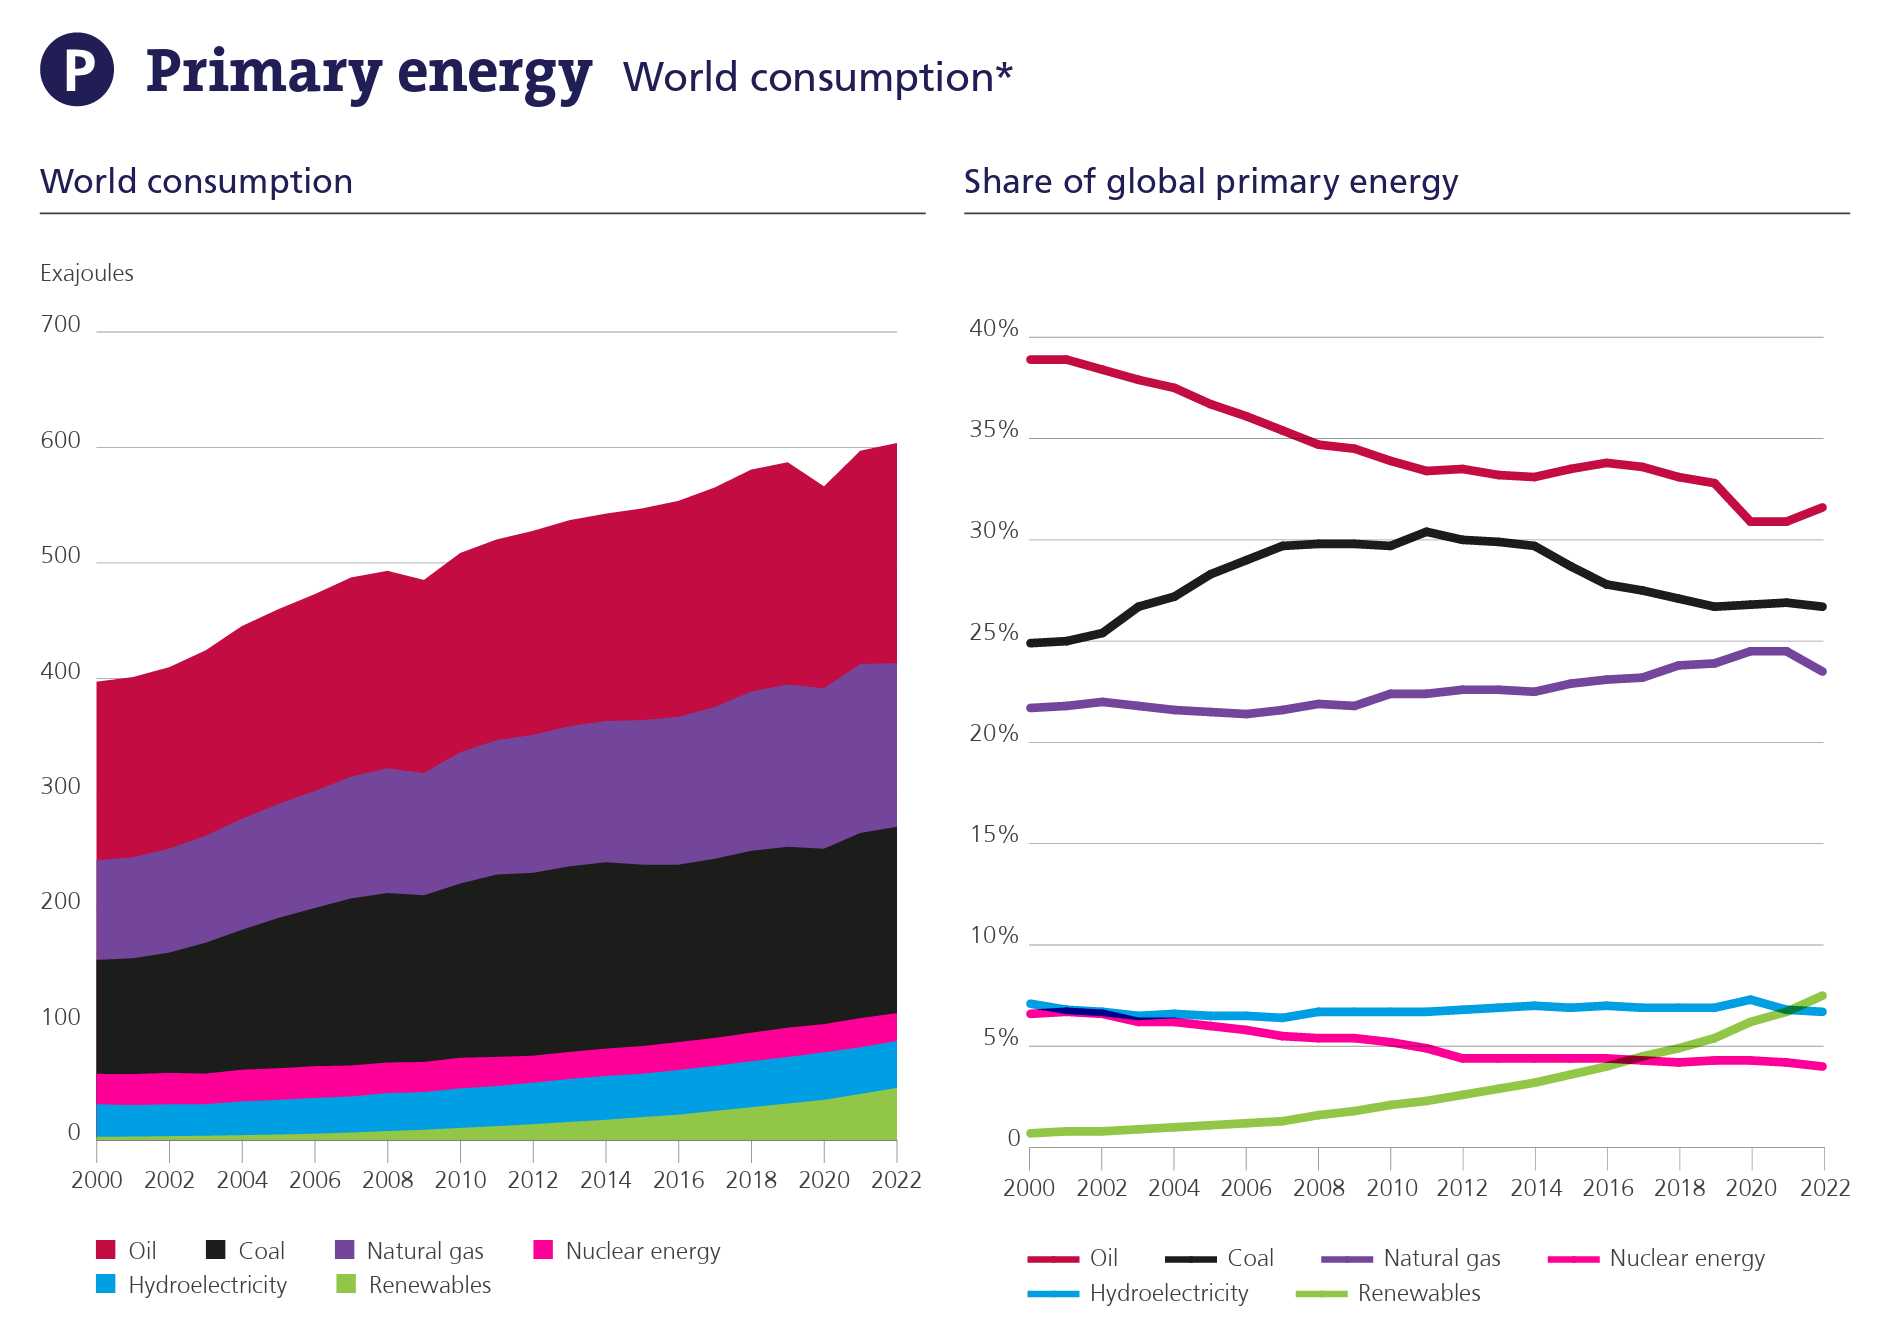
26 June 2023 (EI) – The Energy Institute (EI) and partners KPMG and Kearney today released the 72nd annual edition of the Statistical Review of World Energy, presenting for the first time full global energy data for 2022. Five key themes emerge from the data EI President Juliet Davenport OBE HonFEI said: “The EI Statistical Review […]
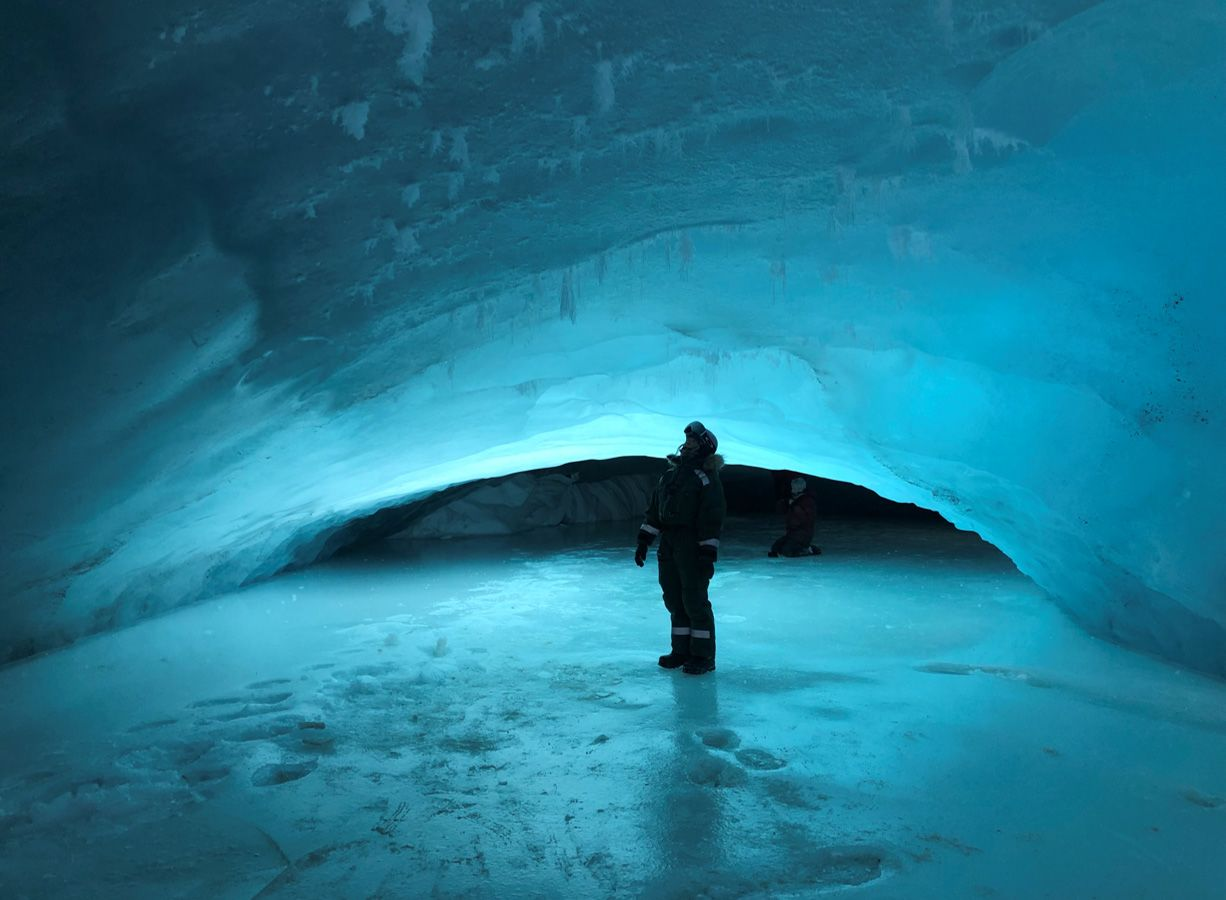
By Catherine Martin-Jones 6 July 2023 (University of Cambridge) – As the Arctic warms, shrinking glaciers are exposing bubbling groundwater springs which could provide an underestimated source of the potent greenhouse gas methane, finds new research published today in Nature Geoscience. The study, led by researchers from the University of Cambridge and the University Centre in Svalbard, […]
By Emily Foxhall, Kai Elwood-dieu, and Zach Despart 25 May 2023 (Texas Tribune) – State Rep. Jared Patterson disagreed with his Republican colleague that Texas should keep supporting the booming renewable energy industry here. Rep. John Smithee was arguing on the House floor in early May that certain solar and wind farms should be eligible […]
30 June 2023 (Reuters) – The Texas power grid comfortably met record demand during this week’s heat wave with abundant power supply from wind and solar plants, data from the grid operator showed. The Texas grid is a focus in the United States whenever it is tested by extreme weather after a catastrophic failure in […]
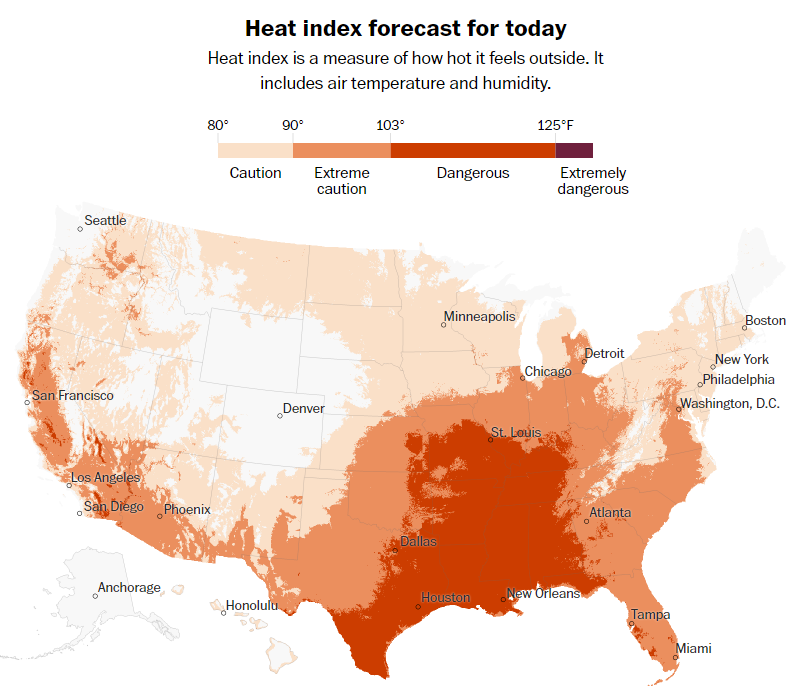
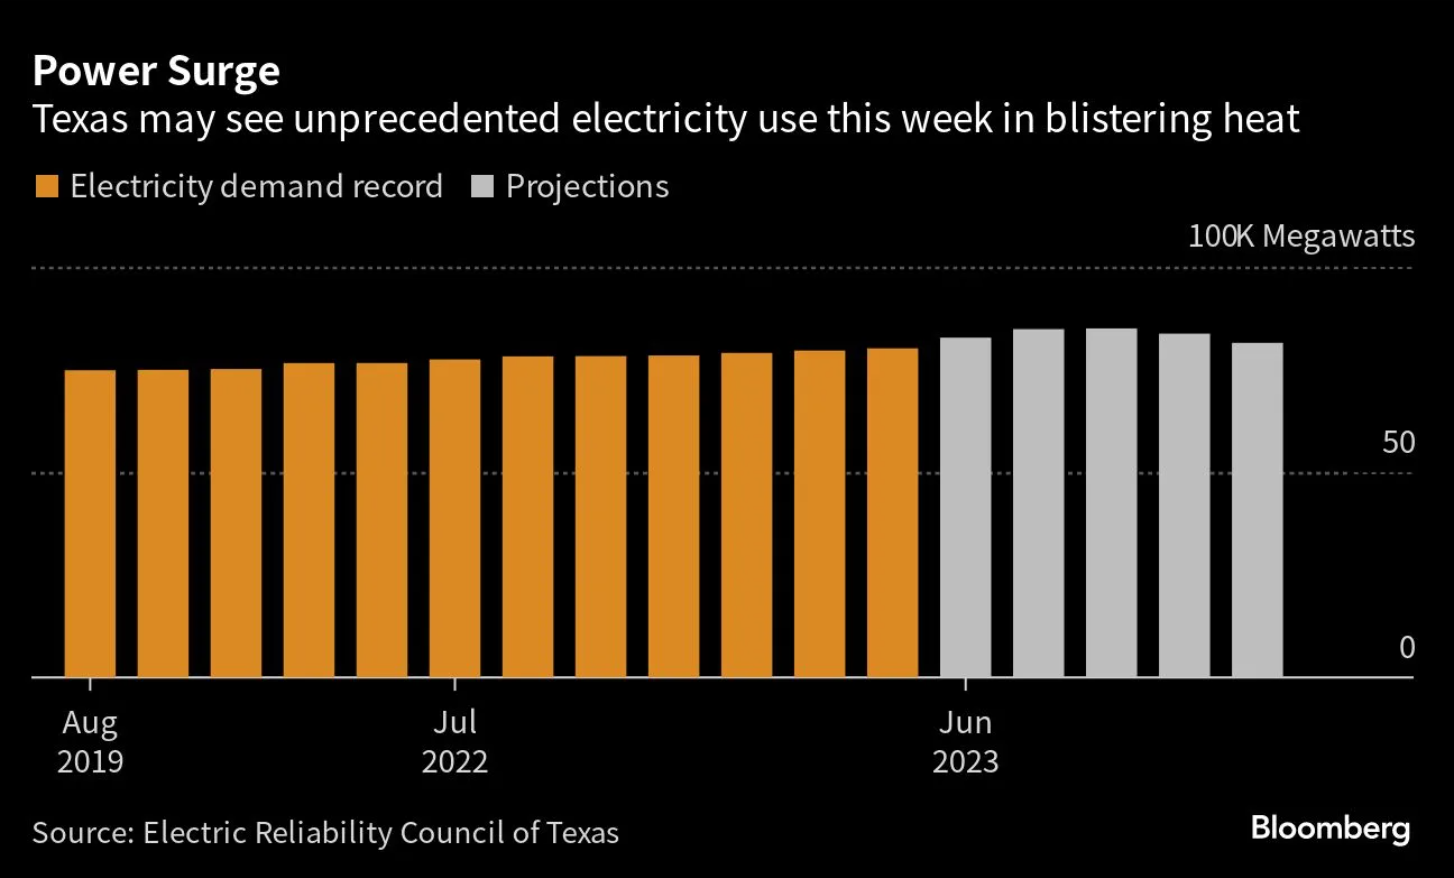
26 June 2023 (Reuters) – Texas’ power grid operator on Monday again projected electricity use would break records this week as homes and business cranked up air conditioning amid soaring temperatures. The Electric Reliability Council of Texas (ERCOT), which operates the grid for more than 26 million customers representing about 90% of the state’s power […]
By Matthew Brown and Amy Beth Hanson 10 June 2023 HELENA, Montana (AP News) – Whether a constitutional right to a healthy, livable climate is protected by state law is at the center of a lawsuit going to trial Monday in Montana, where 16 young plaintiffs and their attorneys hope to set an important legal precedent. It’s the first […]
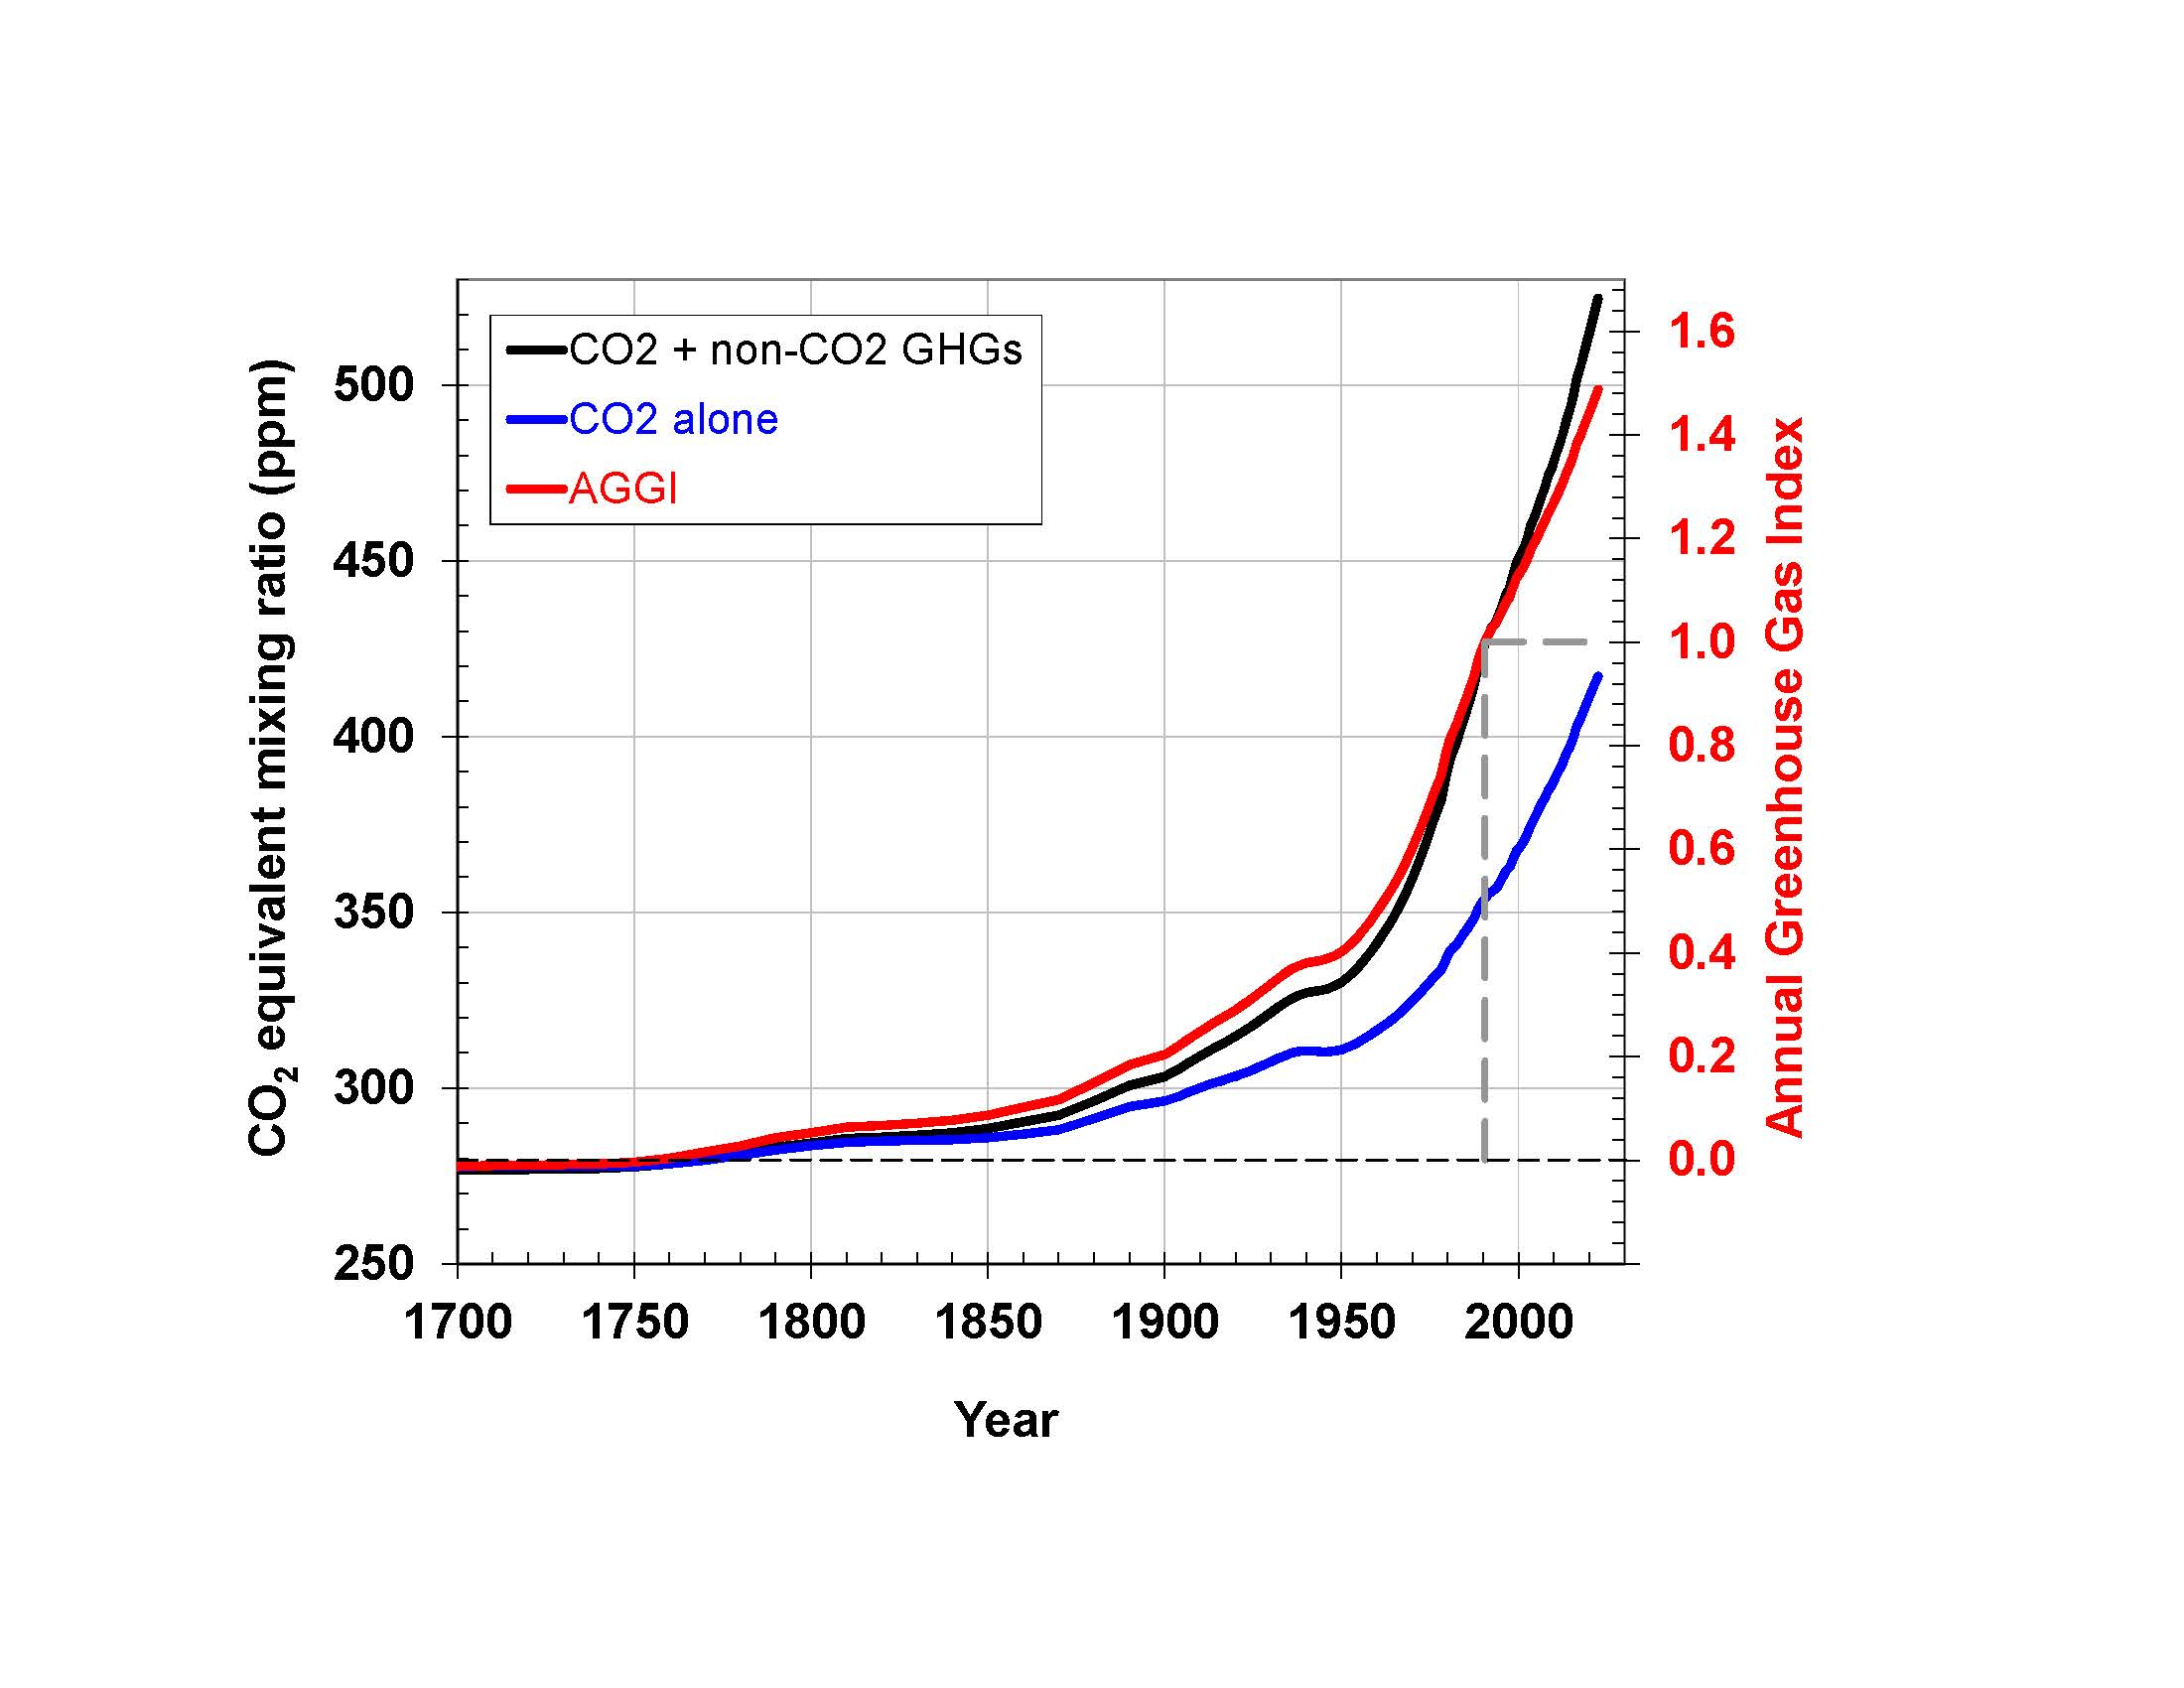
23 May 2023 (NOAA) – Greenhouse gas pollution from human activity trapped 49 percent more heat in the atmosphere during 2022 than those same gases did in 1990, according to an annual NOAA report. NOAA’s Annual Greenhouse Gas Index, known as the AGGI, tracks increases in the warming influence of heat-trapping gases generated by human activity, […]
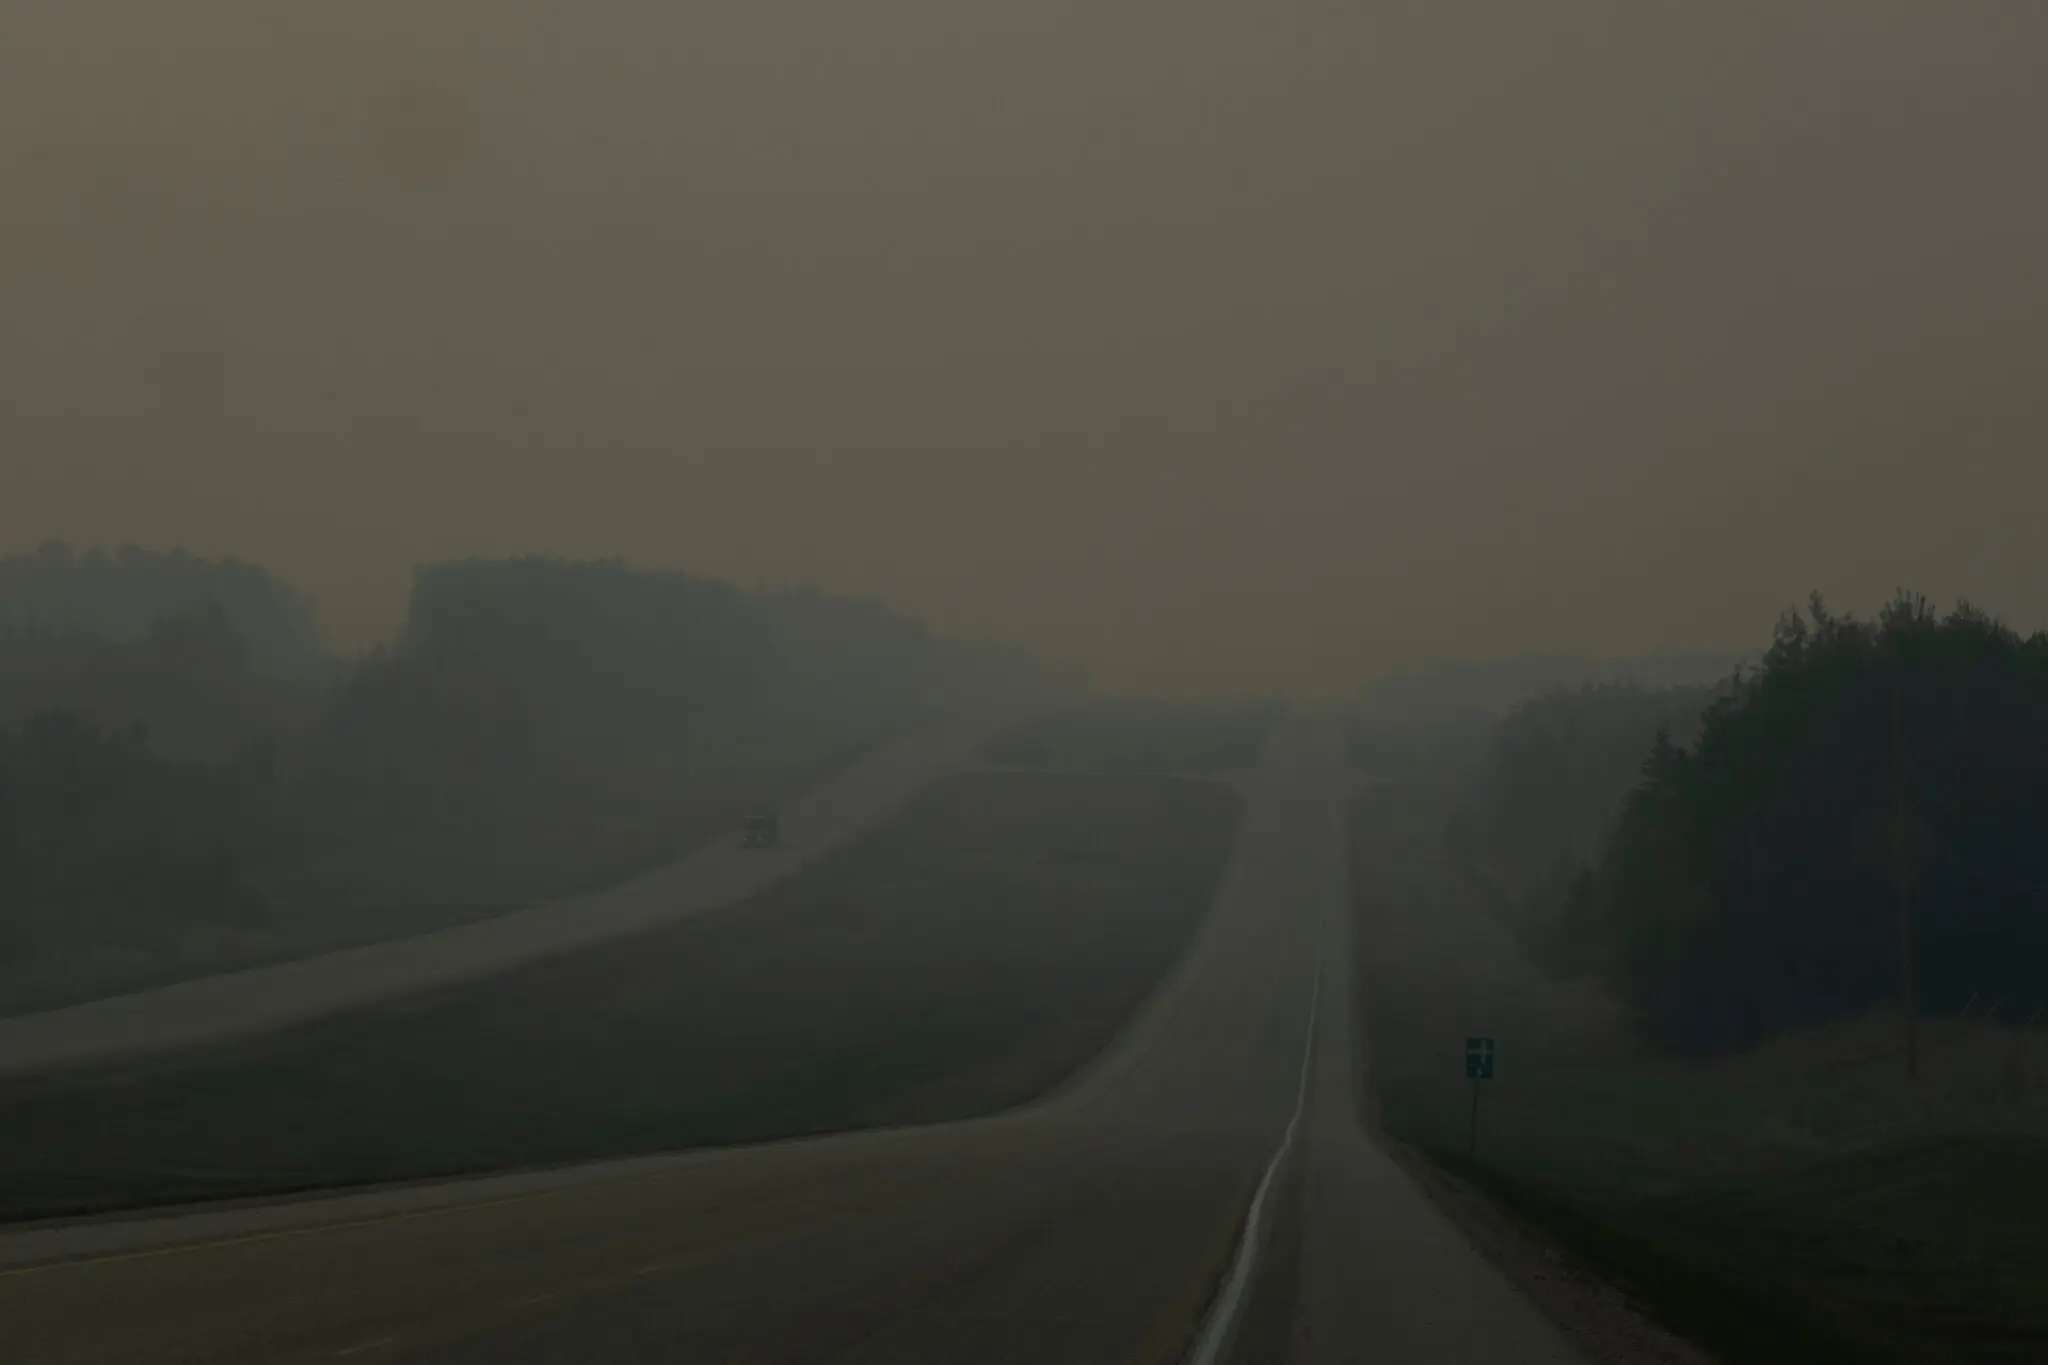
By Ian Austen 20 May 2023 (The New York Times) – When I arrived in Alberta recently to report an upcoming political story, there was no shortage of people wanting to talk about politics and the provincial election on May 29. But, even as wildfires flared earlier than usual and raged across an unusually wide […]
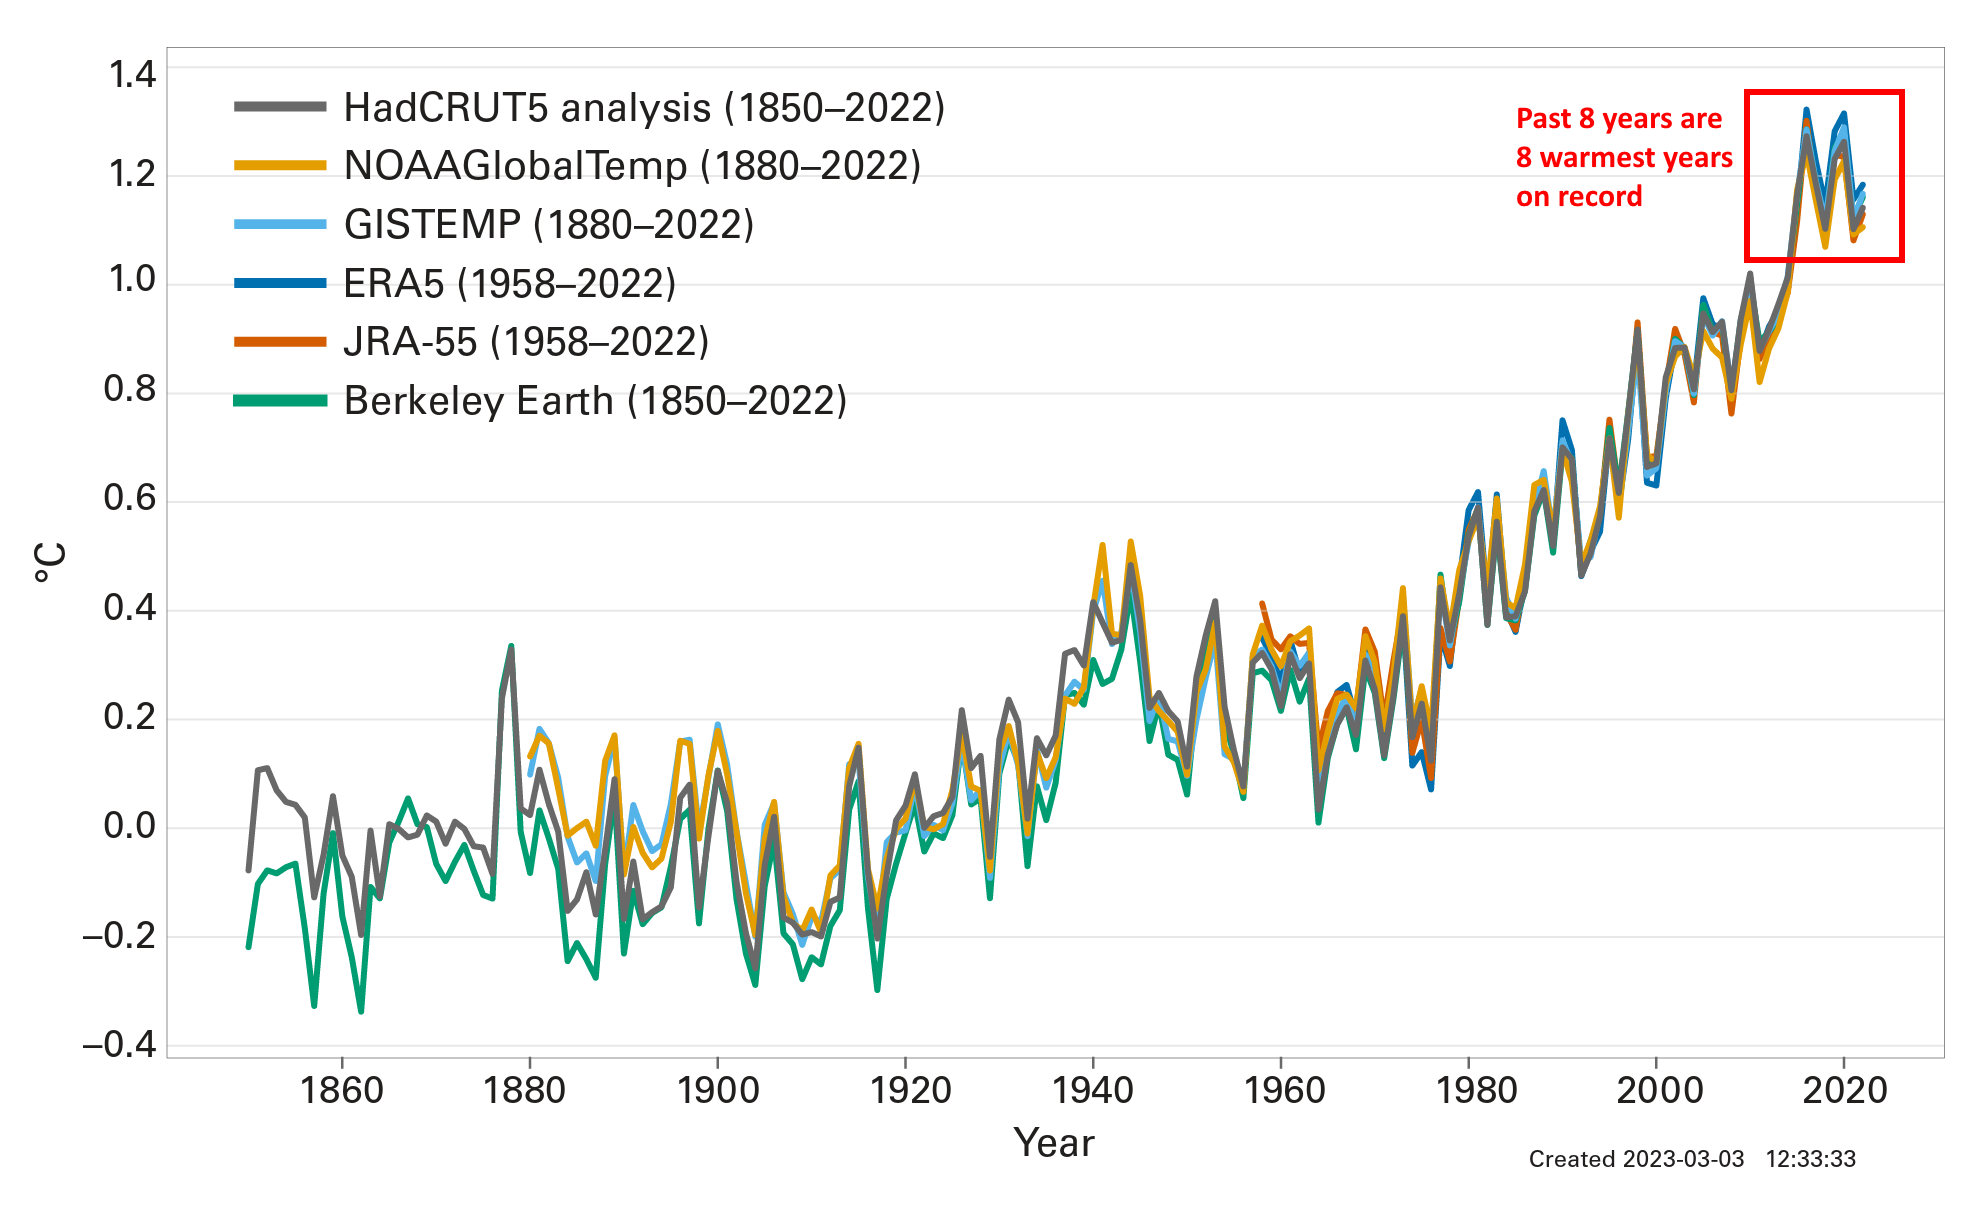
Geneva, 21 April 2023 (WMO) – From mountain peaks to ocean depths, climate change continued its advance in 2022, according to the annual report from the World Meteorological Organization (WMO). Droughts, floods, and heatwaves affected communities on every continent and cost many billions of dollars. Antarctic sea ice fell to its lowest extent on record […]
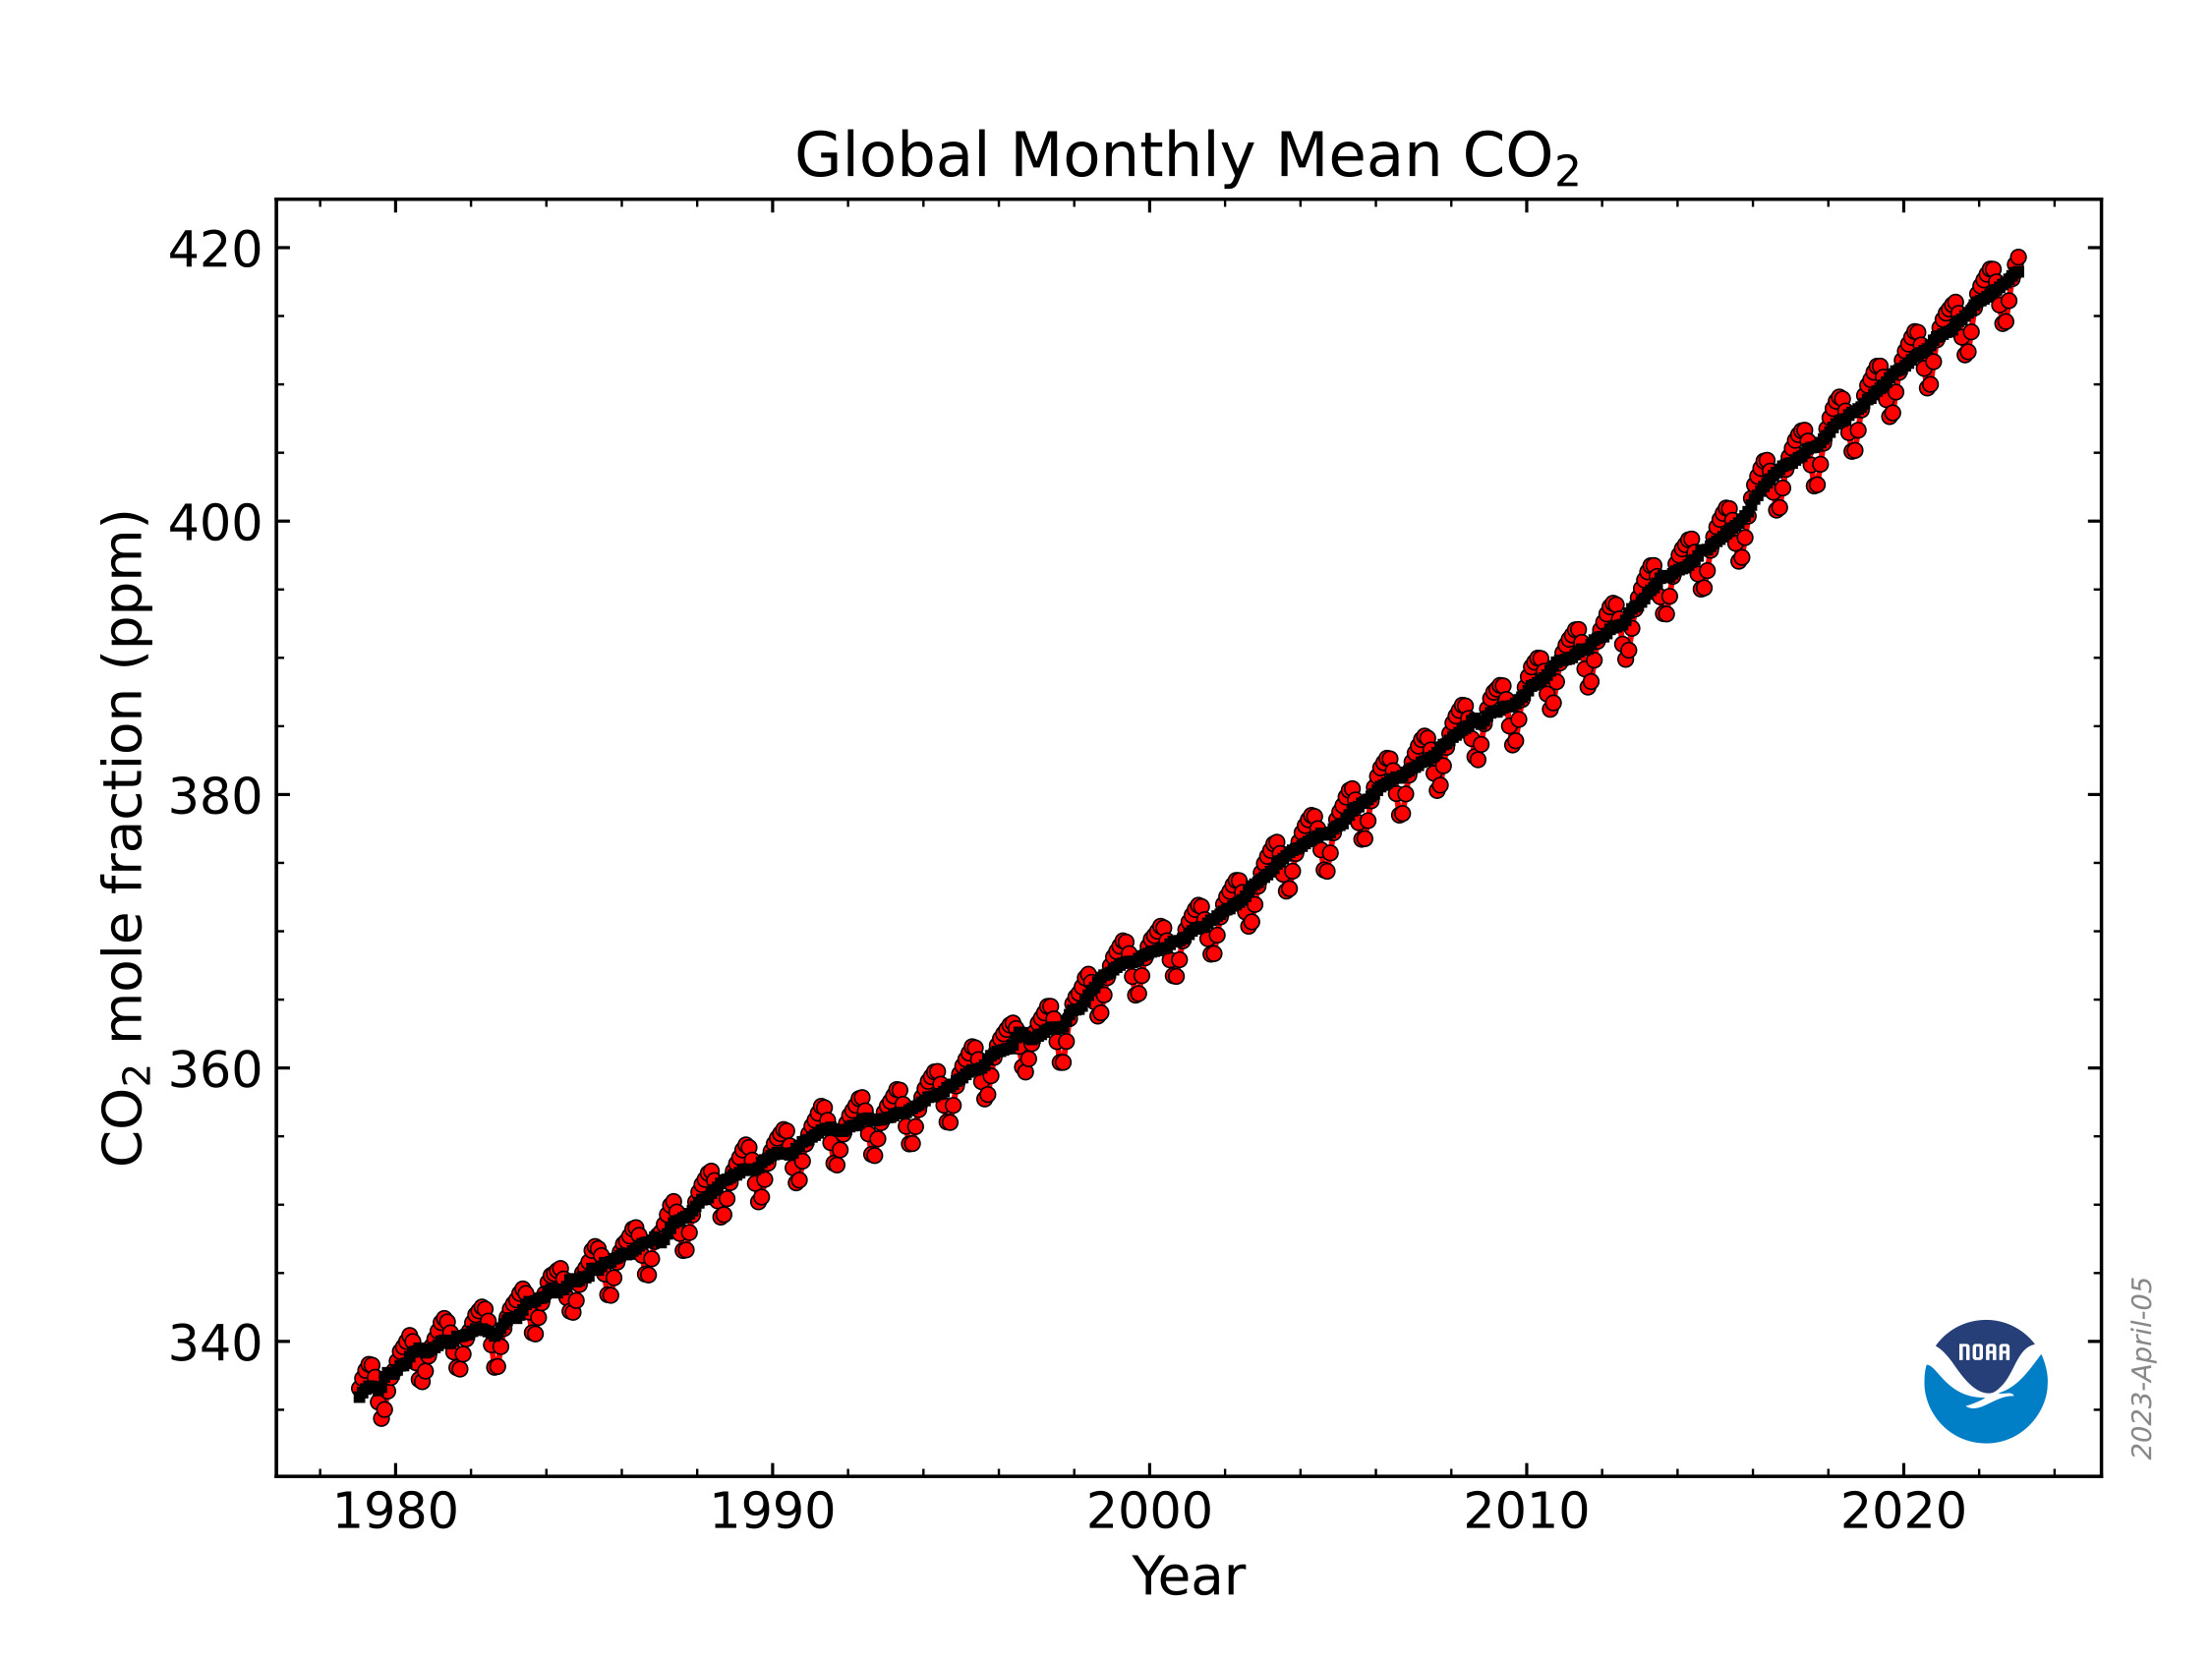
5 April 2023 (NOAA) – Levels of carbon dioxide (CO2), methane and nitrous oxide, the three greenhouse gases emitted by human activity that are the most significant contributors to climate change, continued their historically high rates of growth in the atmosphere during 2022, according to NOAA scientists. The global surface average for CO2 rose by 2.13 […]