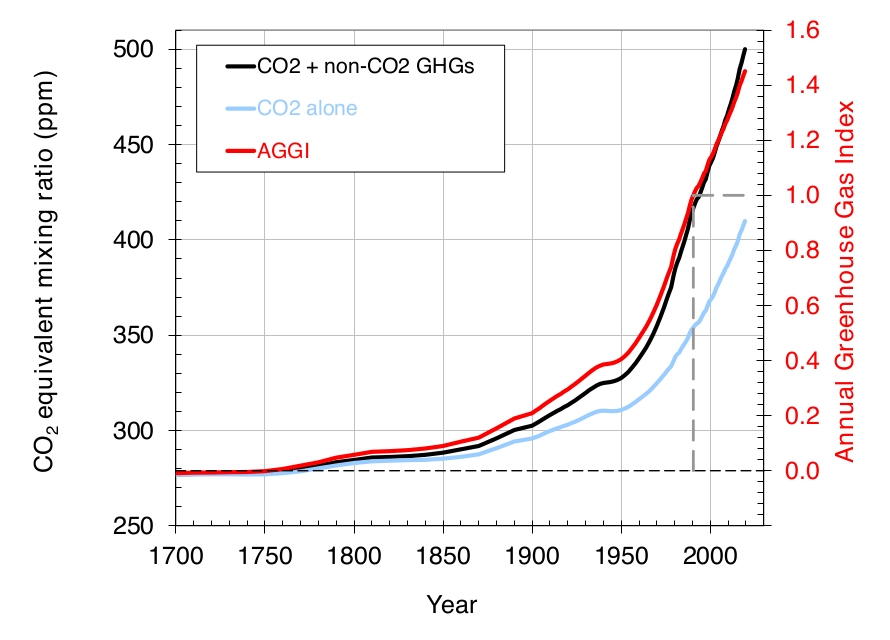
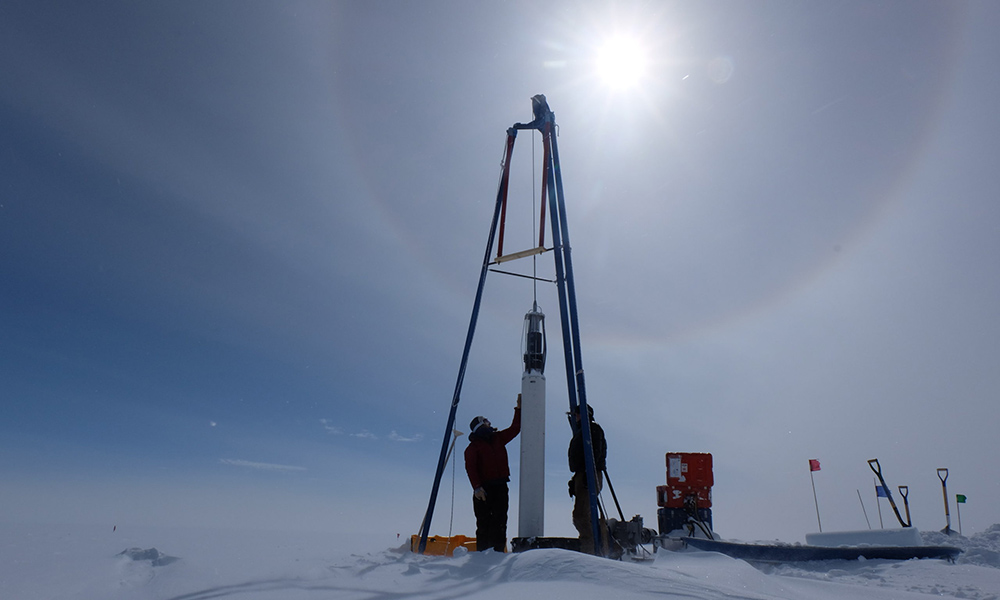
14 May 2020 (NOAA) – […] The NOAA monitoring program provides high-precision measurements of the global abundance and distribution of long-lived greenhouse gases that are used to calculate changes in radiative climate forcing. Air samples are collected through the NOAA/GML global air sampling network, including a cooperative program for the carbon gases which provides samples […]
By Maria Caffrey 20 March 2020 (UCS) – We are currently in a state of national emergency thanks in no small part to the Trump administration’s muzzling of public health experts and slow response to the COVID-19 pandemic. As we all do our part to limit the extent of this outbreak, the Department of the Interior (DOI) instead appears to be […]
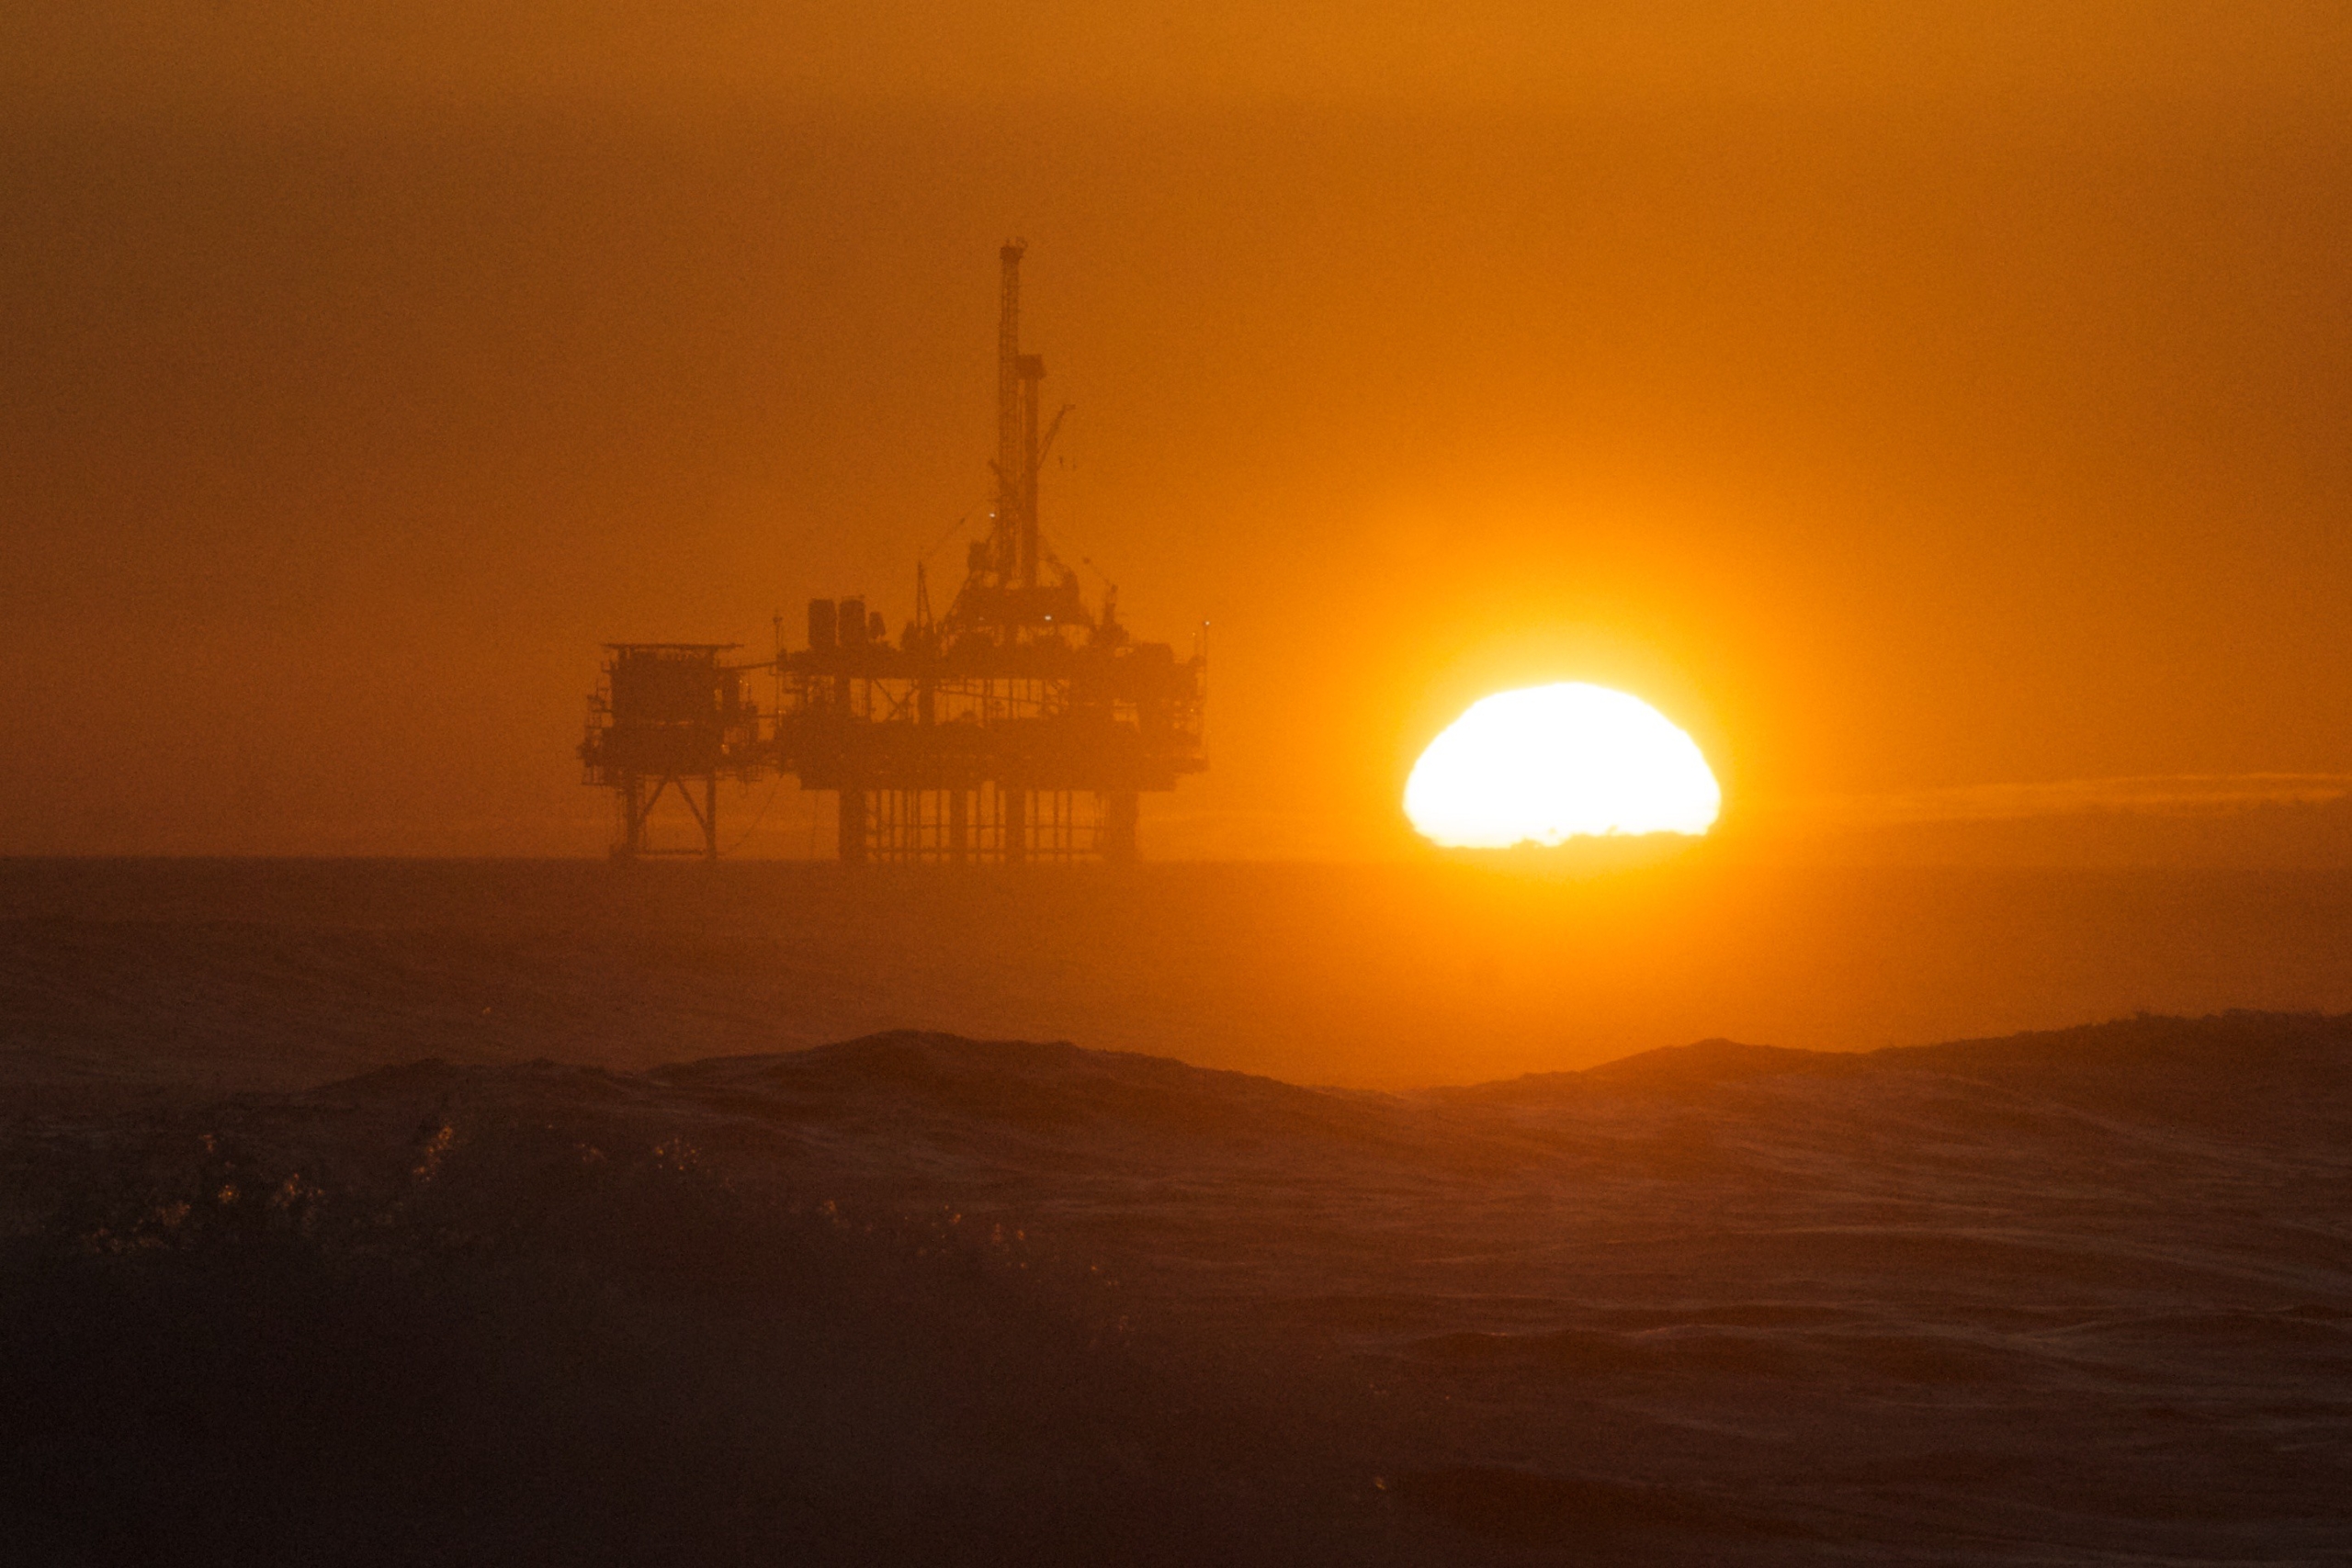
13 March 2020 (Carbon Tracker) – Company pay practice doesn’t yet live up to climate ambition, with the gap between stated ambition and demonstrable action widening. The energy transition is a challenge to the traditional business model of the oil and gas industry, and companies are increasingly exposed to transition-related financial risks. Over the past […]
By Lindsey Valich 19 February 2020 (University of Rochester) – Methane is a powerful greenhouse gas and large contributor to global warming. Methane emissions to the atmosphere have increased by approximately 150 percent over the past three centuries, but it has been difficult for researchers to determine exactly where these emissions originate; heat-trapping gases like […]
By Grace Dungey 13 February 2020 (Mongabay) – Humanity has depended on the ocean for millennia. Today, however, the rush to the sea is occurring with unprecedented diversity and intensity, propelled by population growth and demand for diminishing terrestrial resources. A study published in January in the new journal One Earth analyzed 50 years of data on 18 kinds […]
6 February 2020 (Global Witness) – We are at the beginning of a year of climate spin by the British Government. This year, the UK will host the 26th UN Climate Change Conference (COP26) in Glasgow. While the Government claims to be a ‘climate leader’, we reveal how a little-known investment group funded by the […]
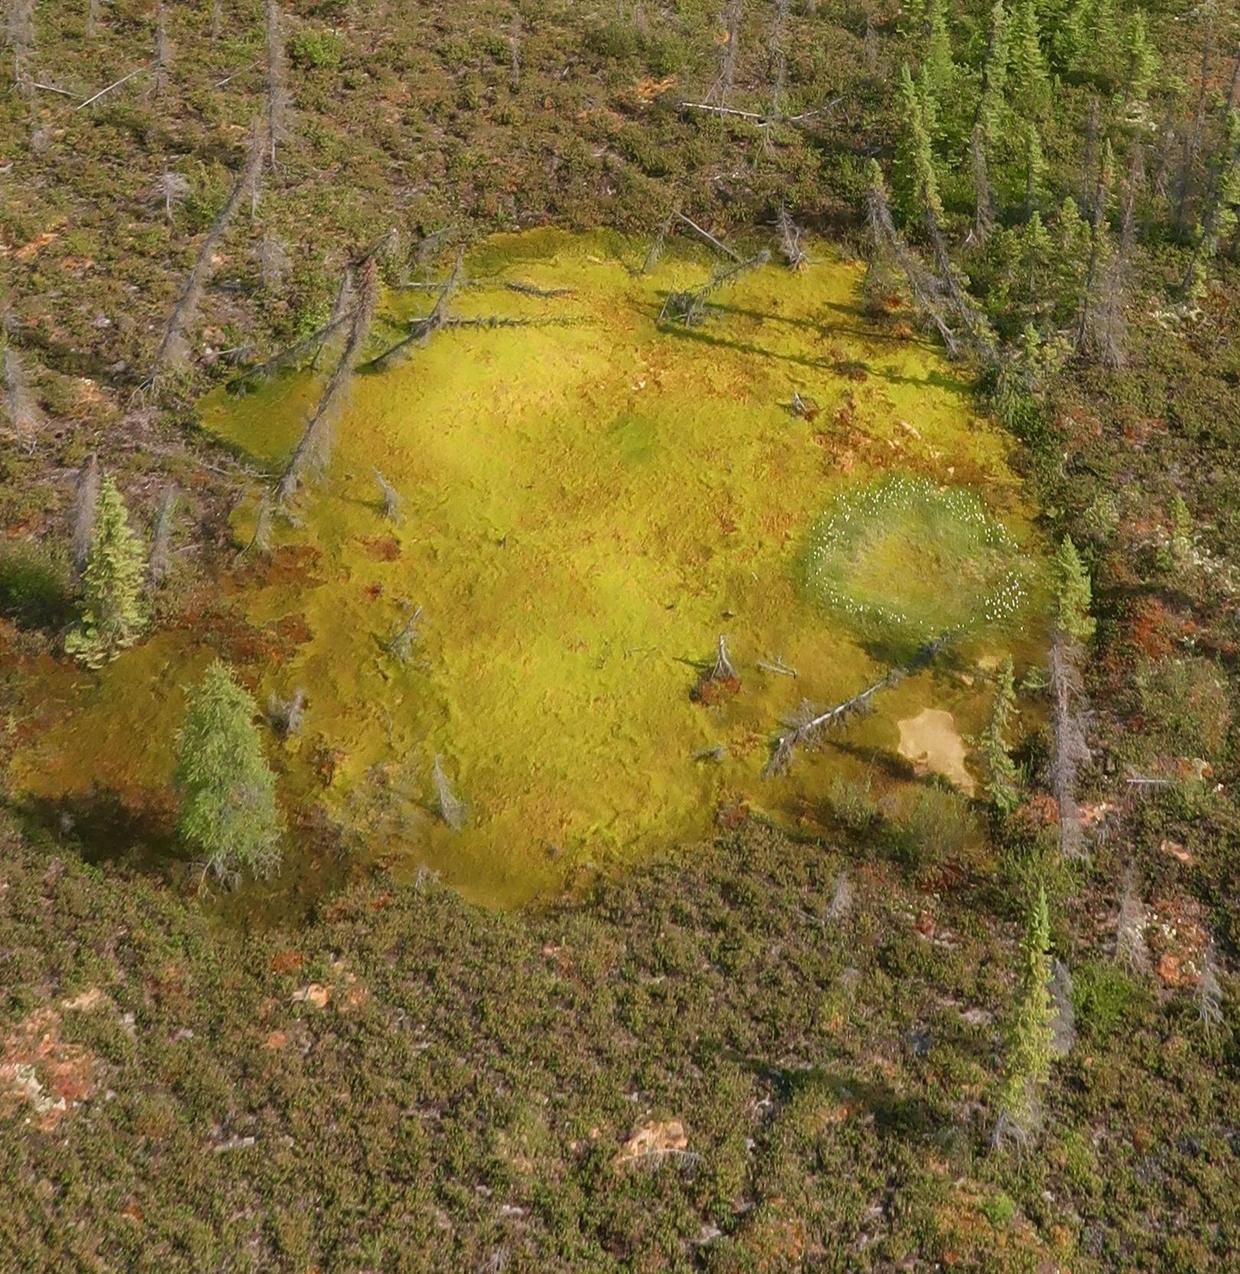
By Natacha Larnaud 4 February 2020 (CBS News) – Rapidly thawing permafrost in the Arctic has scientists worried. According to a new study published Monday in the journal Nature Geoscience, the ice that holds the soil together is melting, causing hillsides to collapse and massive sinkholes to open up as a result. And that dramatic disruption to […]
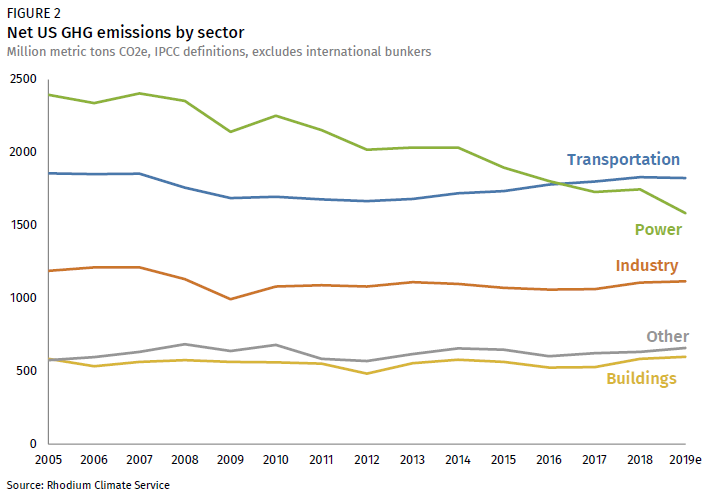
By Trevor Houser and Hannah Pitt 7 January 2020 (Rhodium Group) – After a sharp uptick in 2018, we estimate that US greenhouse gas (GHG) emissions fell by 2.1% last year based on preliminary energy and economic data. This decline was due almost entirely to a drop in coal consumption. Coal-fired power generation fell by […]
3 January 2020 (EIA) – In its newly released International Energy Outlook 2019 (IEO2019) Reference case, the U.S. Energy Information Administration (EIA) projects that world energy consumption will grow by nearly 50 percent between 2018 and 2050. Most of this growth comes from countries that are not in the Organization for Economic Cooperation and Development (OECD), and […]
By Tim Henderson 19 December 2019 (Pew) – Despite an economic recovery that lifted people out of poverty in most areas of the country, poverty increased in at least one county in every state between 2016 and 2018. The poverty rate grew in 30% of counties between 2016 and 2018, according to a Stateline analysis of U.S. Census […]