11 December 2020 (UEA) – The global COVID-19 lockdowns caused fossil carbon dioxide emissions to decline by an estimated 2.4 billion tonnes in 2020 – a record drop according to researchers at the University of East Anglia (UEA), University of Exeter, and the Global Carbon Project. The fall is considerably larger than previous significant decreases […]
GENEVA, 23 November 2020 (WMO) – The industrial slowdown due to the COVID-19 pandemic has not curbed record levels of greenhouse gases which are trapping heat in the atmosphere, increasing temperatures, and driving more extreme weather, ice melt, sea-level rise, and ocean acidification, according to the World Meteorological Organization (WMO). The lockdown has cut emissions […]
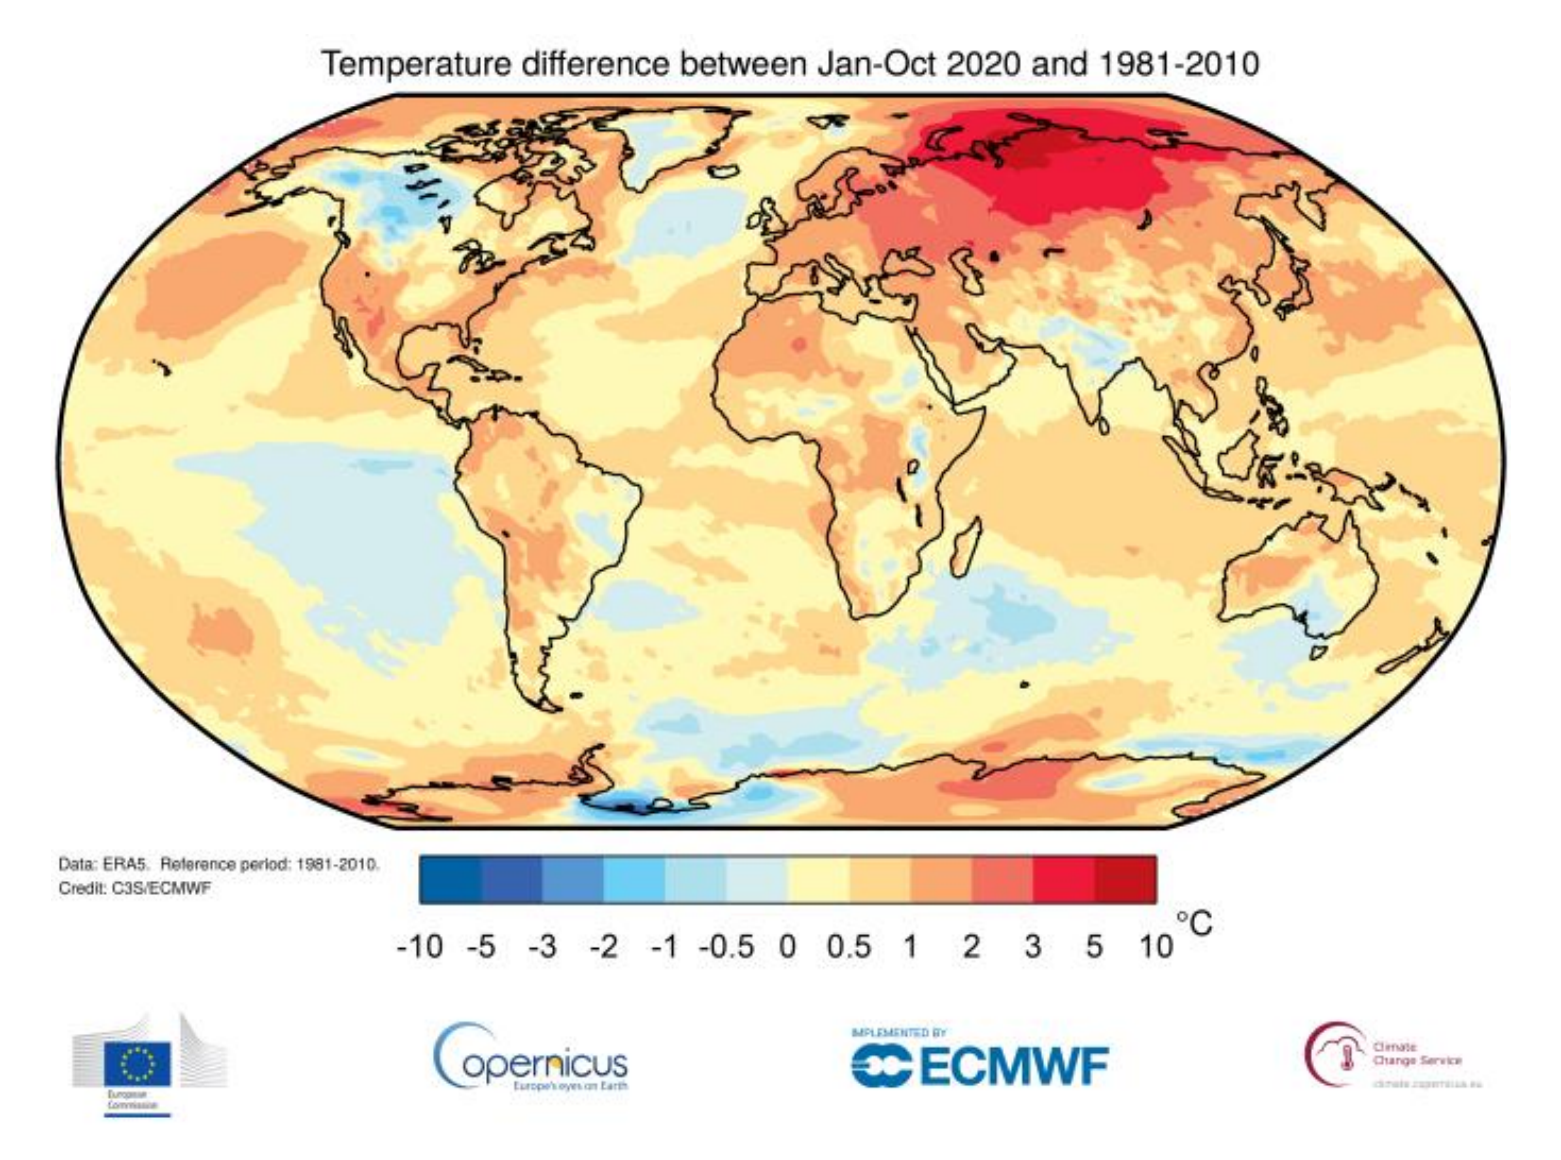
GENEVA, 2 December 2020 (WMO) – Climate change continued its relentless march in 2020, which is on track to be one of the three warmest years on record. 2011-2020 will be the warmest decade on record, with the warmest six years all being since 2015, according to the World Meteorological Organization. Ocean heat is at […]
By Matthew Cappucci 12 September 2020 (The Washington Post) – More than 3.1 million acres have burned in California this year, part of a record fire season that still has four months to go. A suffocating cloud of smoke has veiled the West Coast for days, extending more than a thousand miles above the Pacific. And the […]
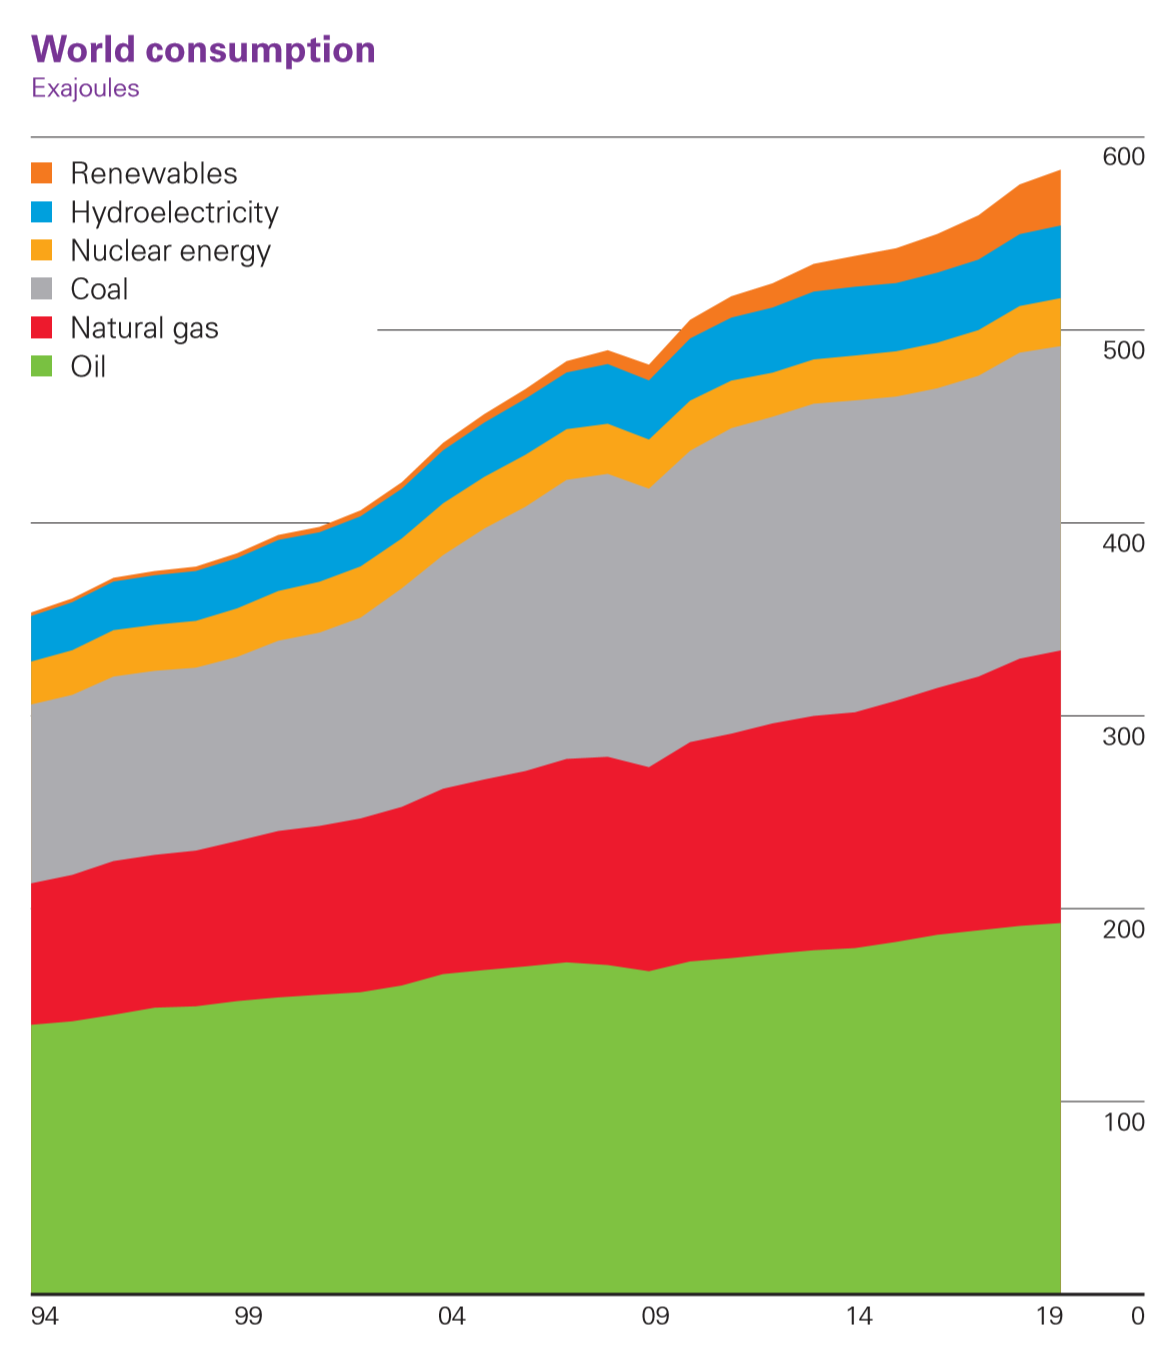
By Bernard Looney 17 June 2020 (BP) – The COVID-19 pandemic may well turn out to be the most tragic and disruptive event that many of us will ever live through. As I write this – in the middle of June – over 400 thousand people globally have lost their lives to the infection. Millions […]
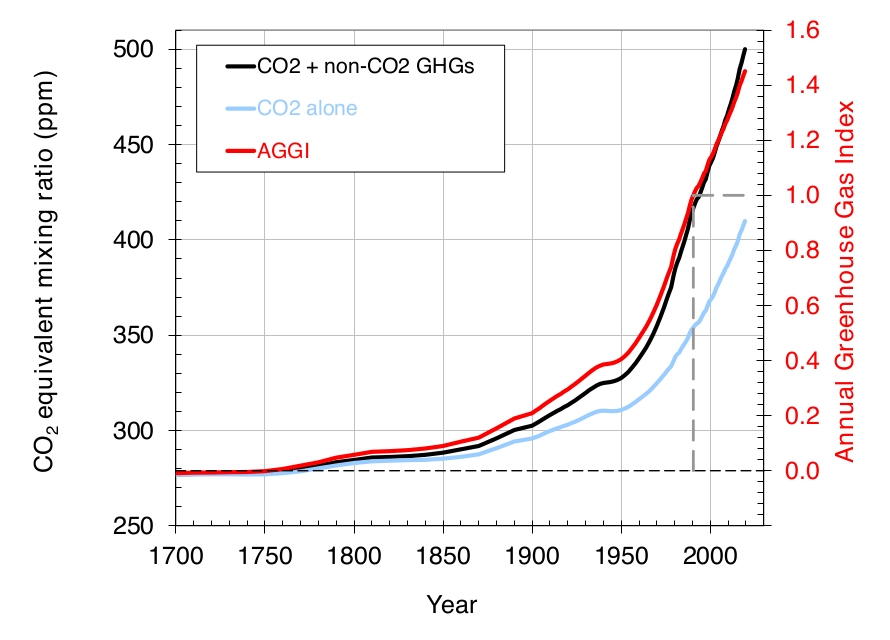
14 May 2020 (NOAA) – […] The NOAA monitoring program provides high-precision measurements of the global abundance and distribution of long-lived greenhouse gases that are used to calculate changes in radiative climate forcing. Air samples are collected through the NOAA/GML global air sampling network, including a cooperative program for the carbon gases which provides samples […]
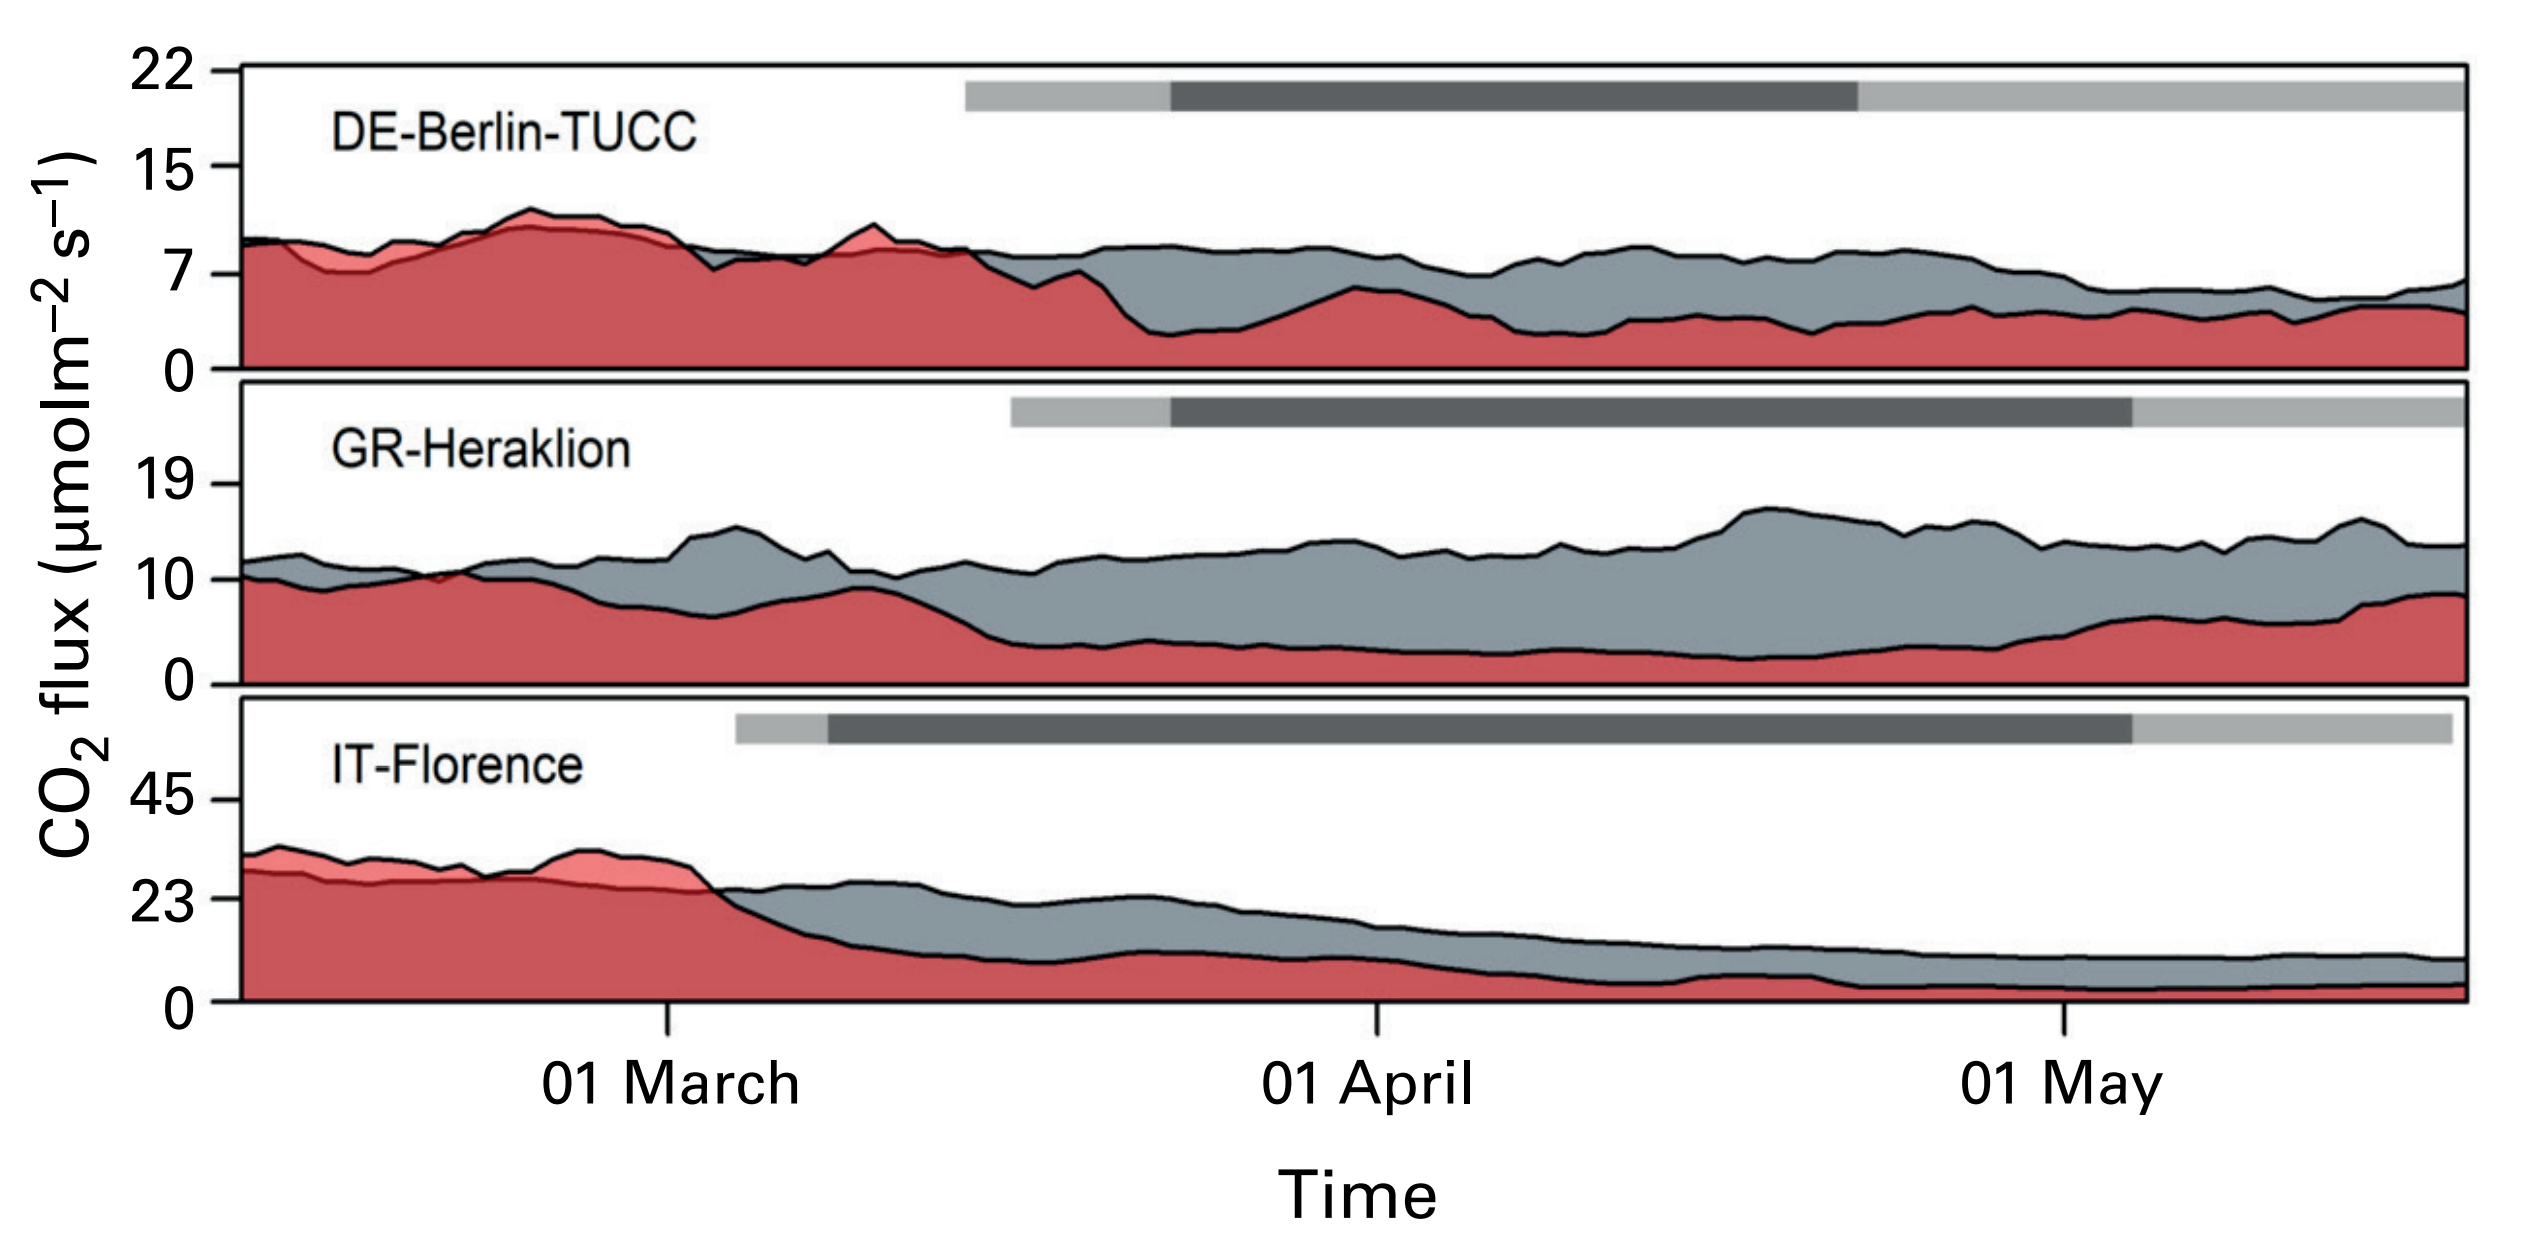
19 May 2020 (UEA) – The COVID-19 global lockdown has had an “extreme” effect on daily carbon emissions, but it is unlikely to last – according to a new analysis by an international team of scientists. The study published in the journal Nature Climate Change shows that daily emissions decreased by 17% – or 17 […]
By Tony Barboza 7 March 2020 (Los Angeles Times) – Behind the tap-of-your-phone convenience of hailing an Uber or Lyft lies an inconvenient truth: Such rides generate more carbon emissions than simply driving yourself. The increased pollution comes primarily from “deadheading,” that is, drivers traveling to pick up a passenger or cruising the streets while […]
18 December 2019 (NOAA) – New research by NOAA, the University of Maryland, and international partners published in Nature Scientific Reports shows that the changing chemistry of seawater has implications for continued greenhouse gas absorption. The ocean has been playing an important role in helping slow down global climate change by removing the greenhouse gas carbon dioxide […]
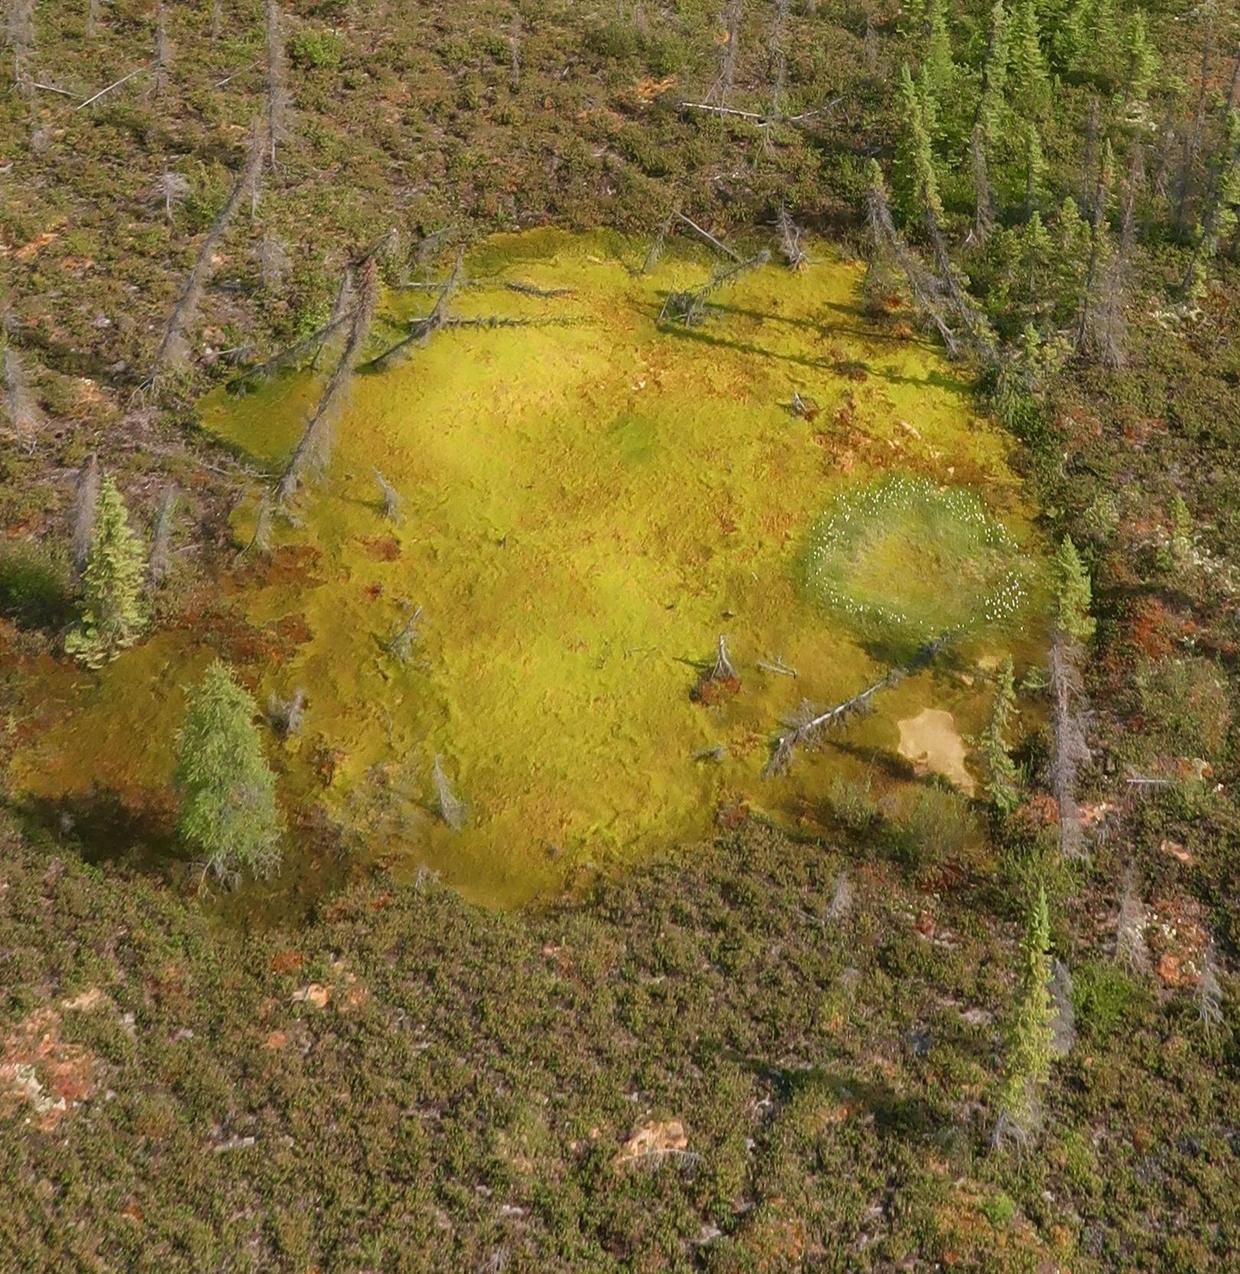
By Natacha Larnaud 4 February 2020 (CBS News) – Rapidly thawing permafrost in the Arctic has scientists worried. According to a new study published Monday in the journal Nature Geoscience, the ice that holds the soil together is melting, causing hillsides to collapse and massive sinkholes to open up as a result. And that dramatic disruption to […]