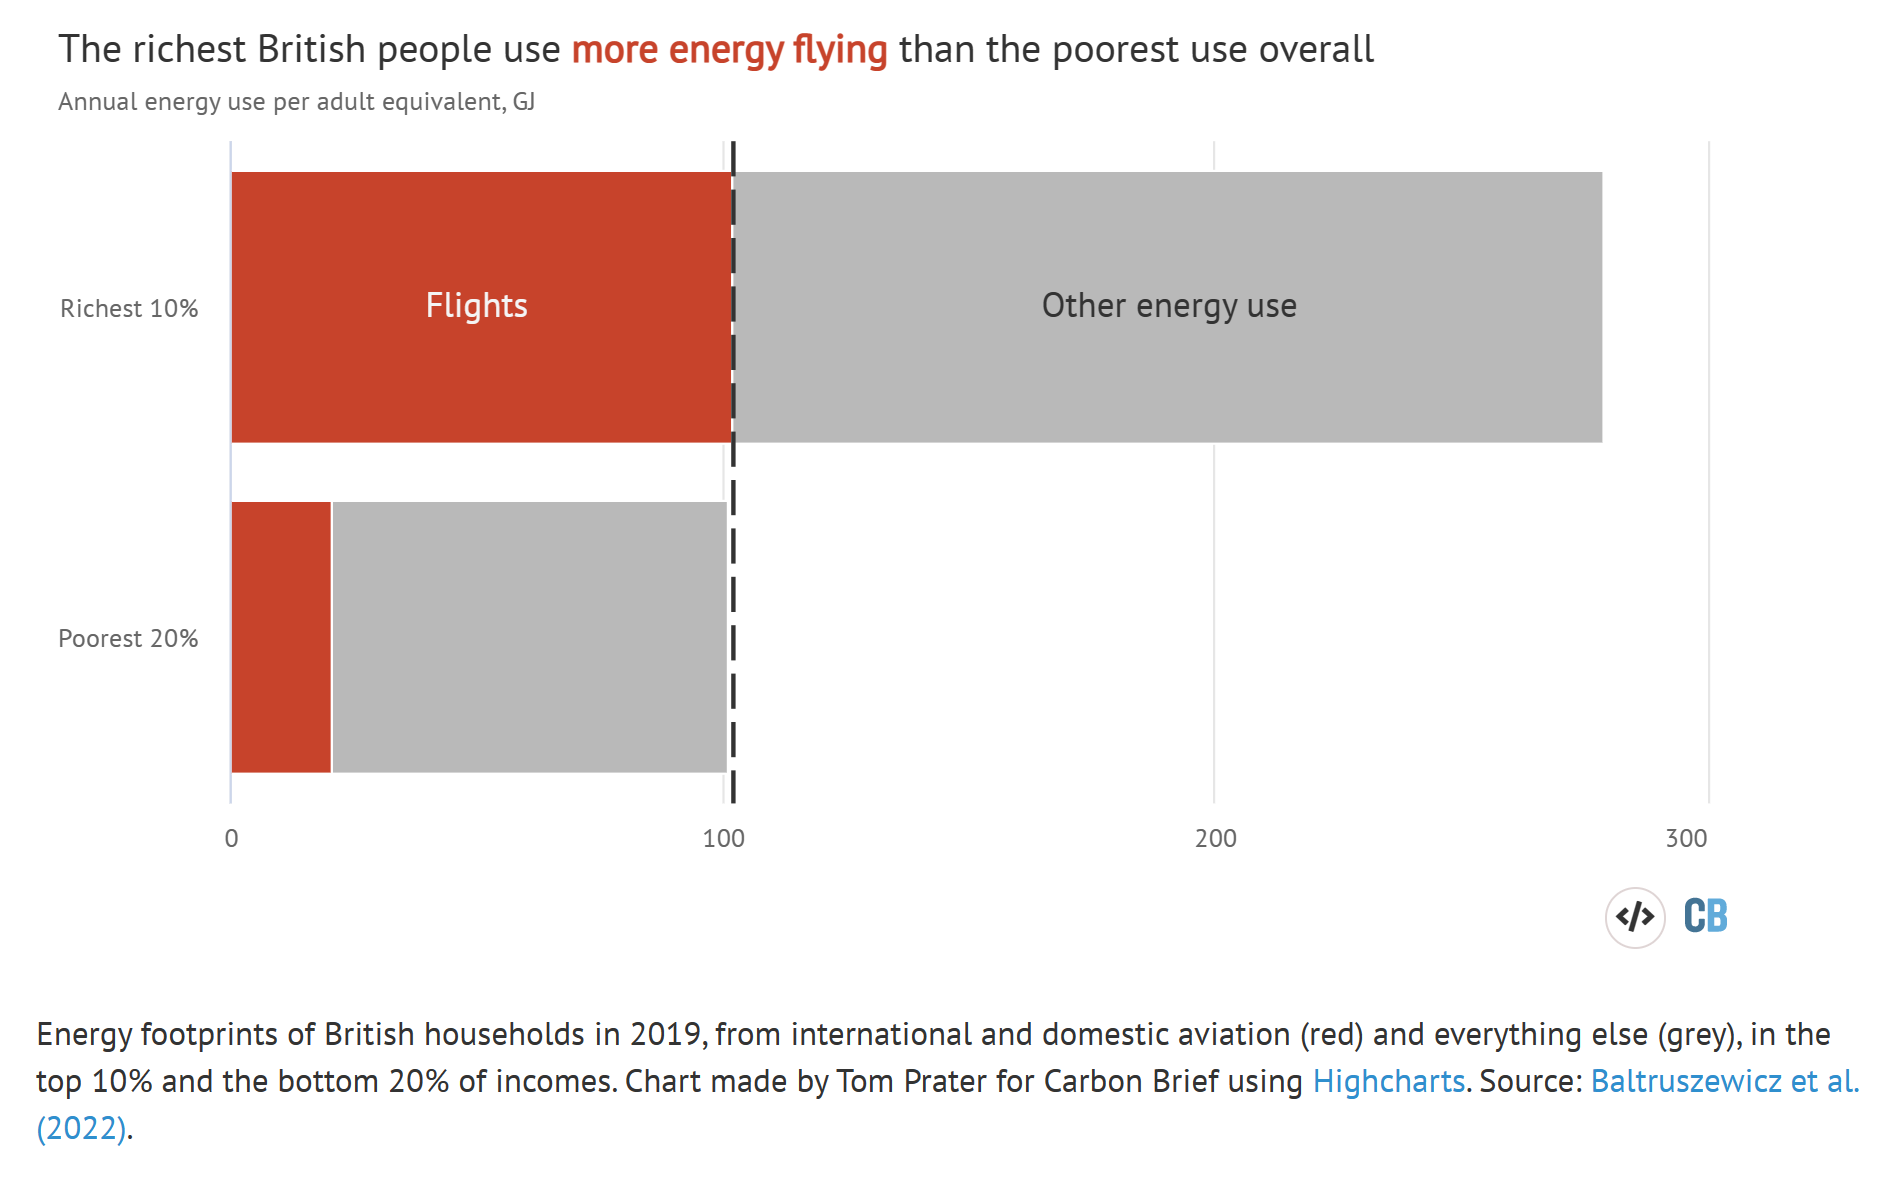
By Josh Gabbatiss 14 December 2022 (Carbon Brief) – The wealthiest people in the UK burn through more energy flying than the poorest use in every aspect of their lives, according to new research. The analysis of data from 2019 highlights “significant inequalities” in energy use across the country. Those in the top 10% of […]
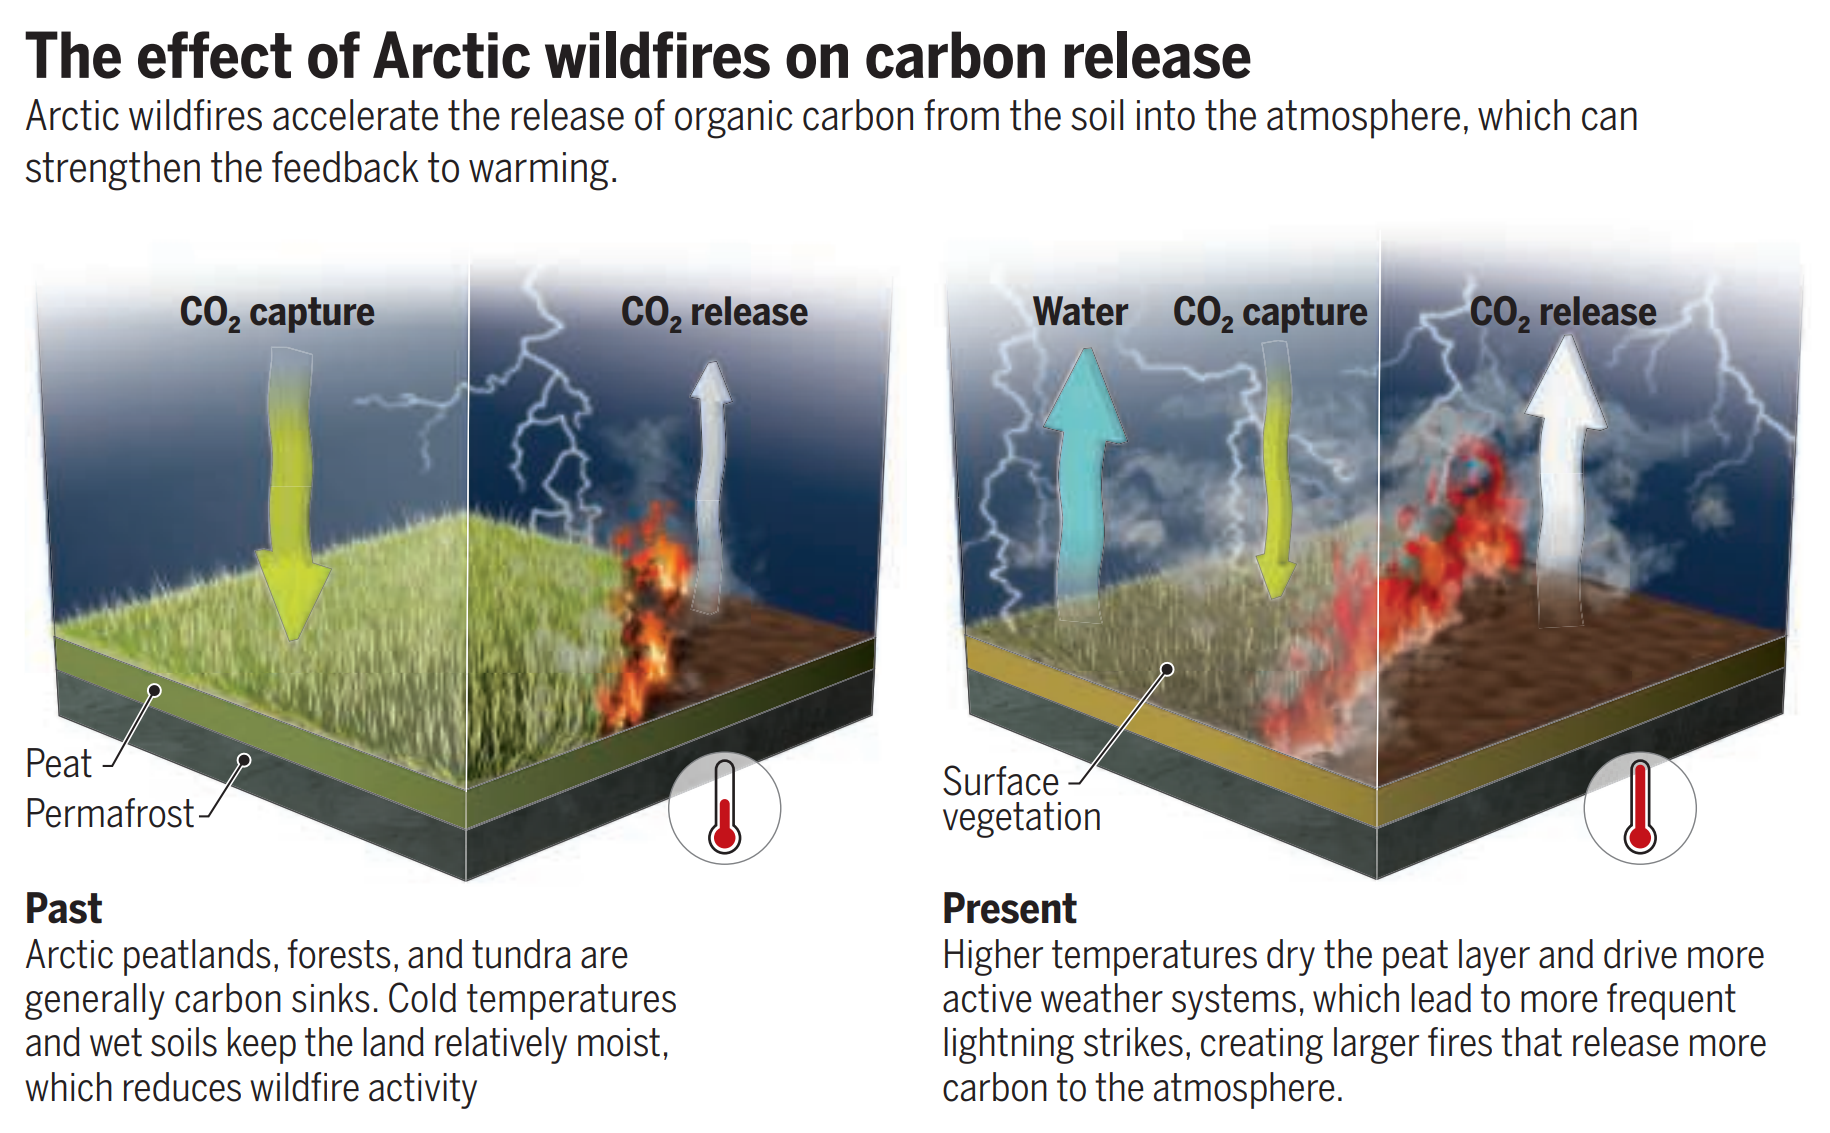
By Kat Kerlin 8 November 2022 (UC Davis) – From Sierra Nevada forests to Arctic peatlands, climate warming is turning some long-held carbon sinks into carbon sources as wildfires increasingly send stored carbon up in smoke. In the Arctic, vast amounts of carbon have been locked beneath frozen soil, much of it in peatlands. Climate warming dries […]
By Nina Lakhani 20 December 2022 (The Guardian) – The same racketeering legislation used to bring down mob bosses, motorcycle gangs, football executives and international fraudsters is to be tested against oil and coal companies who are accused of conspiring to deceive the public over the climate crisis. In an ambitious move, an attempt will […]
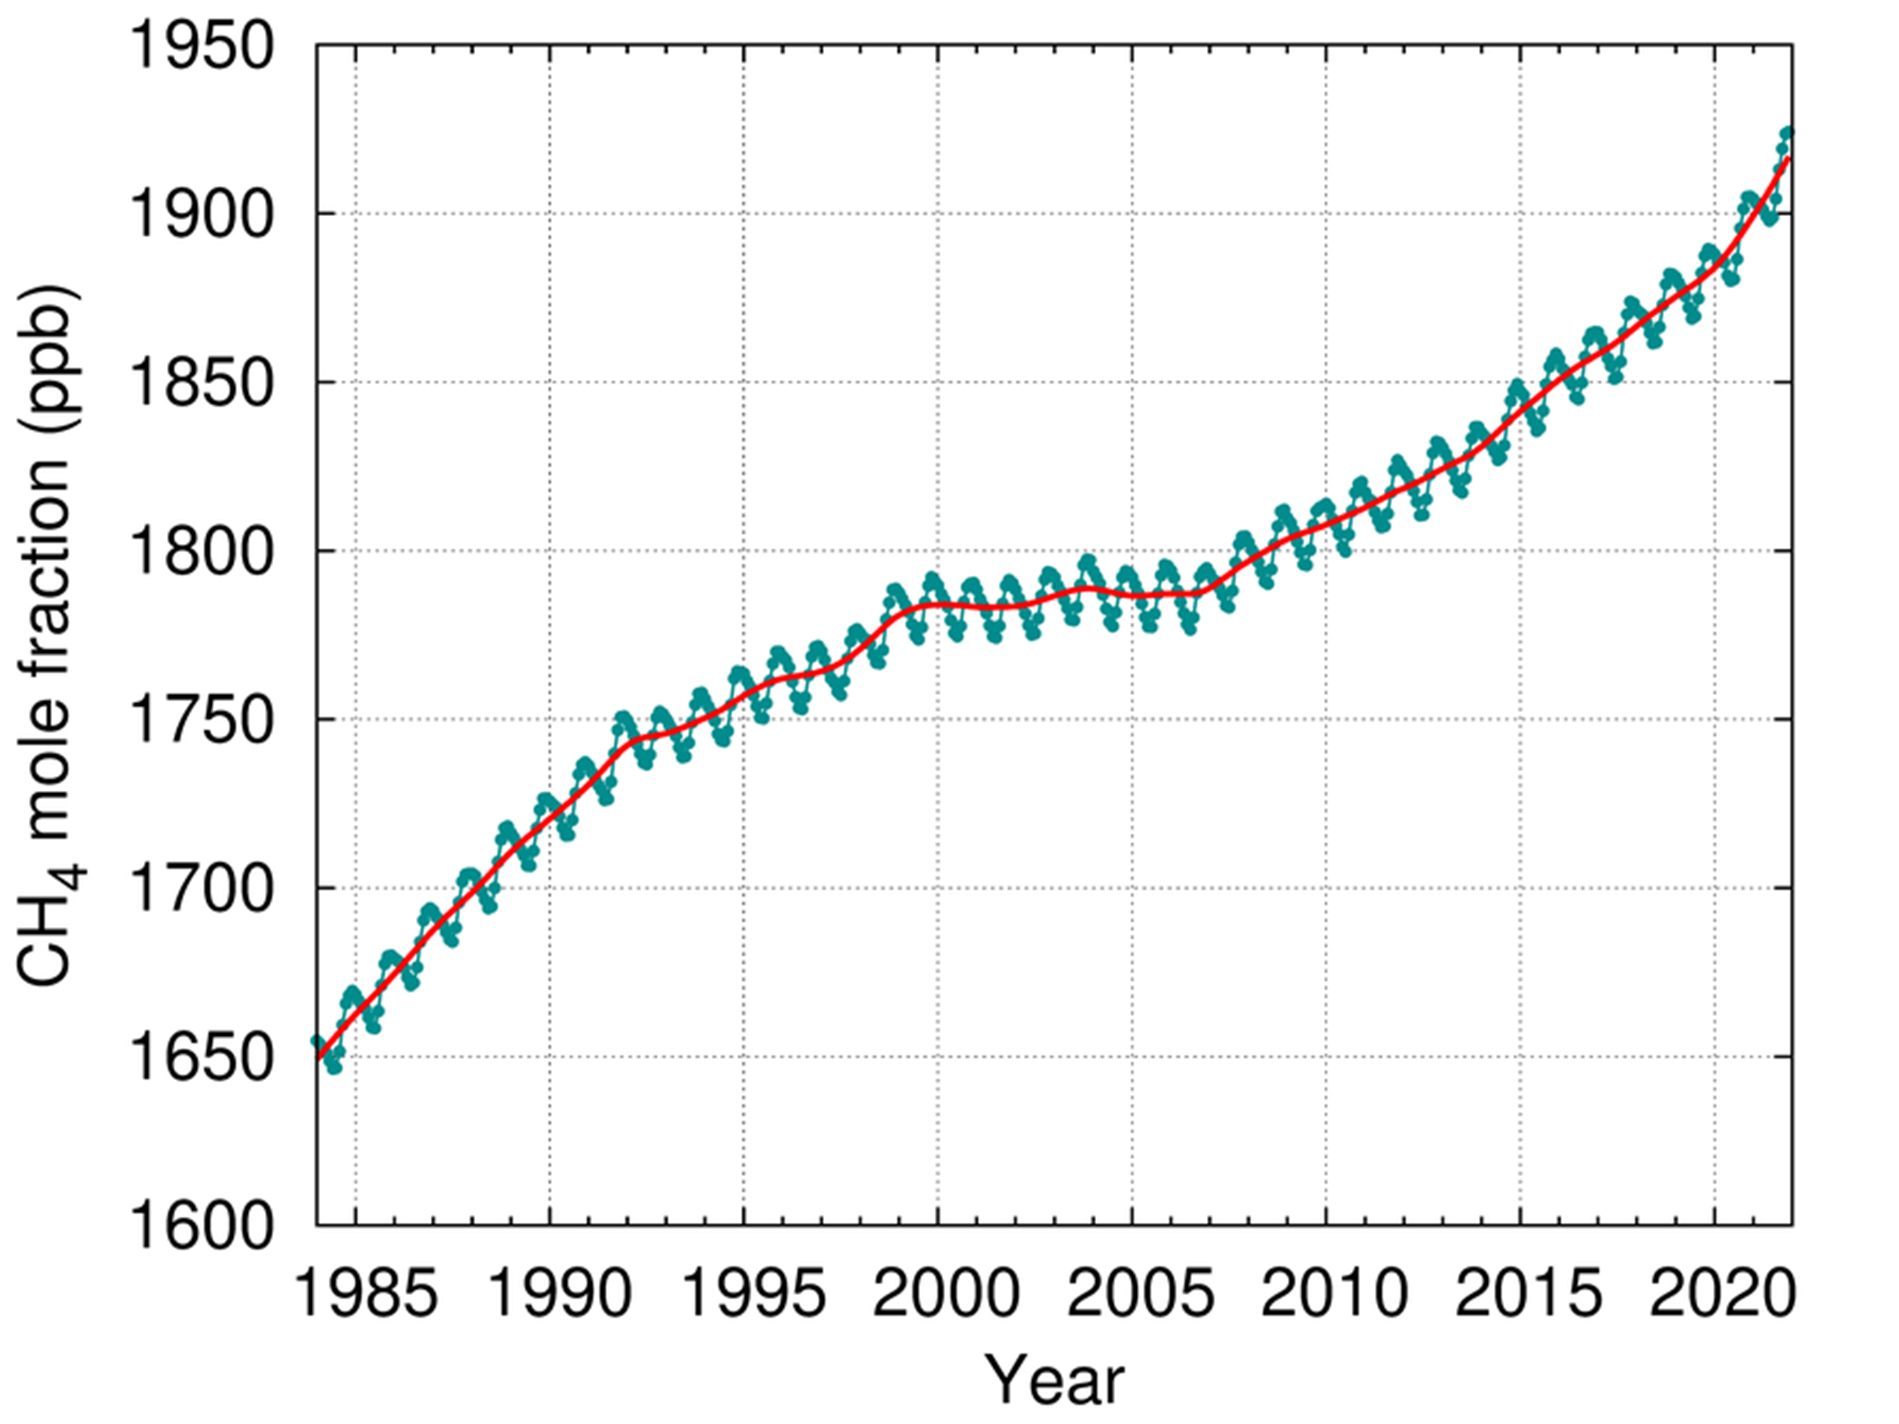
GENEVA / NEW YORK, 26 October 2022 (WMO) – In yet another ominous climate change warning, atmospheric levels of the three main greenhouse gases – carbon dioxide, methane and nitrous oxide all reached new record highs in 2021, according to a new report from the World Meteorological Organization (WMO). WMO’s Greenhouse Gas Bulletin reported the biggest […]
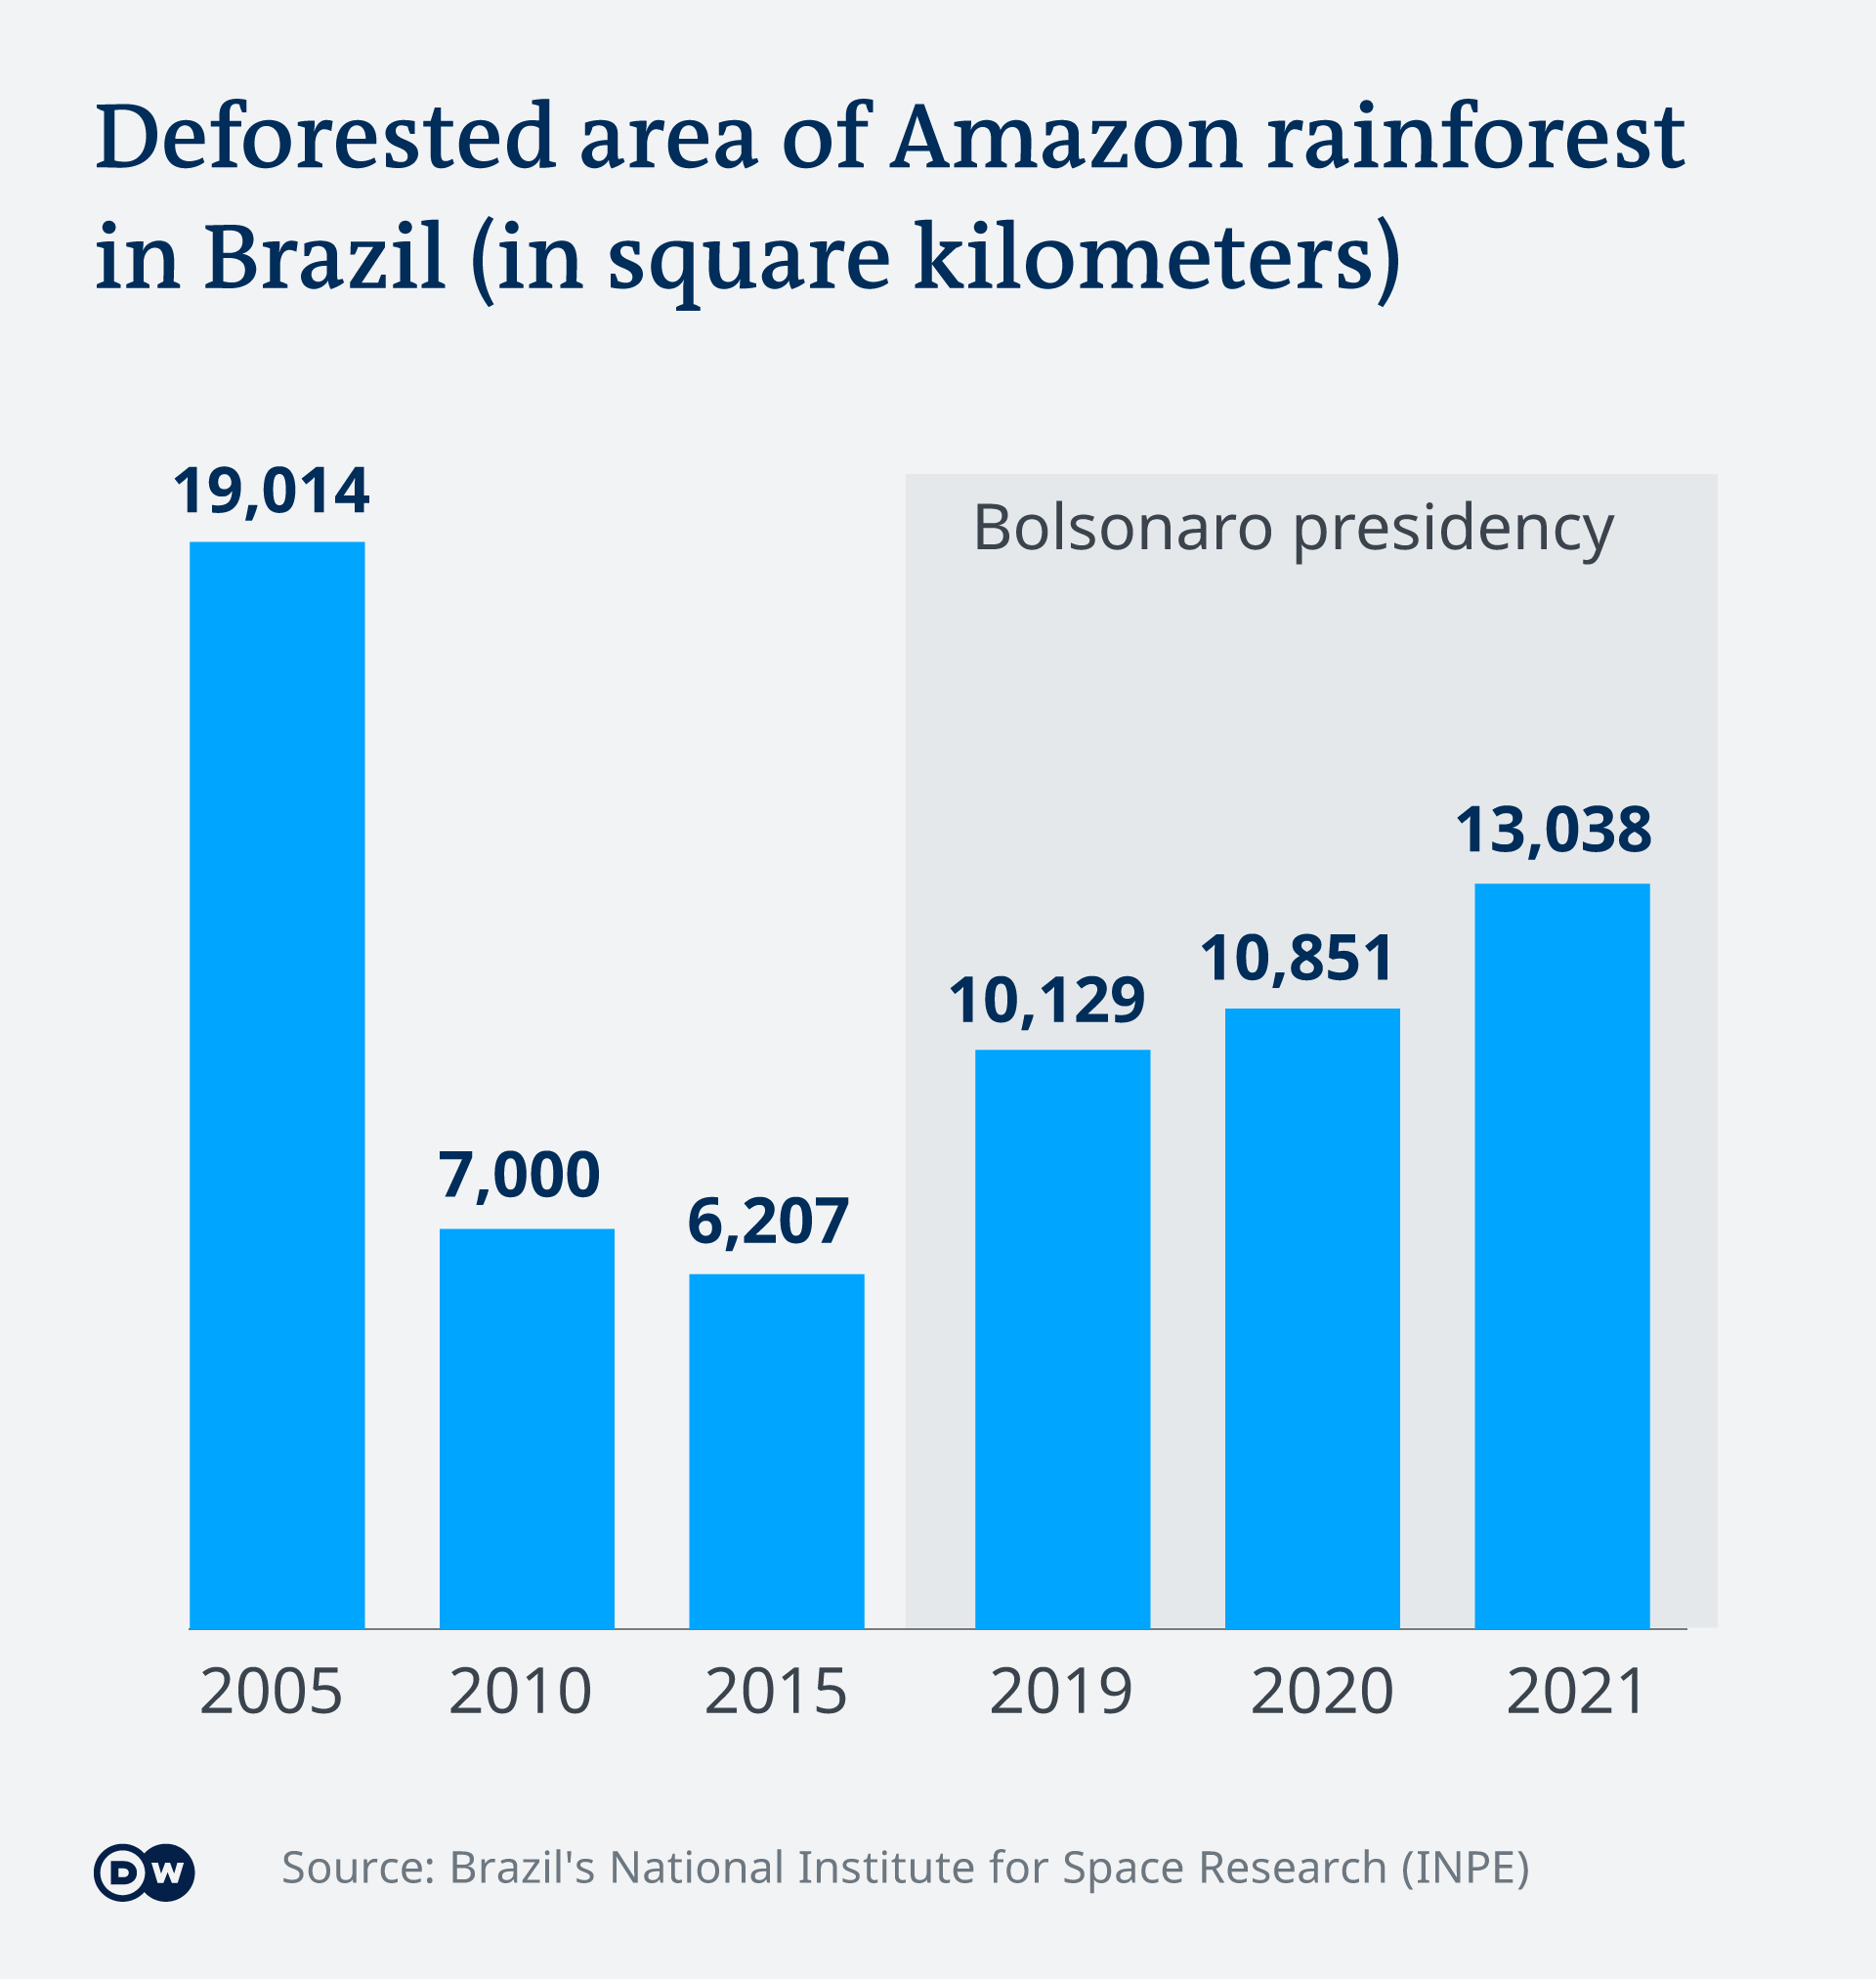
By Stuart Braun 16 November 2022 (DW) – One of the most-watched visitors to the UN climate summit in Egypt this week has been incoming Brazilian president, Luiz Inacio Lula da Silva — more commonly referred to as Lula. With his successful election campaign having included a promise to arrest record deforestation in the Amazon, Lula carried huge expectations into the yearly climate summit […]
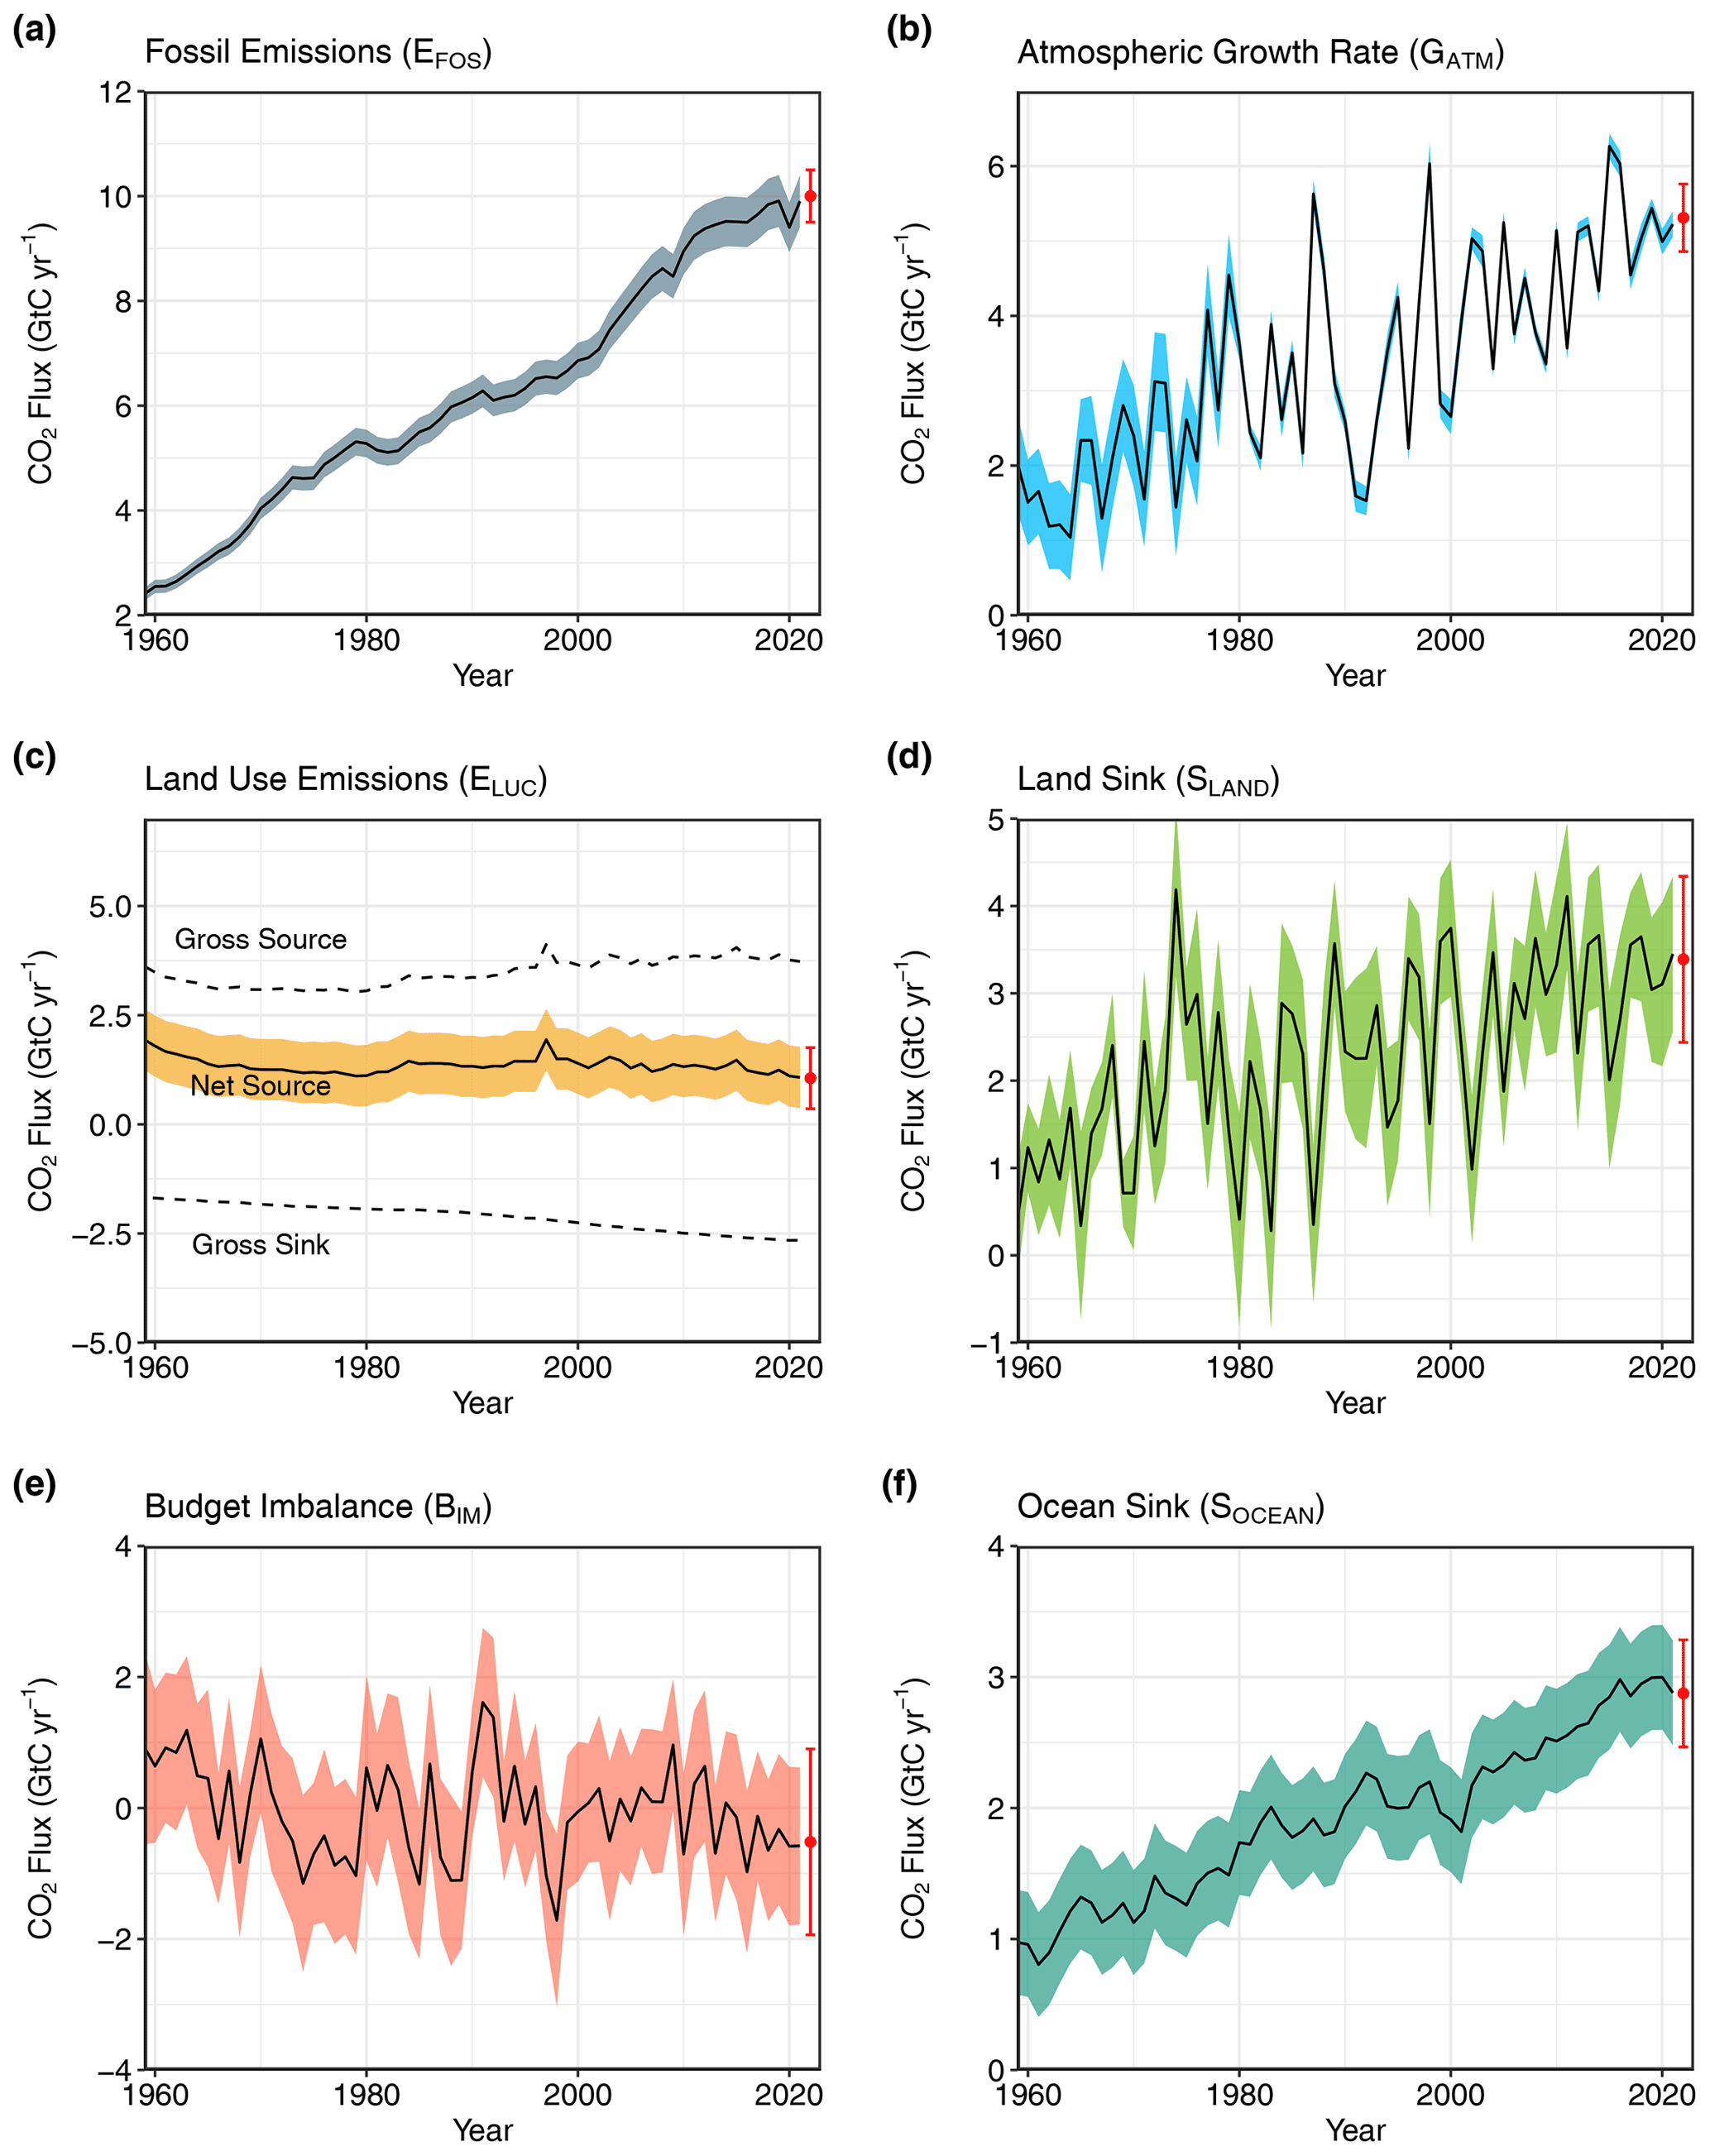
11 November 2022 (Global Carbon Project) – Global carbon emissions in 2022 remain at record levels – with no sign of the decrease that is urgently needed to limit warming to 1.5°C, according to the Global Carbon Project science team (Global Carbon Budget 2022). If current emissions levels persist, there is now a 50% chance […]
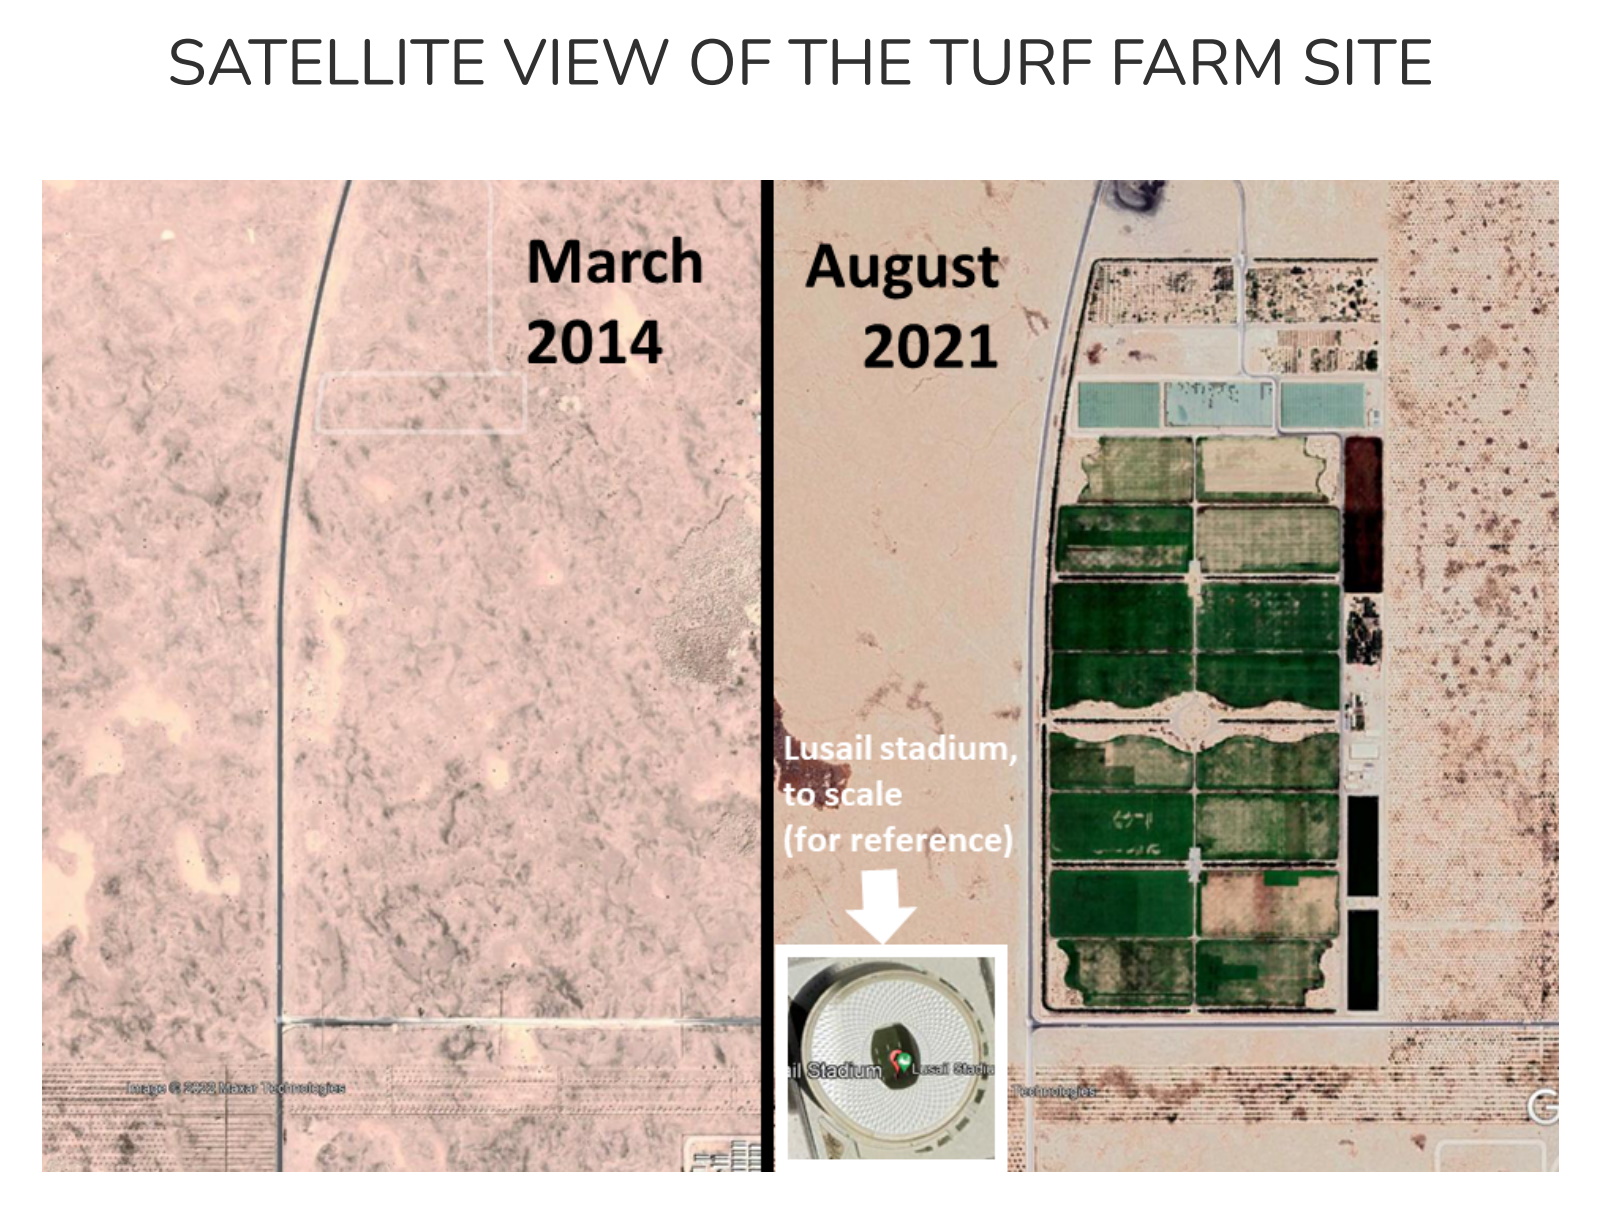
By Stéphane Mandard 19 November 2022 (Le Monde) – Organizers will have to buy 3.6 million carbon credits to compensate for emissions, according to FIFA. Carbon Market Watch says this estimate is too low – and a long way off. FIFA claims that the World Cup in Qatar will be the first to be “carbon […]
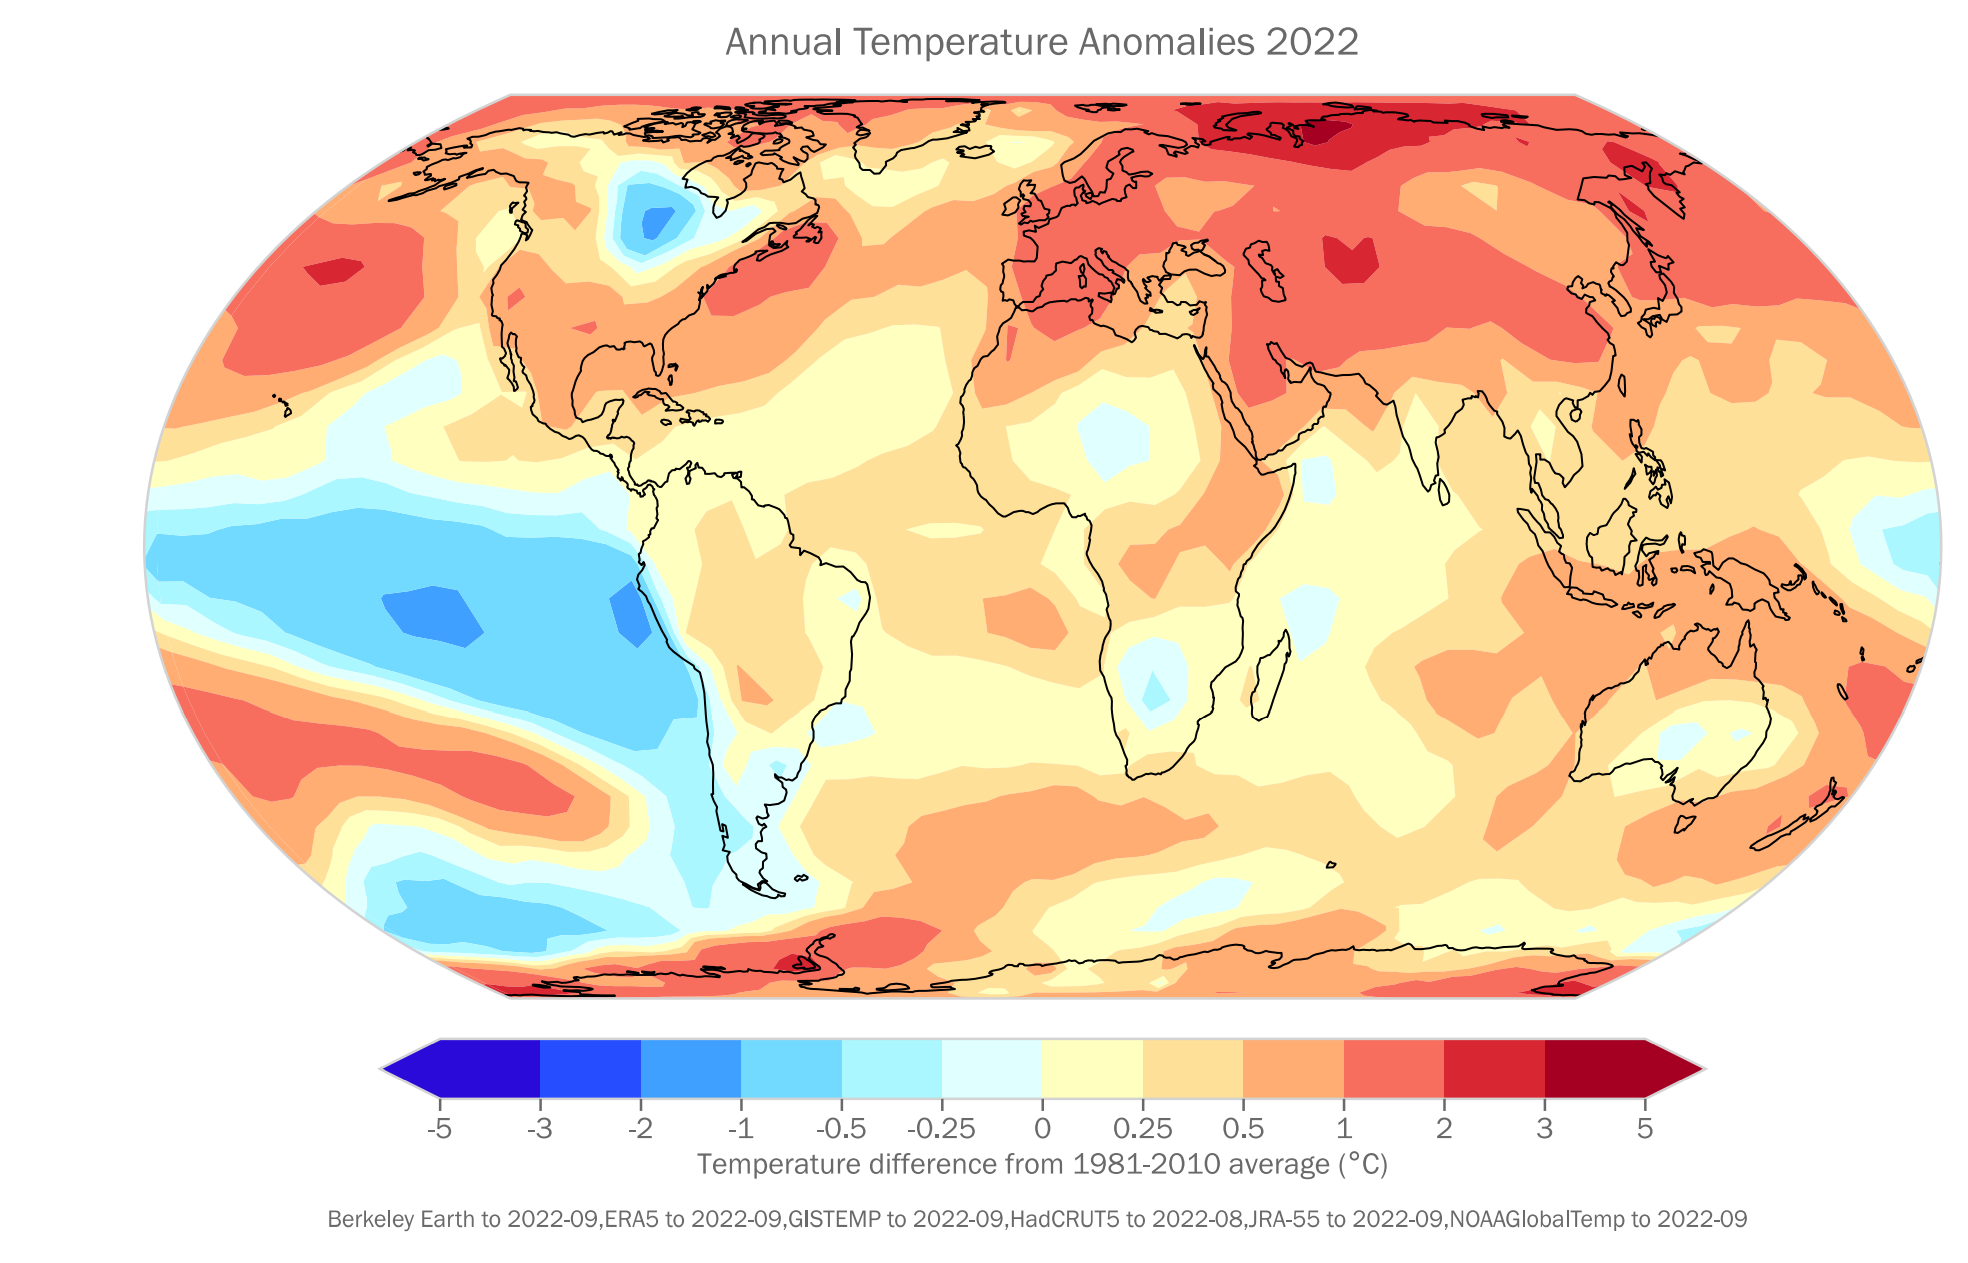
By Seth Borenstein 6 November 2022 SHARM EL-SHEIKH, Egypt (AP) – Earth’s warming weather and rising seas are getting worse and doing so faster than before, the World Meteorological Organization warned Sunday in a somber note as world leaders started gathering for international climate negotiations. [Eight warmest years on record witness upsurge in climate change impacts –Des] […]
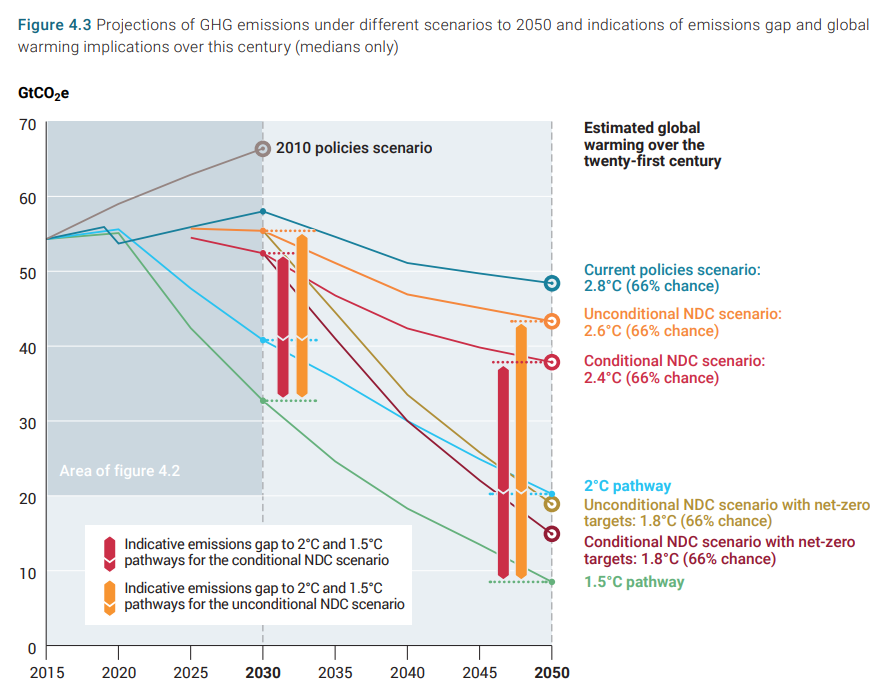
NAIROBI, 27 October 2022 – As intensifying climate impacts across the globe hammer home the message that greenhouse gas emissions must fall rapidly, a new UN Environment Programme (UNEP) report finds that the international community is still falling far short of the Paris goals, with no credible pathway to 1.5°C in place. However, the Emissions Gap Report […]
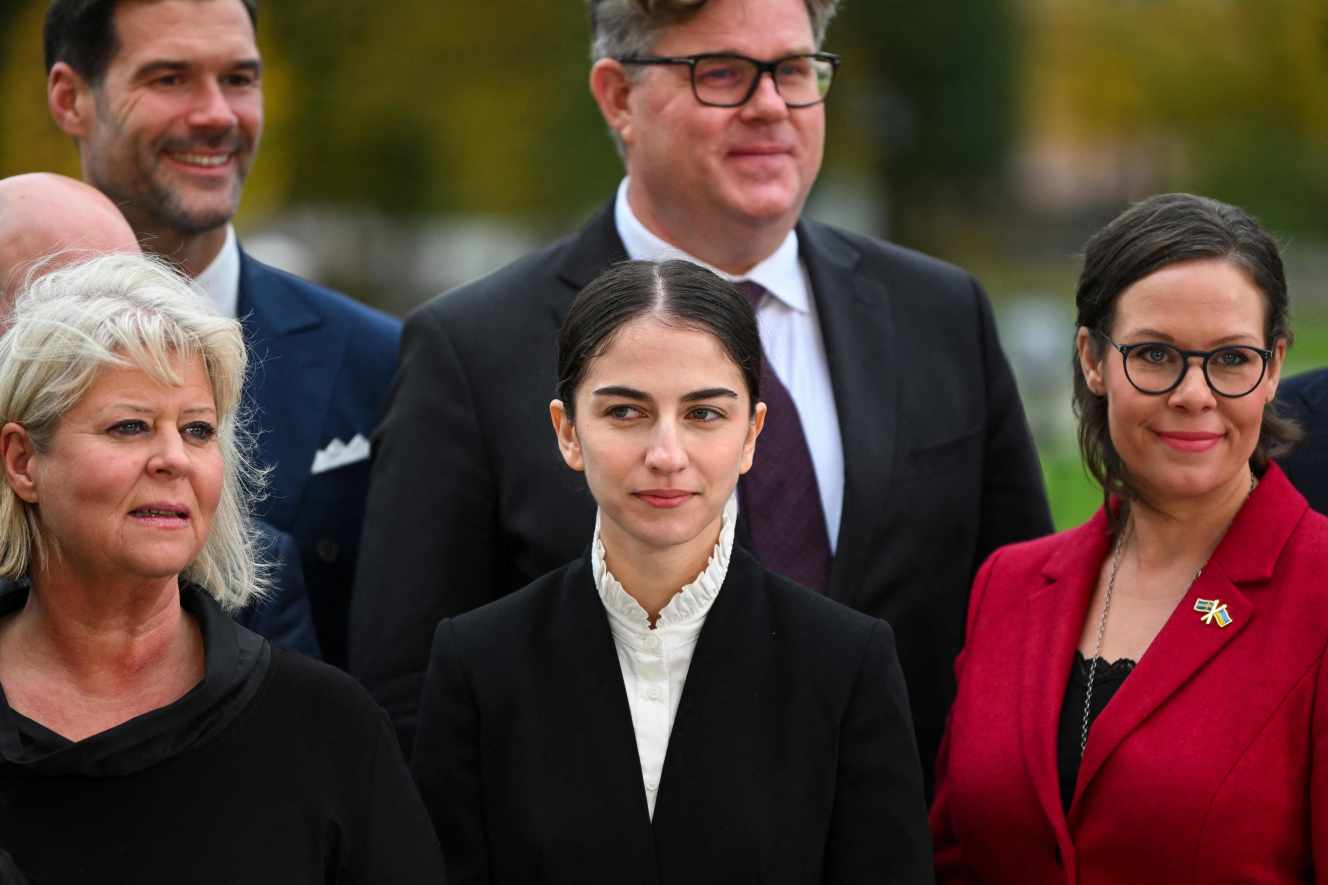
By Anne-Françoise Hivert 22 October 2022 MALMÖ, Sweden (Le Monde) – It is quite a symbol: For the first time since 1987, Sweden has no proper Environment Ministry. Romina Pourmokhtari, 26, the youngest member of the government presented by the conservative Ulf Kristersson on Tuesday, October 18, has been appointed minister for climate and the […]