COVID-19 crisis causes 17 percent drop in global carbon emissions – “The drop in emissions is substantial but illustrates the challenge of reaching our Paris climate commitments”
19 May 2020 (UEA) – The COVID-19 global lockdown has had an “extreme” effect on daily carbon emissions, but it is unlikely to last – according to a new analysis by an international team of scientists.
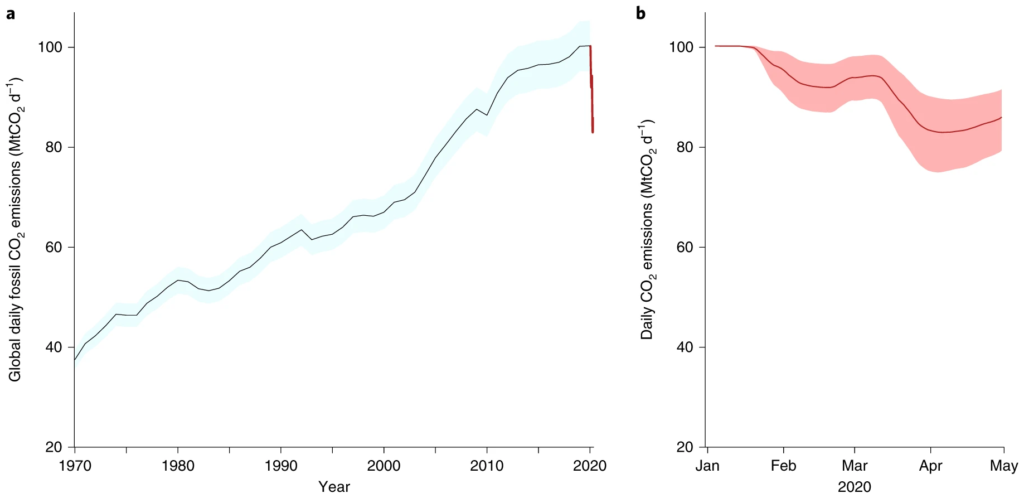
The study published in the journal Nature Climate Change shows that daily emissions decreased by 17% – or 17 million tonnes of carbon dioxide – globally during the peak of the confinement measures in early April compared to mean daily levels in 2019, dropping to levels last observed in 2006.
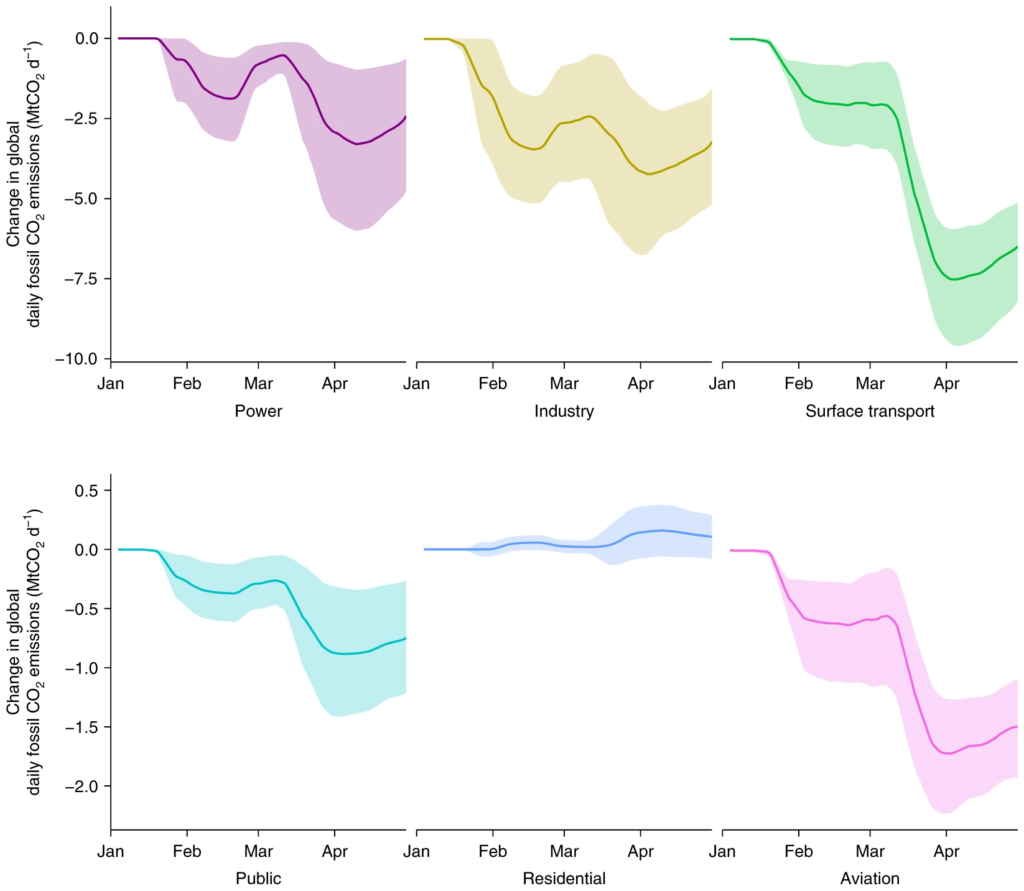
Emissions from surface transport, such as car journeys, account for almost half (43%) of the decrease in global emissions during peak confinement on April 7. Emissions from industry and from power together account for a further 43% of the decrease in daily global emissions.
Aviation is the economic sector most impacted by the lockdown, but it only accounts for 3% of global emissions, or 10% of the decrease in emissions during the pandemic.
The increase in the use of residential buildings from people working at home only marginally offset the drop in emissions from other sectors.
In individual countries, emissions decreased by 26% on average at the peak of their confinement.
The analysis also shows that social responses alone, without increases in wellbeing and/or supporting infrastructure, will not drive the deep and sustained reductions needed to reach net zero emissions.
Prof Corinne Le Quéré of the University of East Anglia led the analysis. She said: “Population confinement has led to drastic changes in energy use and CO2 emissions. These extreme decreases are likely to be temporary though, as they do not reflect structural changes in the economic, transport, or energy systems.
“The extent to which world leaders consider climate change when planning their economic responses post COVID-19 will influence the global CO2 emissions paths for decades to come.
“Opportunities exist to make real, durable, changes and be more resilient to future crises, by implementing economic stimulus packages that also help meet climate targets, especially for mobility, which accounts for half the decrease in emissions during confinement.
“For example in cities and suburbs, supporting walking and cycling, and the uptake of electric bikes, is far cheaper and better for wellbeing and air quality than building roads, and it preserves social distancing.”
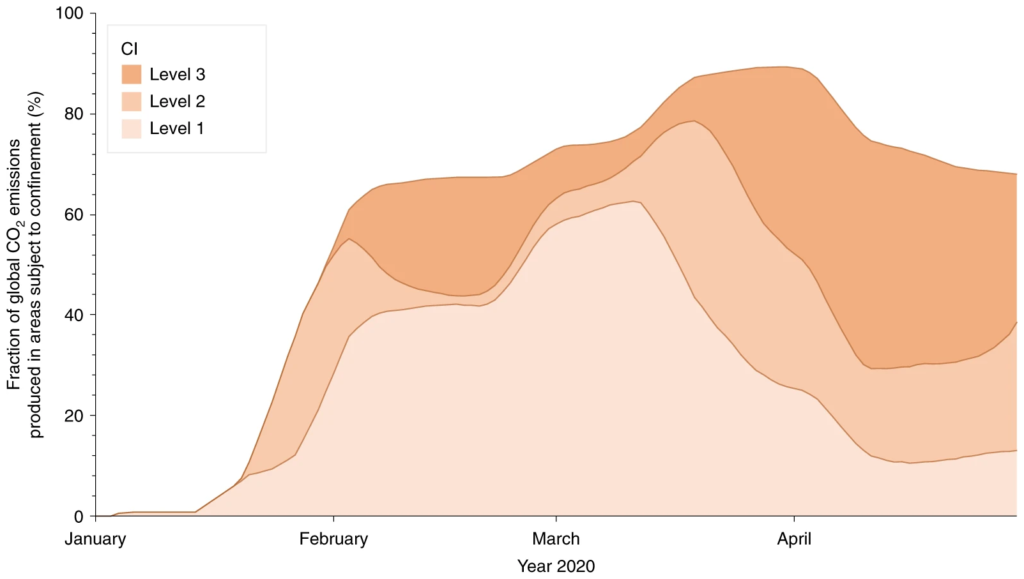
The team analysed government policies on confinement for 69 countries responsible for 97% of global CO2 emissions. At the peak of the confinement, regions responsible for 89% of global CO2 emissions were under some level of restriction. Data on activities indicative of how much each economic sector was affected by the pandemic was then used to estimate the change in fossil CO2 emissions for each day and country from January to April 2020.
The estimated total change in emissions from the pandemic amounts to 1048 million tonnes of carbon dioxide (MtCO2) until the end of April. Of this, the changes are largest in China where the confinement started, with a decrease of 242 MtCO2, then in the US (207 MtCO2), Europe (123 MtCO2), and India (98 MtCO2). The total change in the UK for January-April 2020 is an estimated 18 MtCO2.
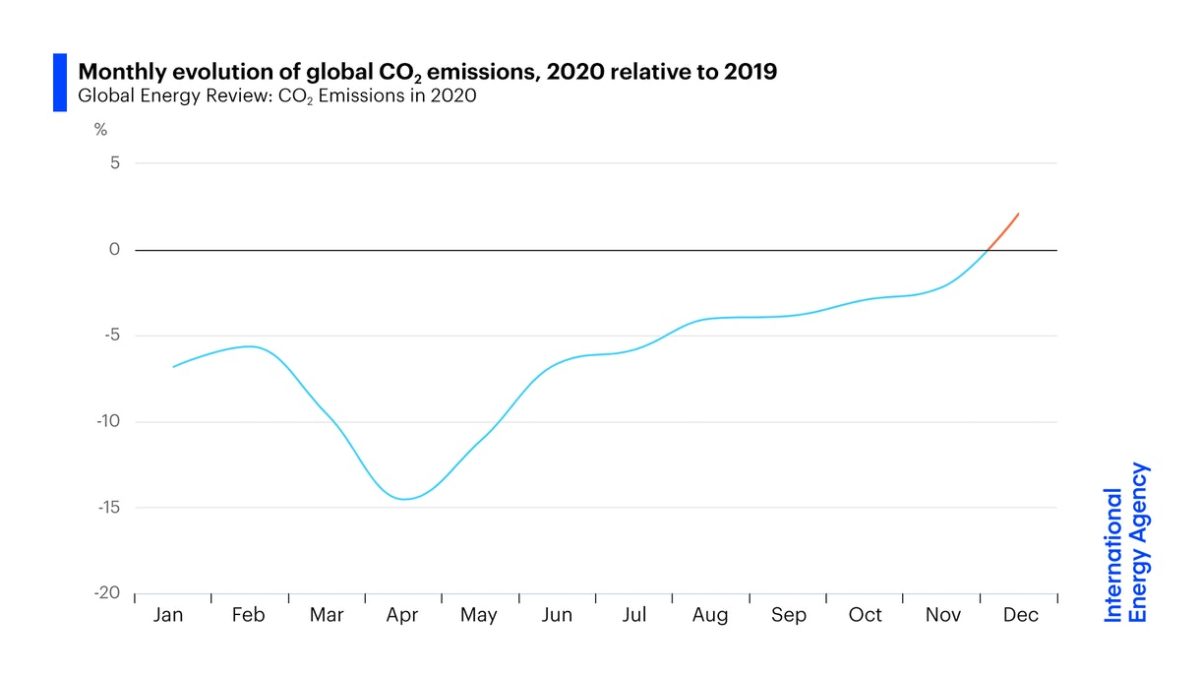
The impact of confinement on 2020 annual emissions is projected to be around 4% to 7% compared to 2019, depending on the duration of the lockdown and the extent of the recovery. If pre-pandemic conditions of mobility and economic activity return by mid-June, the decline would be around 4%. If some restrictions remain worldwide until the end of the year, it would be around 7%.
This annual drop is comparable to the amount of annual emission reductions needed year-on-year across decades to achieve the climate objectives of UN Paris Agreement.
Prof Rob Jackson of Stanford University and Chair of the Global Carbon Project who co-authored the analysis, added: “The drop in emissions is substantial but illustrates the challenge of reaching our Paris climate commitments. We need systemic change through green energy and electric cars, not temporary reductions from enforced behavior.”
The authors warn that the rush for economic stimulus packages must not make future emissions higher by delaying New Green Deals or weakening emissions standards.
‘Temporary reduction in daily global CO2 emissions during the COVID-19 forced confinement’, Corinne Le Quéré, Robert B. Jackson, Matthew W. Jones, Adam J. P. Smith, Sam Abernethy, Robbie M. Andrew, Anthony J. De-Gol, David R. Willis, Yuli Shan, Josep G. Canadell, Pierre Friedlingstein, Felix Creutzig, Glen P. Peters, is published in Nature Climate Change on 19 May 2020.
The research received support from the Royal Society, the European Commission projects 4C, VERIFY and CHE, the Gordon and Betty Moore Foundation, and the Australian National Environmental Science Program.
On Thursday, 11 June 2020, Prof Le Quéré will present on online lecture on her research, what we’ve learned from lockdown, and tackling climate change in a post-coronavirus world. Booking is free and open now.
COVID-19 crisis causes 17% drop in global carbon emissions
Temporary reduction in daily global CO2 emissions during the COVID-19 forced confinement
ABSTRACT: Government policies during the COVID-19 pandemic have drastically altered patterns of energy demand around the world. Many international borders were closed and populations were confined to their homes, which reduced transport and changed consumption patterns. Here we compile government policies and activity data to estimate the decrease in CO2 emissions during forced confinements. Daily global CO2 emissions decreased by –17% (–11 to –25% for ±1σ) by early April 2020 compared with the mean 2019 levels, just under half from changes in surface transport. At their peak, emissions in individual countries decreased by –26% on average. The impact on 2020 annual emissions depends on the duration of the confinement, with a low estimate of –4% (–2 to –7%) if prepandemic conditions return by mid-June, and a high estimate of –7% (–3 to –13%) if some restrictions remain worldwide until the end of 2020. Government actions and economic incentives postcrisis will likely influence the global CO2 emissions path for decades.
Temporary reduction in daily global CO2 emissions during the COVID-19 forced confinement