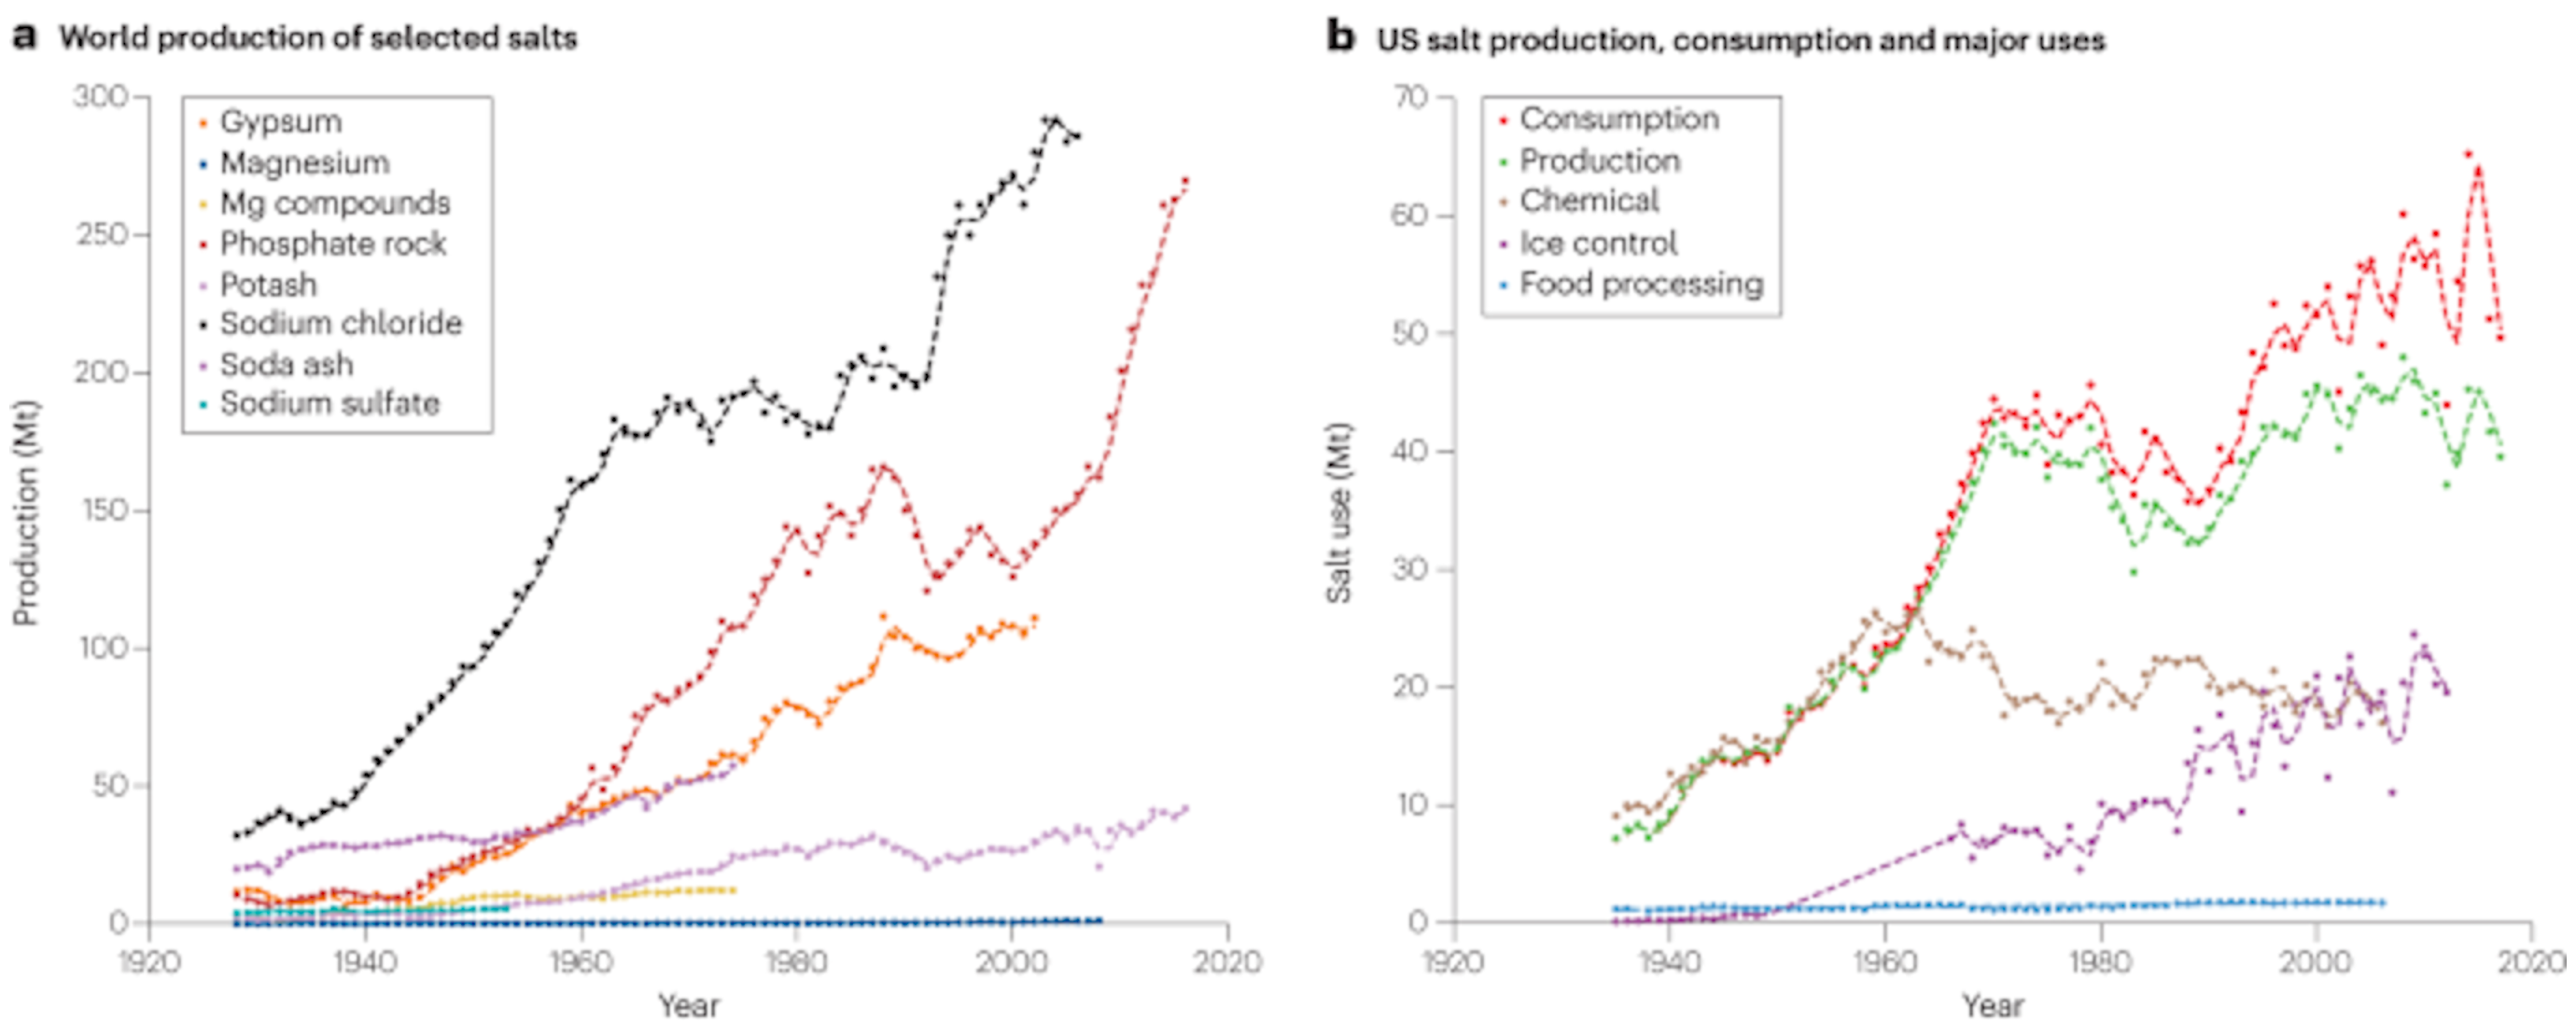
31 October 2023 (University of Maryland) – The influx of salt in streams and rivers is an ‘existential threat,’ according to a research team led by a UMD geologist. The planet’s demand for salt comes at a cost to the environment and human health, according to a new scientific review led by University of Maryland Geology Professor Sujay Kaushal. Published […]
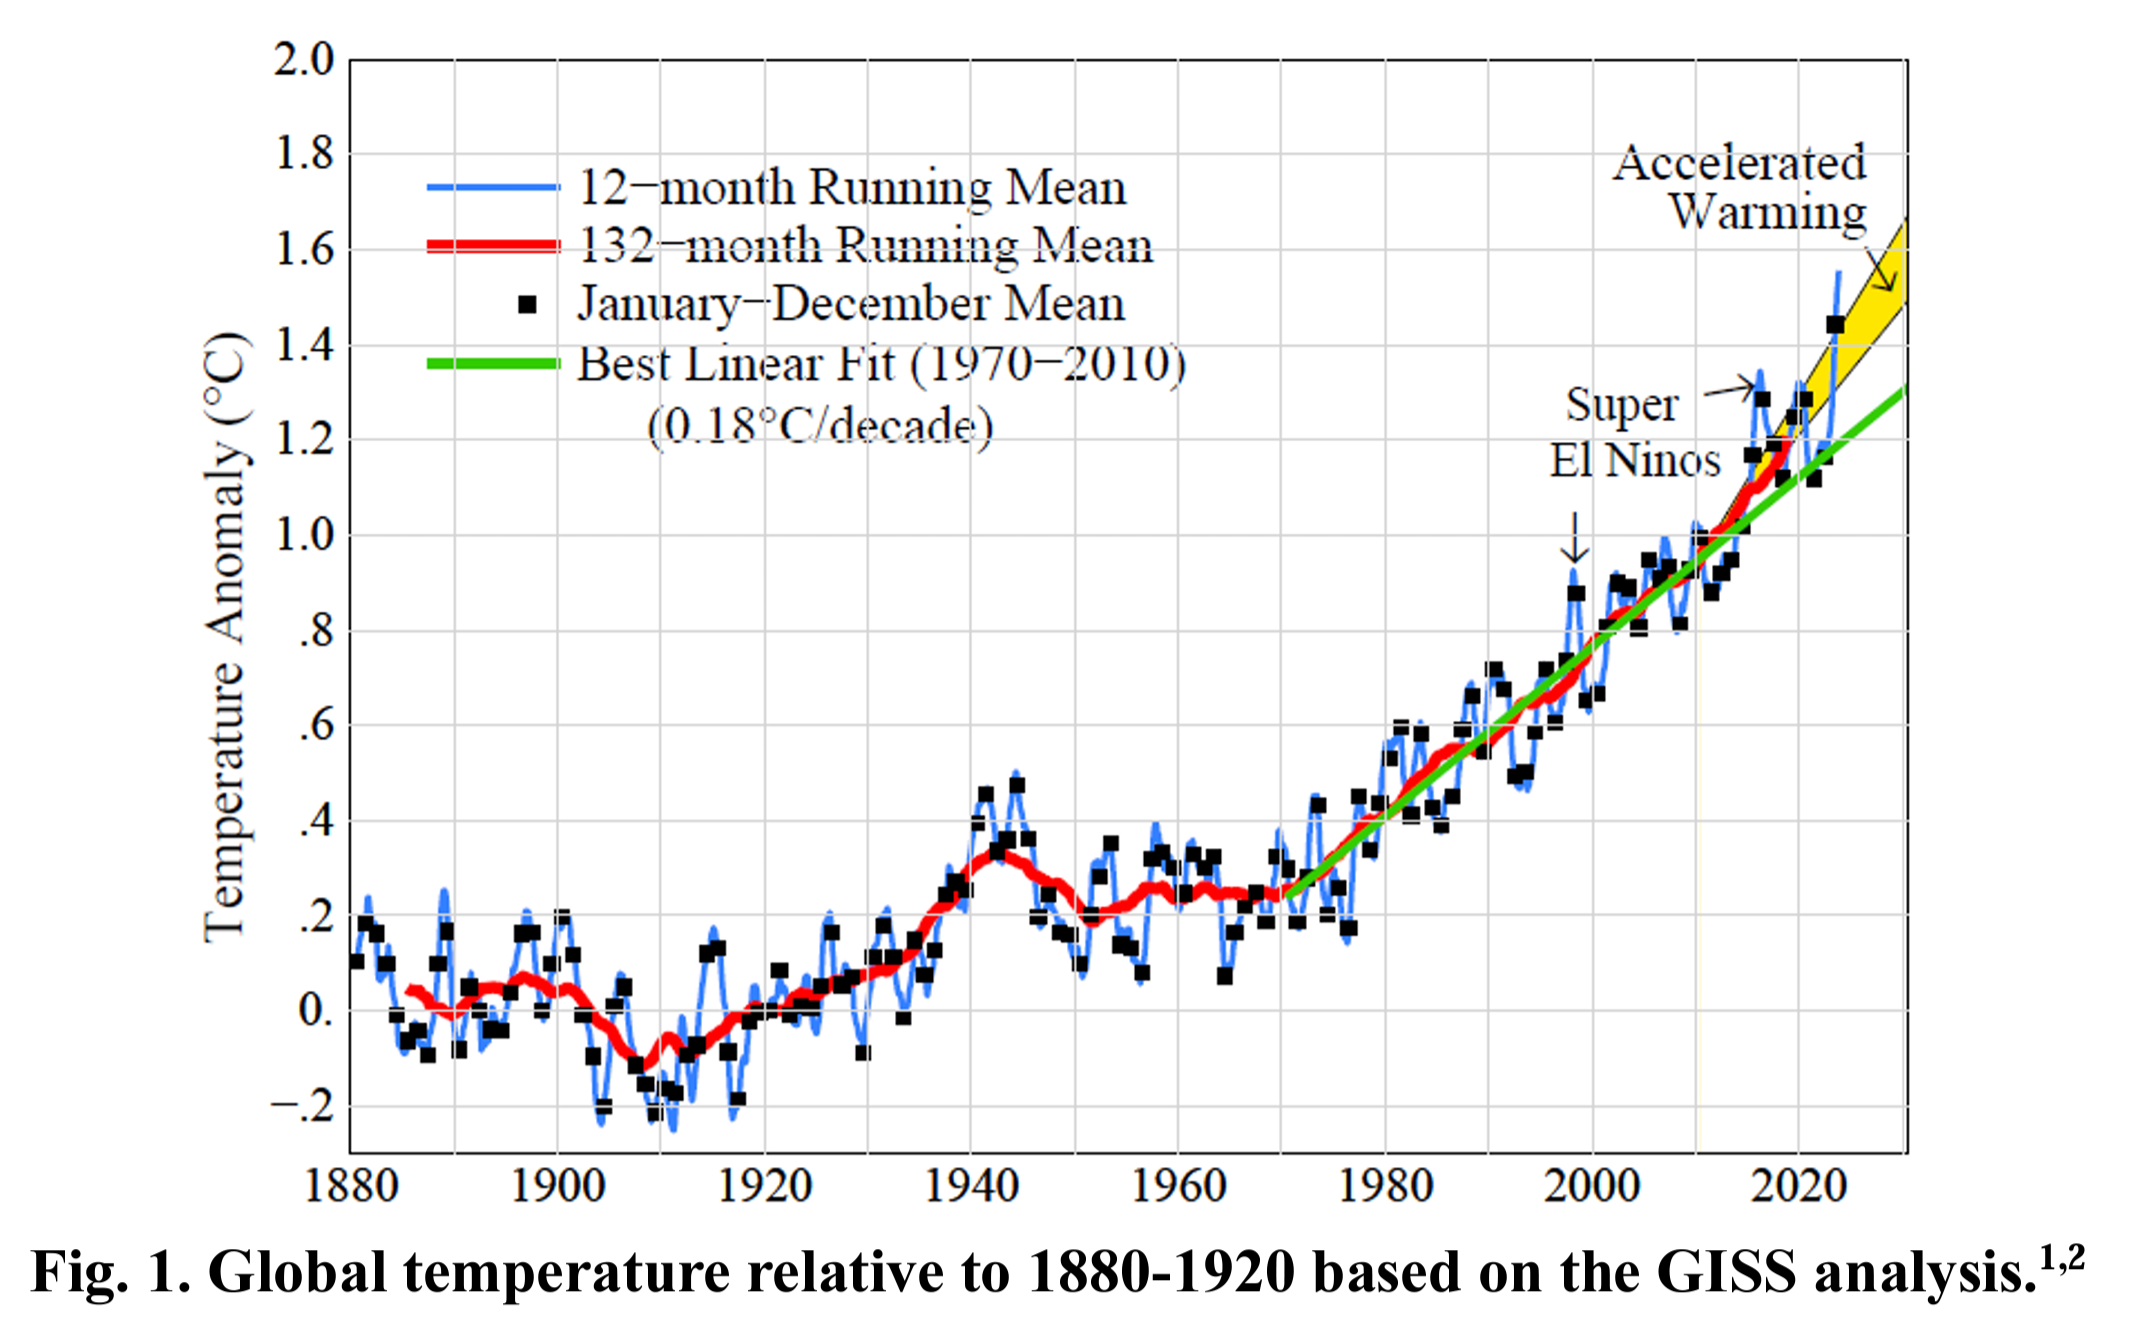
By James Hansen, Pushker Kharecha, and Makiko Sato 16 May 2024 (Columbia University) – Global temperature (12-month mean) is still rising at 1.56°C relative to 1880-1920 in the GISS analysis through April (Fig. 1). [Robert Rohde reports that it is 1.65°C relative to 1850-1900 in the BerkeleyEarth analysis.] Global temperature is likely to continue to […]
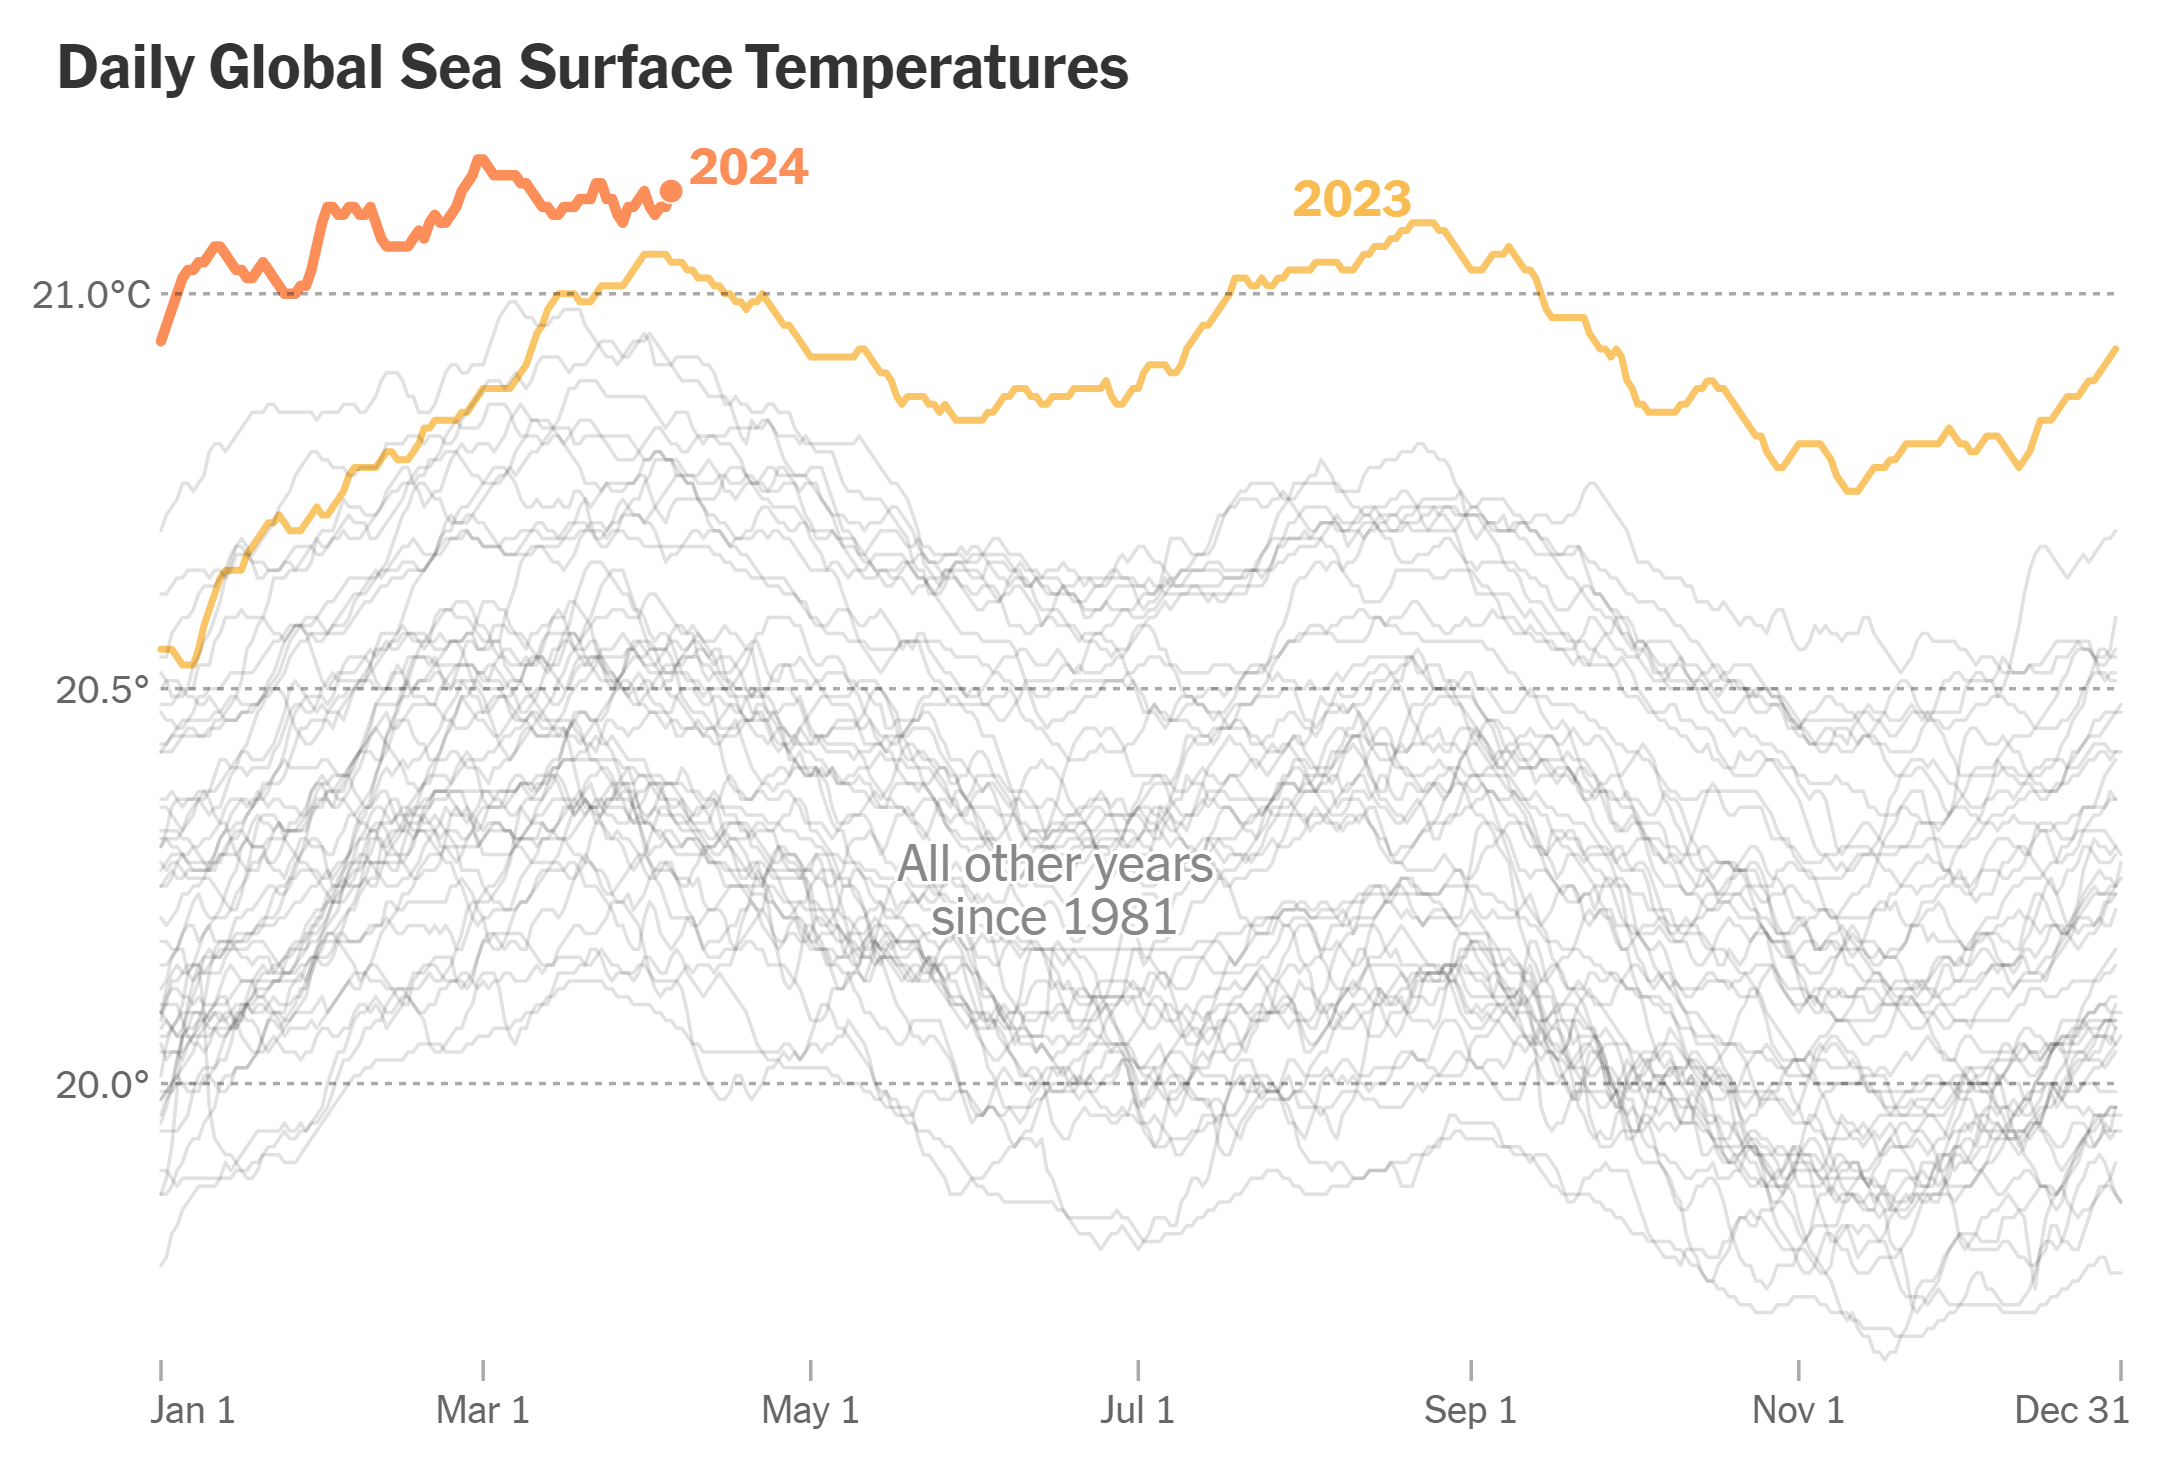
By Delger Erdenesanaa 10 April 2024 (The New York Times) – The ocean has now broken temperature records every day for more than a year. And so far, 2024 has continued 2023’s trend of beating previous records by wide margins. In fact, the whole planet has been hot for months, according to many different data […]
By James Hansen, Makiko Sato, and Pushker Kharecha 29 March 2024 (Columbia University) – Accumulating evidence supports the interpretation in our Pipeline paper: decreasing human-made aerosols increased Earth’s energy imbalance and accelerated global warming in the past decade. Climate sensitivity and aerosol forcing, physically independent quantities, were tied together by United Nations IPCC climate assessments that rely […]
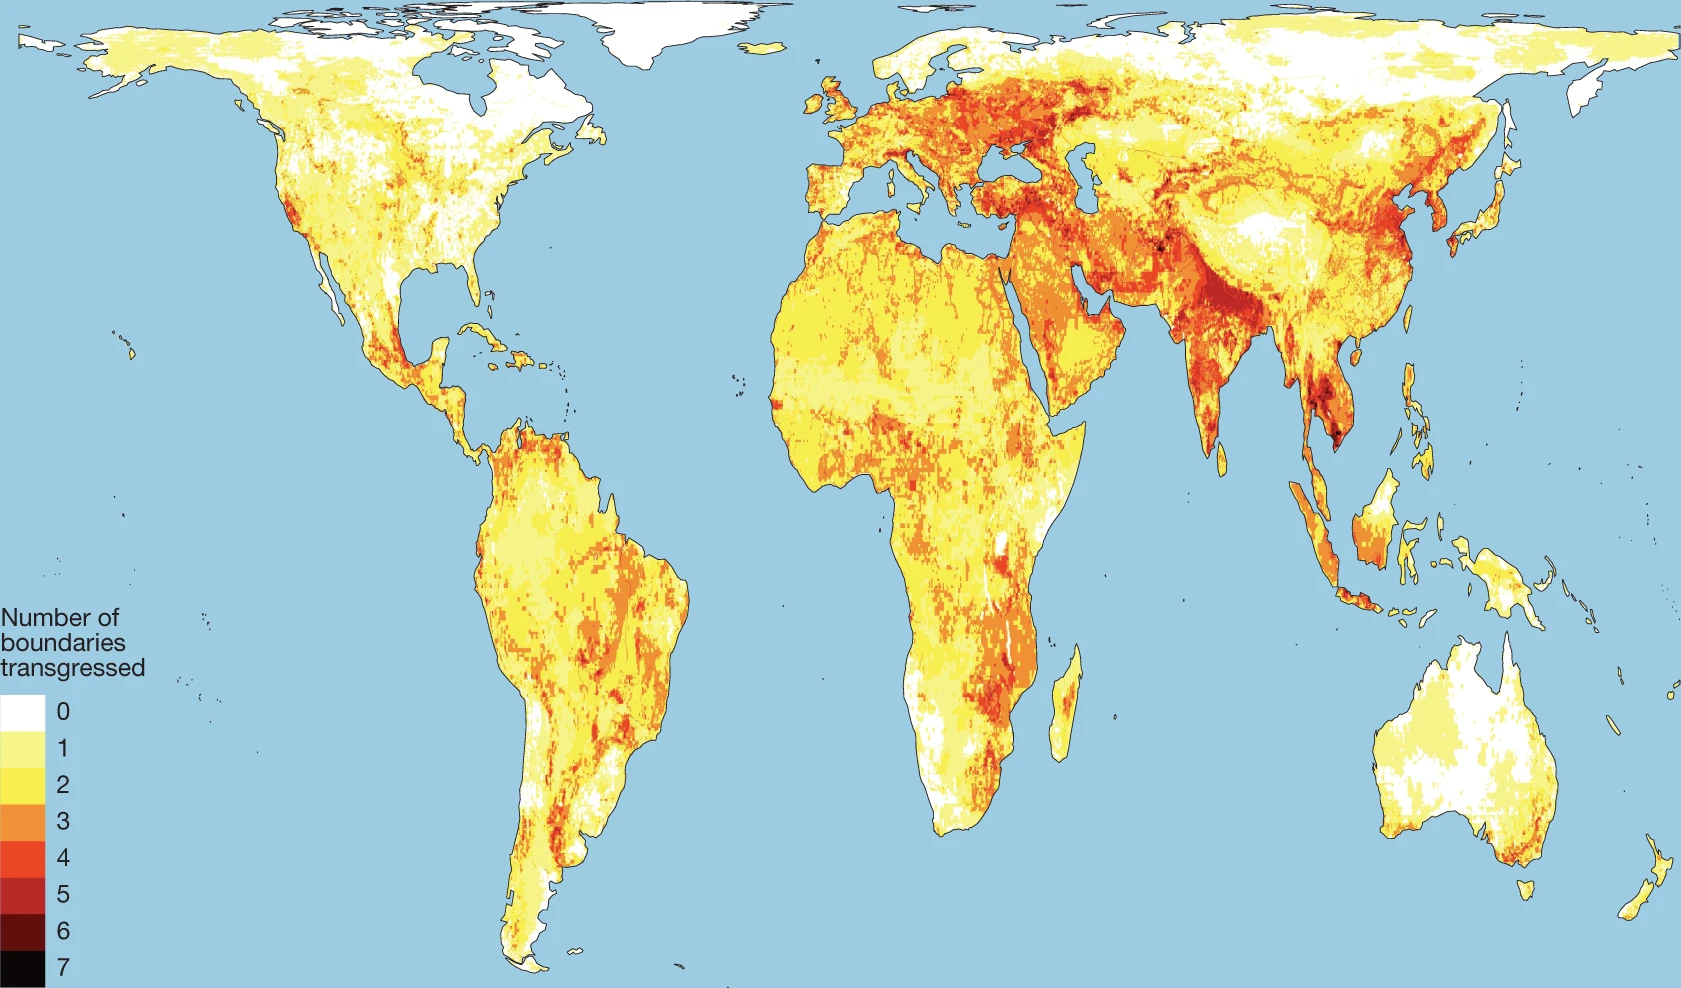
By Seth Borenstein 31 May 2023 (AP News) – Earth has pushed past seven out of eight scientifically established safety limits and into “the danger zone,” not just for an overheating planet that’s losing its natural areas, but for the well-being of people living on it, according to a new study. The study looks not just […]
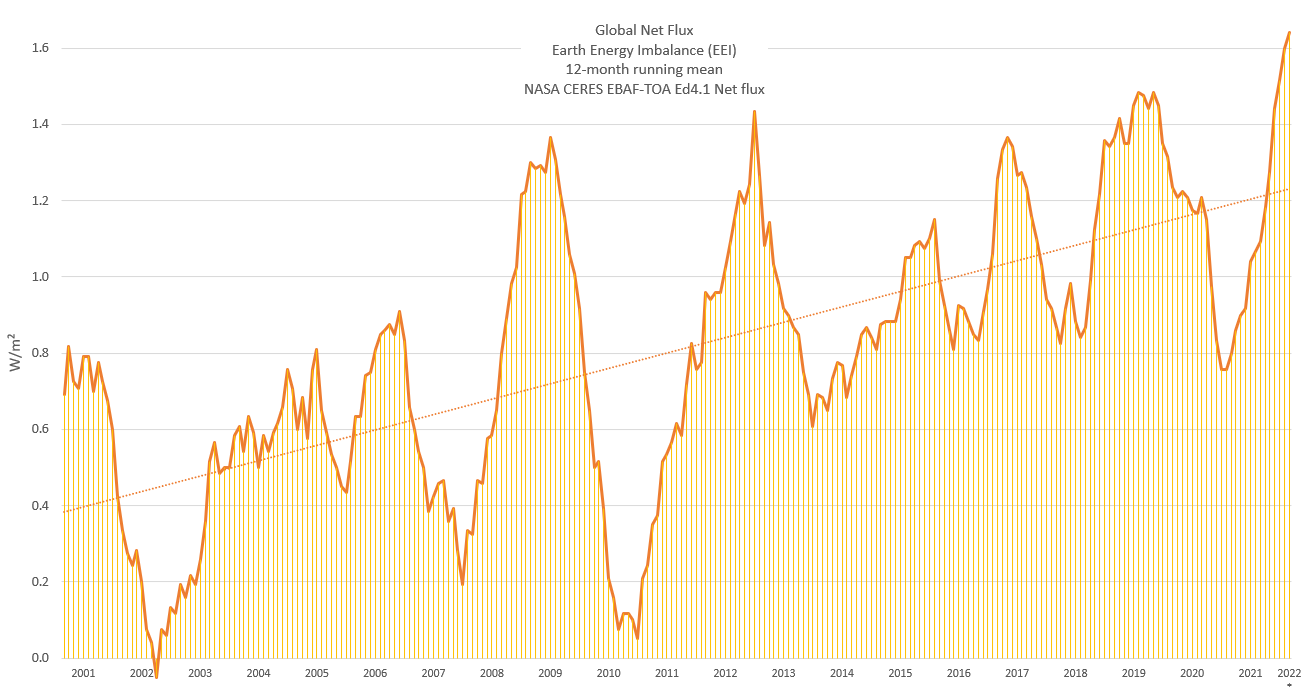
By Leon Simons 5 May 2022 (Twitter) – NASA data shows our Earth is heating at unprecedented speed: 1.64 W/m2. CERES radiative flux data for 2021 has come available. The annual Earth’s Energy Imbalance was +1.52 W/m2, the energy equivalent to 1 million Hiroshima sized atomic bombs every day. Another 12-month EEI record (from Mar […]
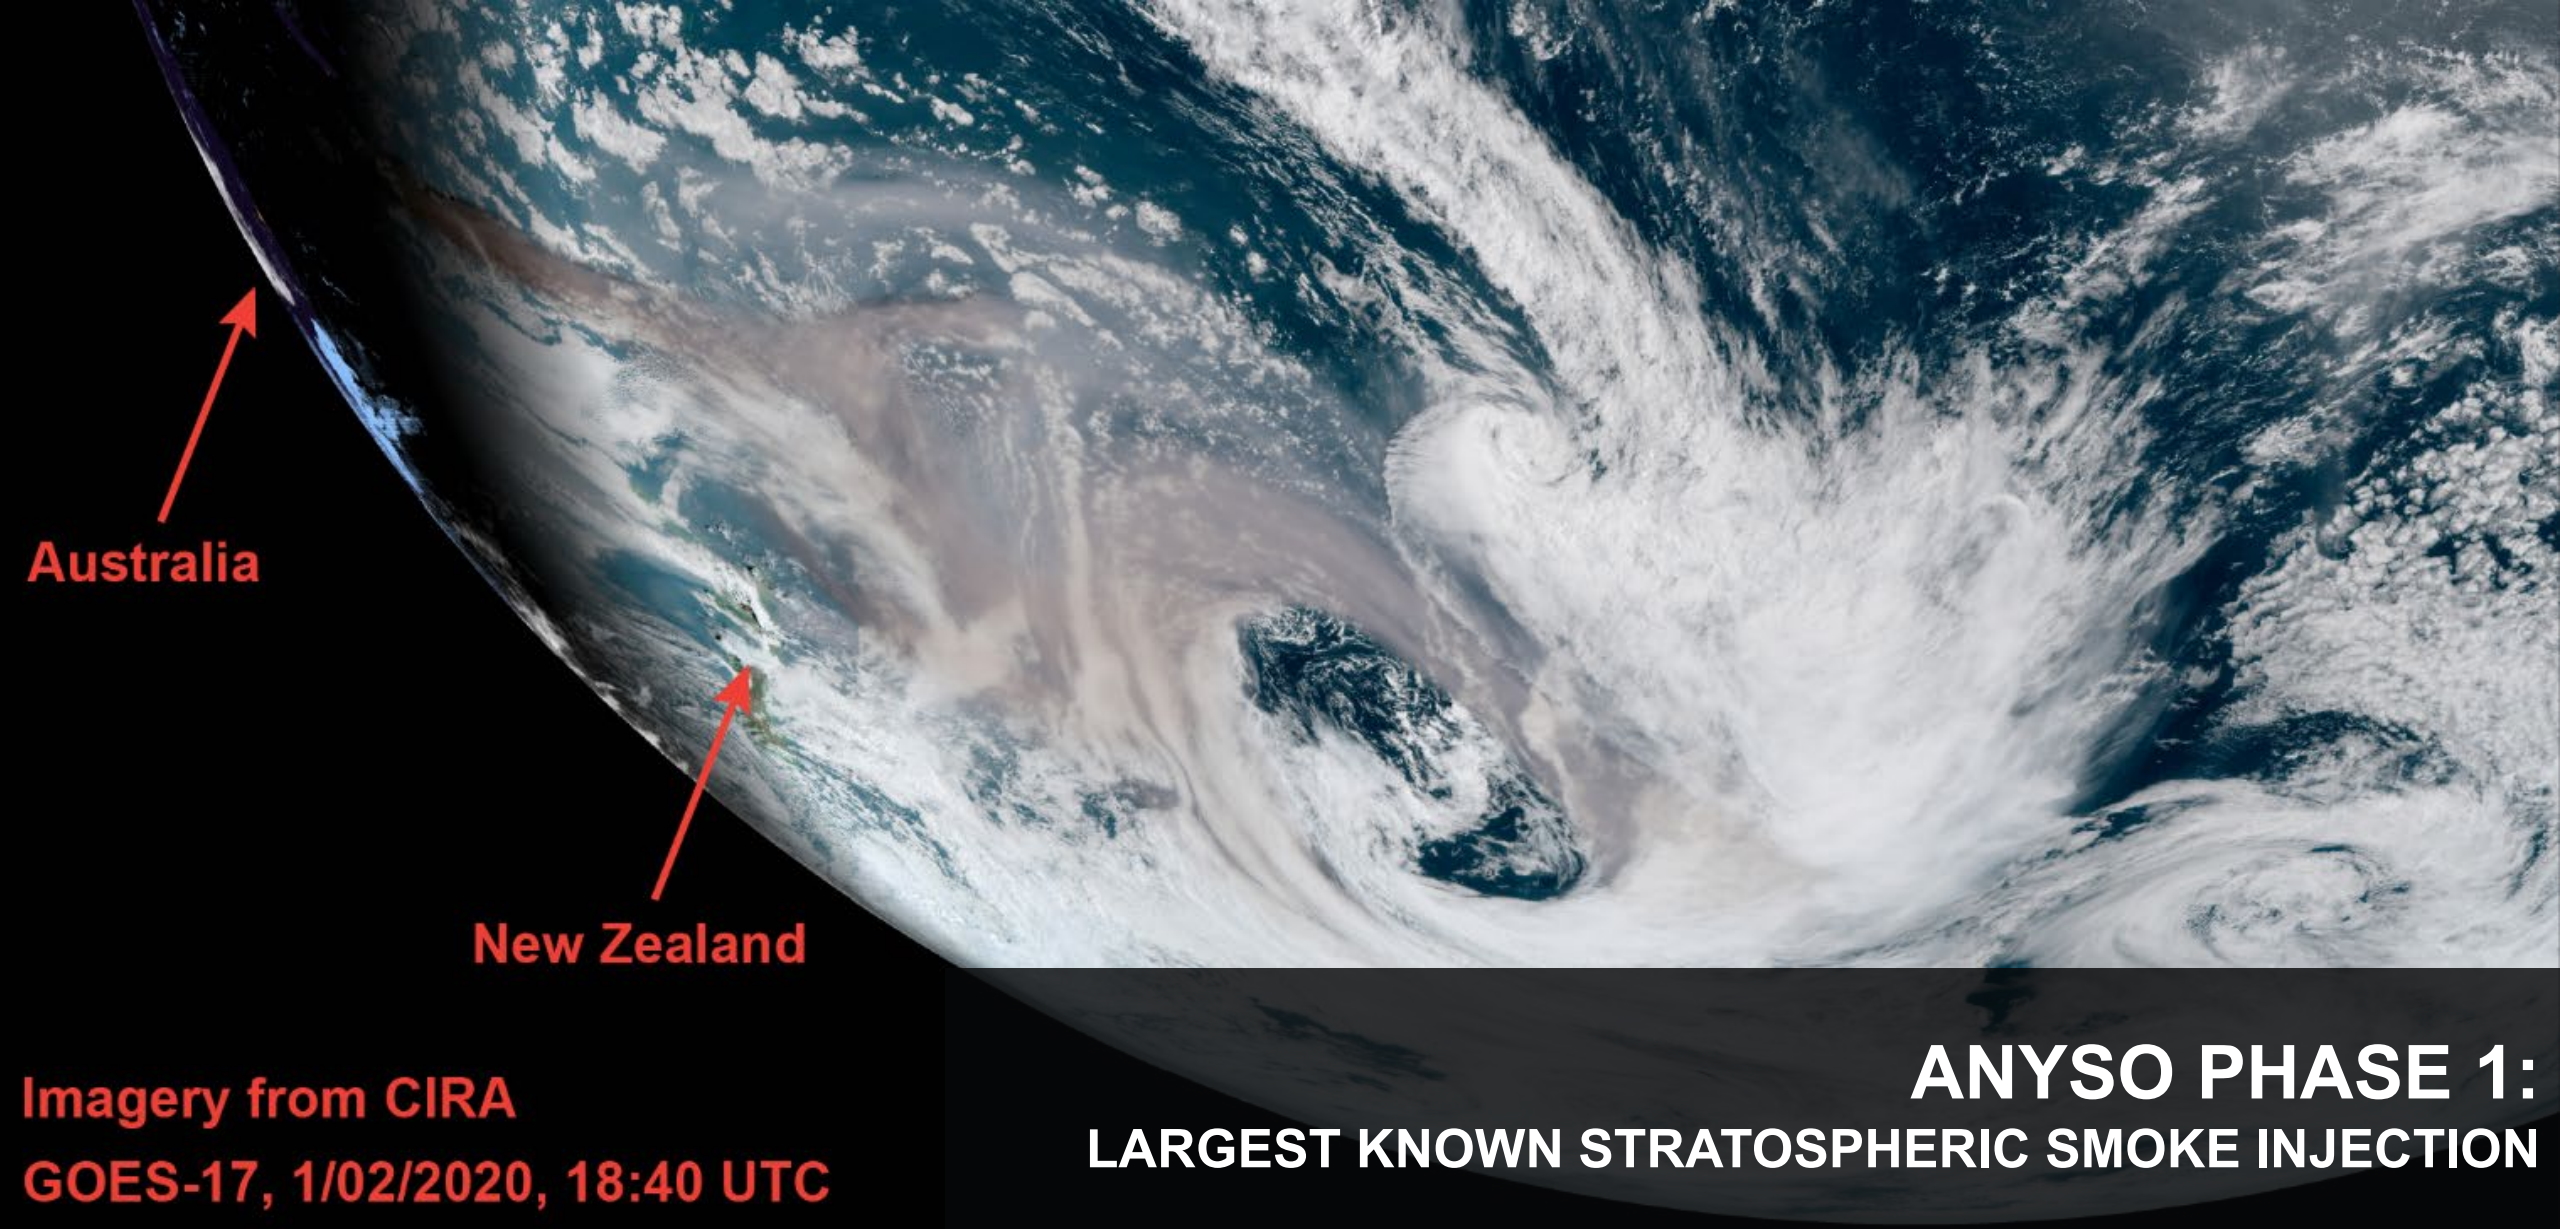
By Carolyn Gramling 15 December 2020 (Science News) – A massive tower of smoke generated by Australian wildfires in late 2019 set a new record for the loftiest and largest fire-spawned thunderstorms ever measured. It also may represent a new class of volcanic-scale “pyrocumulonimbus” events, scientists said in an online news conference 11 December 2020 at […]
By Matthew Cappucci 12 September 2020 (The Washington Post) – More than 3.1 million acres have burned in California this year, part of a record fire season that still has four months to go. A suffocating cloud of smoke has veiled the West Coast for days, extending more than a thousand miles above the Pacific. And the […]
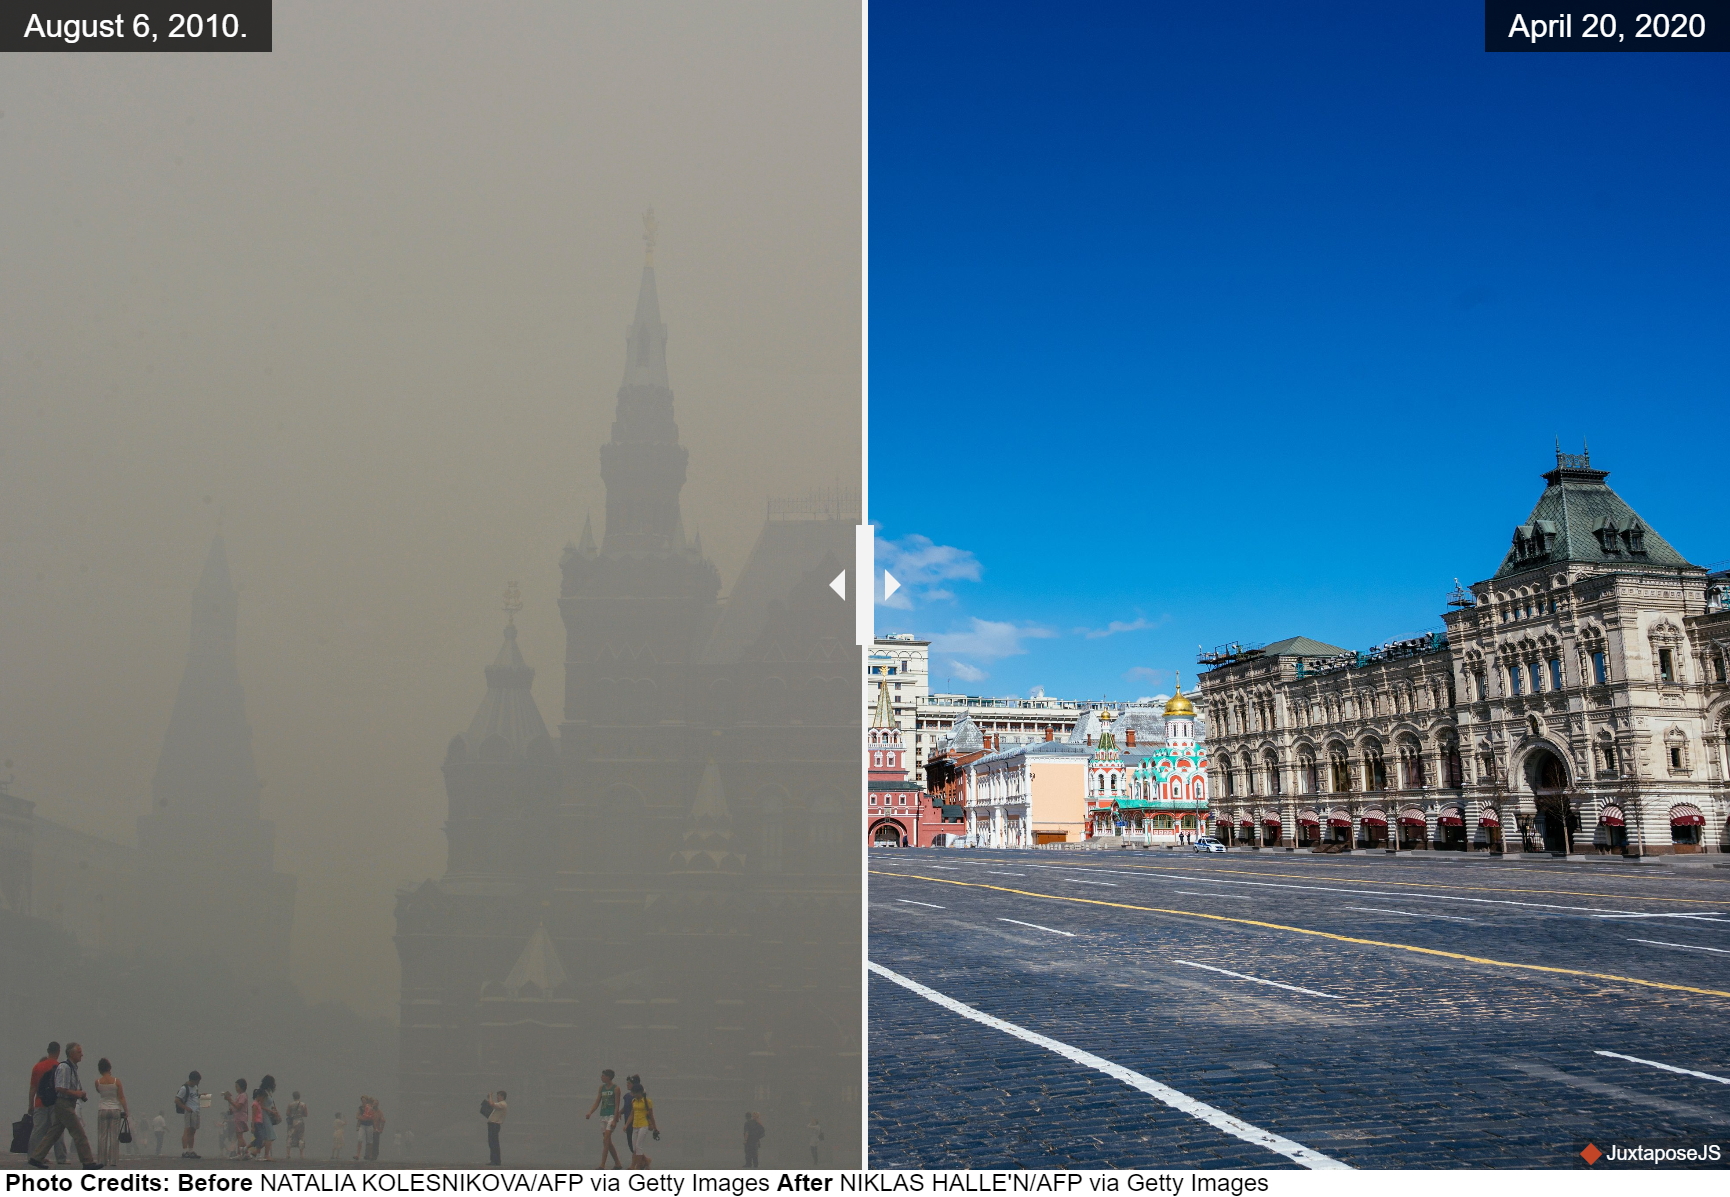
By Sophie Lewis 22 April 2020 (CBS News) – As humans continue to stay indoors under lockdown due to the coronavirus pandemic, the Earth is slowly healing. Wild animals have taken to roaming the streets, clear waters have returned to the Venice canals and the world is literally shaking less. With billions of people quarantined and businesses closed, travel has all but […]
14 January 2020 (BBC News) – Smoke from the massive bushfires in Australia will soon circle the Earth back to the nation, says NASA. Massive infernos have raged along the nation’s east coast for months, pushing smoke across the Pacific. NASA said plumes from blazes around New Year’s Day had crossed South America, turning skies […]