Global warming acceleration: hope vs. hopium – “The increase is not due to a brightening Sun, it is due to a darkening Earth”
By James Hansen, Makiko Sato, and Pushker Kharecha
29 March 2024
(Columbia University) – Accumulating evidence supports the interpretation in our Pipeline paper: decreasing human-made aerosols increased Earth’s energy imbalance and accelerated global warming in the past decade. Climate sensitivity and aerosol forcing, physically independent quantities, were tied together by United Nations IPCC climate assessments that rely excessively on global climate models (GCMs) and fail to measure climate forcing by aerosols. IPCC’s best estimates for climate sensitivity and aerosol forcing both understate reality. Preservation of global shorelines and global climate patterns – the world humanity is adapted to – likely will require at least partly reversing global warming. Required actions and time scale are undefined. A bright future for today’s young people is still possible, but its attainment is hampered by precatory (wishful thinking) policies that do not realistically account for global energy needs and aspirations of nations with emerging economies. An alternative is needed to the GCM-dominated perspective on climate science. We will bear a heavy burden if we stand silent or meek as the world continues on its present course.
Our paper, “Global Warming in the Pipeline“, was greeted by a few scientists, among the most active in communication with the public, with denial. Our friend Michael Mann, e.g., with a large public following, refused to concede that global warming is accelerating. We mention Mike because we know that he won’t take this notation personally.
Accelerated global warming is the first significant change of global warming rate since 1970. It is important because it confirms the futility of “net zero” hopium that serves as present energy policy and because we are running short of time to avoid passing the point of no return. We will focus on advancing our research now and completing Sophie’s Planet in 2024, so we must limit our interactions this year. We will send out updates every other month for the remainder of this year, as described in a recent note.2 This is the March update.
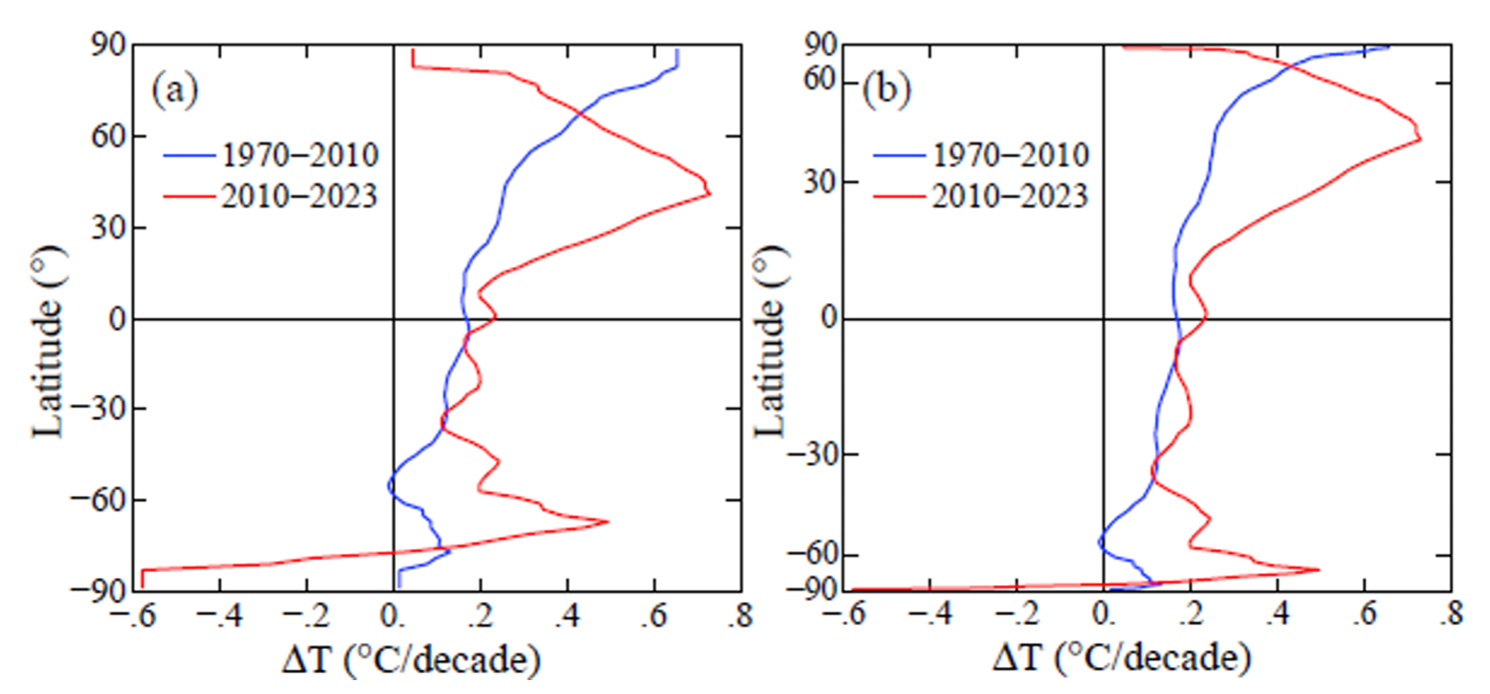
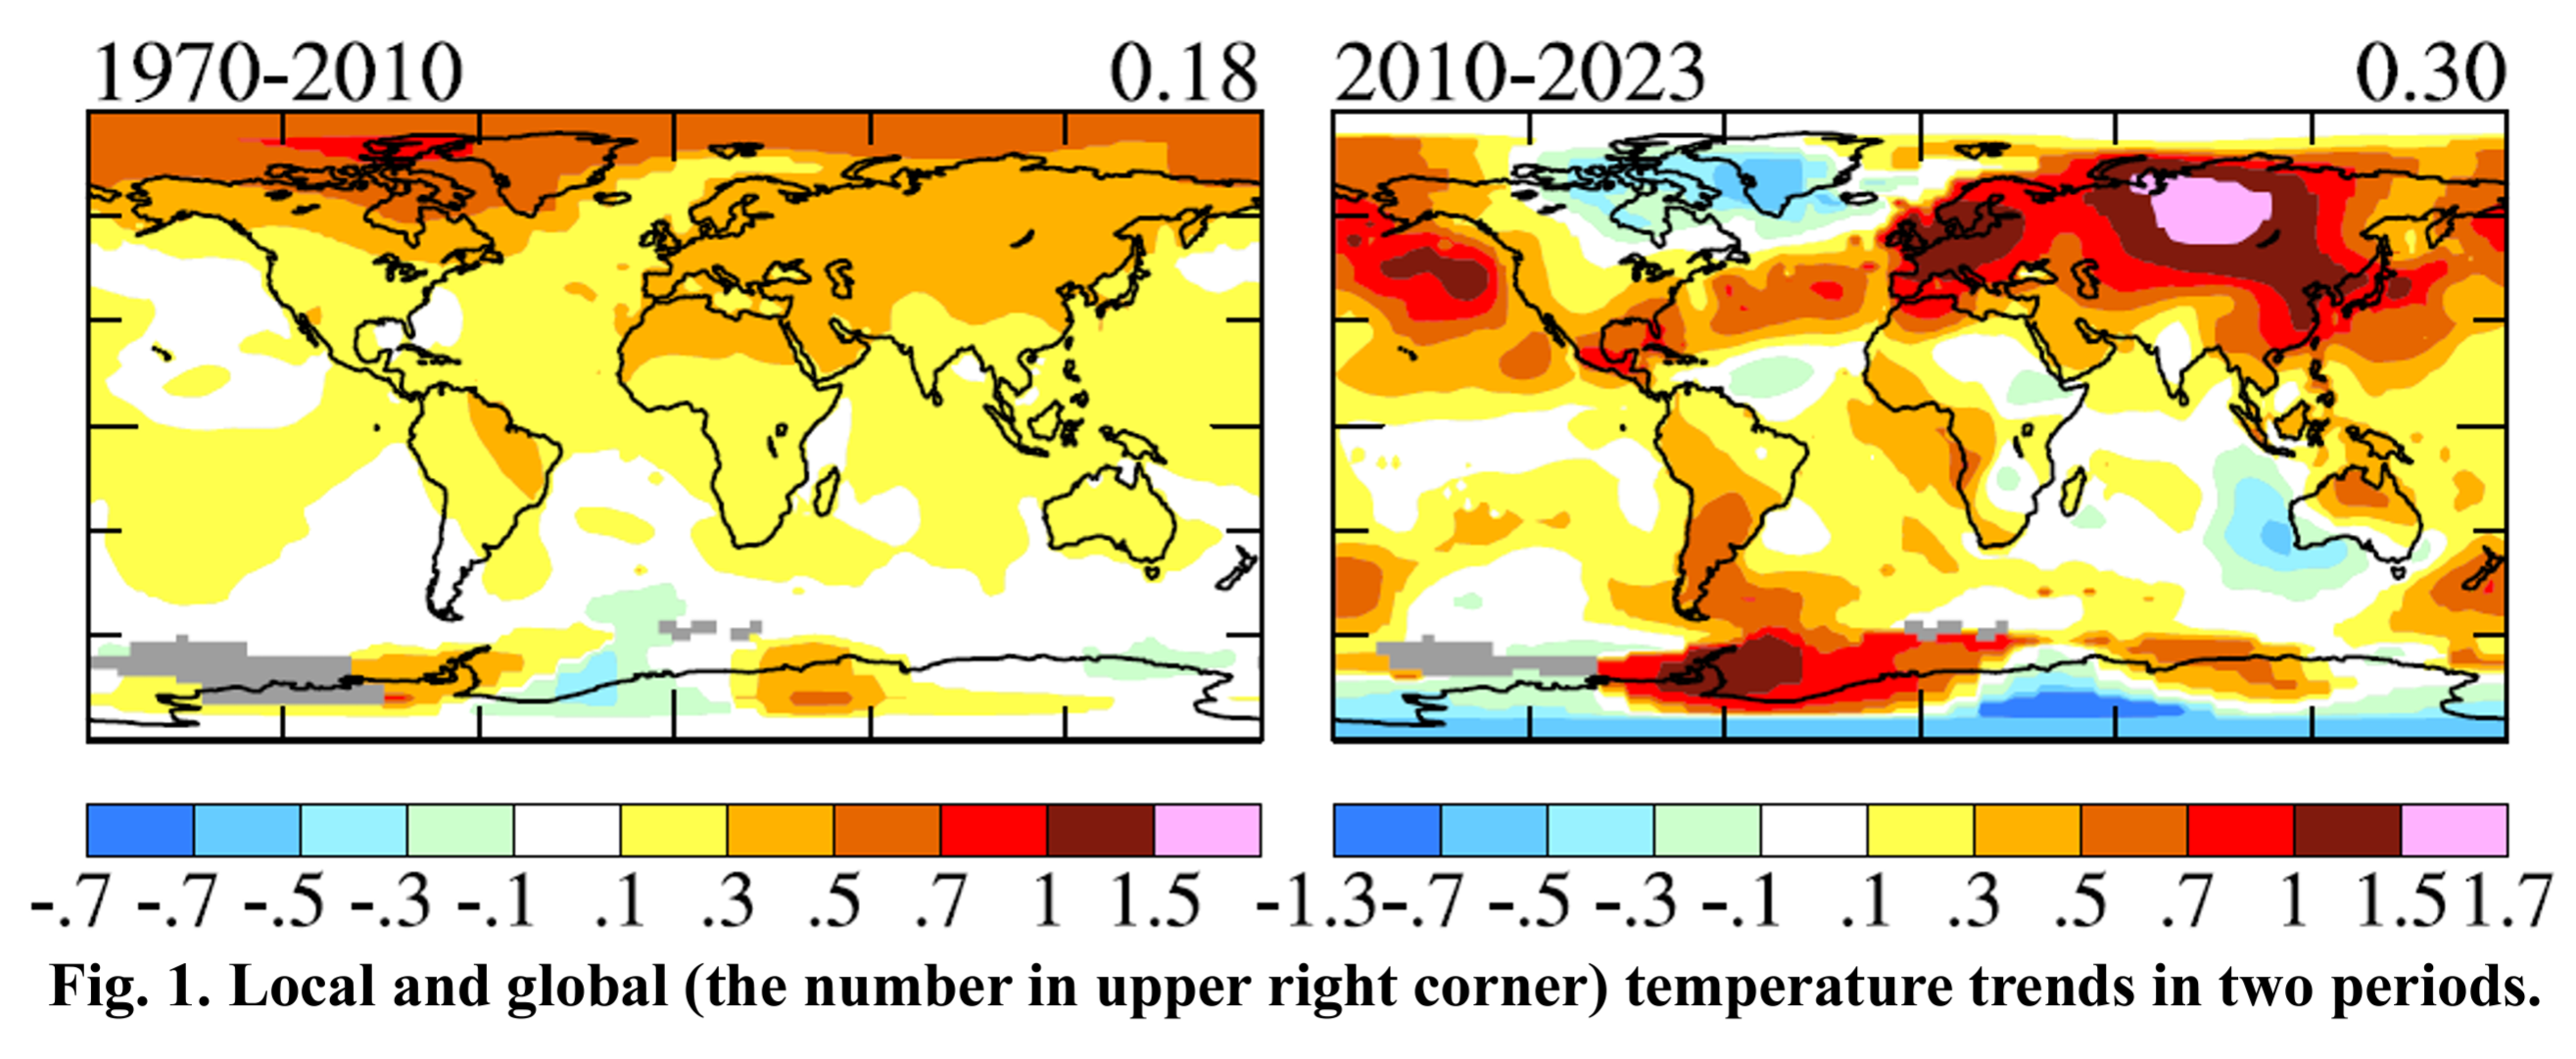
Global warming in 2010-2023 is 0.30°C/decade, 67% faster than 0.18°C/decade in 1970-2010 (Fig. 1). The recent warming is different, peaking at 30-60°N (Fig. 2); for clarity we show the zonal-mean temperature trend both linear in latitude and area-weighted. Such an acceleration of warming does not simply “happen” – it implies an increased climate forcing (imposed change of Earth’s energy balance). Greenhouse gas (GHG) forcing growth has been steady. Solar irradiance has zero trend on decadal time scales. Forcing by volcanic eruptions has been negligible for 30 years, including water vapor from the Honga Tunga eruption.
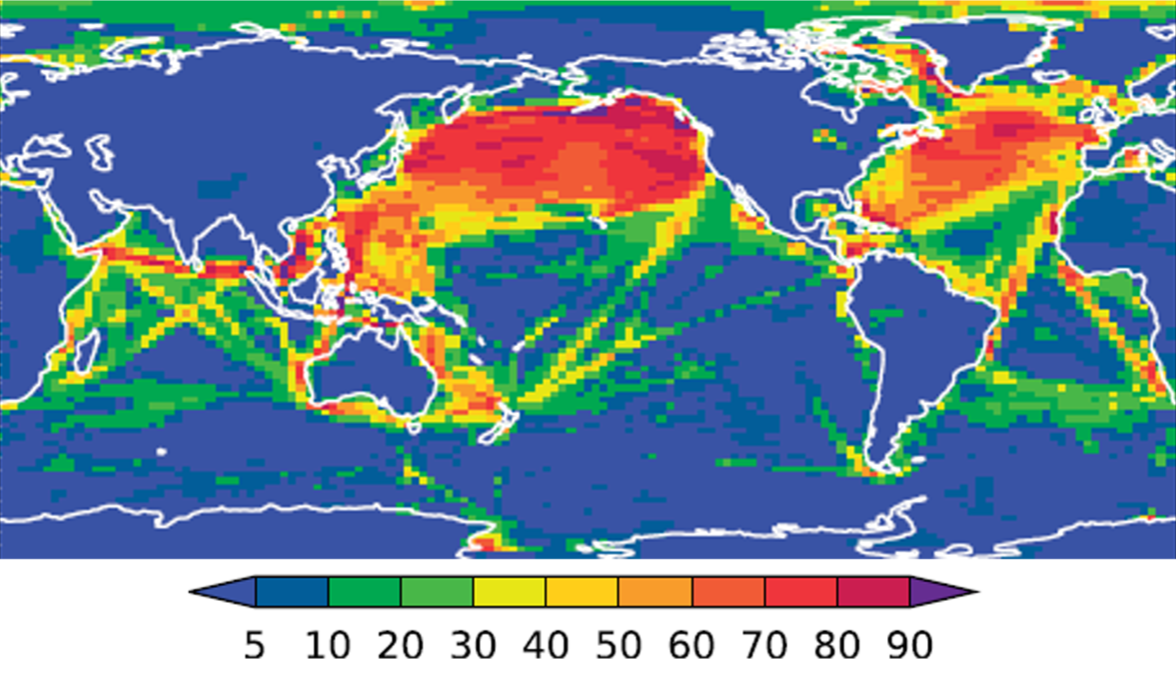
The one potentially significant change of climate forcing is change of human-made aerosols. The large warming over the North Pacific and North Atlantic (Fig. 1) coincides with regions where ship emissions dominate sulfate aerosol production (Fig. 3, from Jin, et al., 2018). Aerosol climate forcing is unmeasured. Inference of aerosol forcing is thus a herculean task because (1) aerosol forcing operates mainly by altering clouds, (2) clouds are also a climate feedback that is poorly quantified, and (3) clouds have large natural variability. Fortunately, an indirect measure of aerosol forcing can be extracted from precise data for changes of Earth’s absorbed solar radiation (ASR) and Earth’s energy imbalance (EEI). Unbroken time series of ASR and EEI are available from March 2000 to the present from CERES (Clouds and Earth’s Radiant Energy System) instruments with calibration via precise measurement of changing ocean heat content over decades; the calibration depends primarily on an improving global network of deep-diving Argo floats. Continuing data for ASR and EEI will be crucial for guiding young people and future generations.
Global absorbed solar radiation (ASR) has increased dramatically since 2010, more than 1.4 W/m2, equivalent to a CO2 increase of more than 100 ppm. The ASR increase is not due to a brightening Sun, it is due to a darkening Earth. Our task is to learn how much of this darkening is climate feedback (due to decreasing ice/snow and cloud albedo, i.e., reflectivity) and how much is climate forcing (due to decreasing aerosols). In note, we use the geographical distribution (global map) of ASR to infer that the forcing due to decreased ship aerosols is at least ~0.5 W/m2. A smaller, additional, forcing is inferred from increased ASR over Europe, which also is likely from reduced aerosols.
Zonal mean ASR (Fig. 4) provides insight. ASR increases strongly since 2020 at latitudes 30-60°N, the region of reduced aerosols we have discussed. In the region where ship aerosols are expected to have a large effect (30-60°N) and in the entire region where ship effects may be significant (30°S-60°N), ASR increases in 2015-2020 and increases more in 2020-2023. The Arctic ASR maxima are associated with sea ice minima in 2007, 2012, 2015-16 and 2020, while the double maximum near Antarctica is caused by increasing polynya (open water) near the Antarctic coast and decreasing ice cover at the northern boundary of Southern Ocean sea ice. The region 30°S-60°S is unlikely to have much ship aerosol effect (Fig. 3), so change of ASR there is more likely due to cloud feedback and unforced cloud variability.
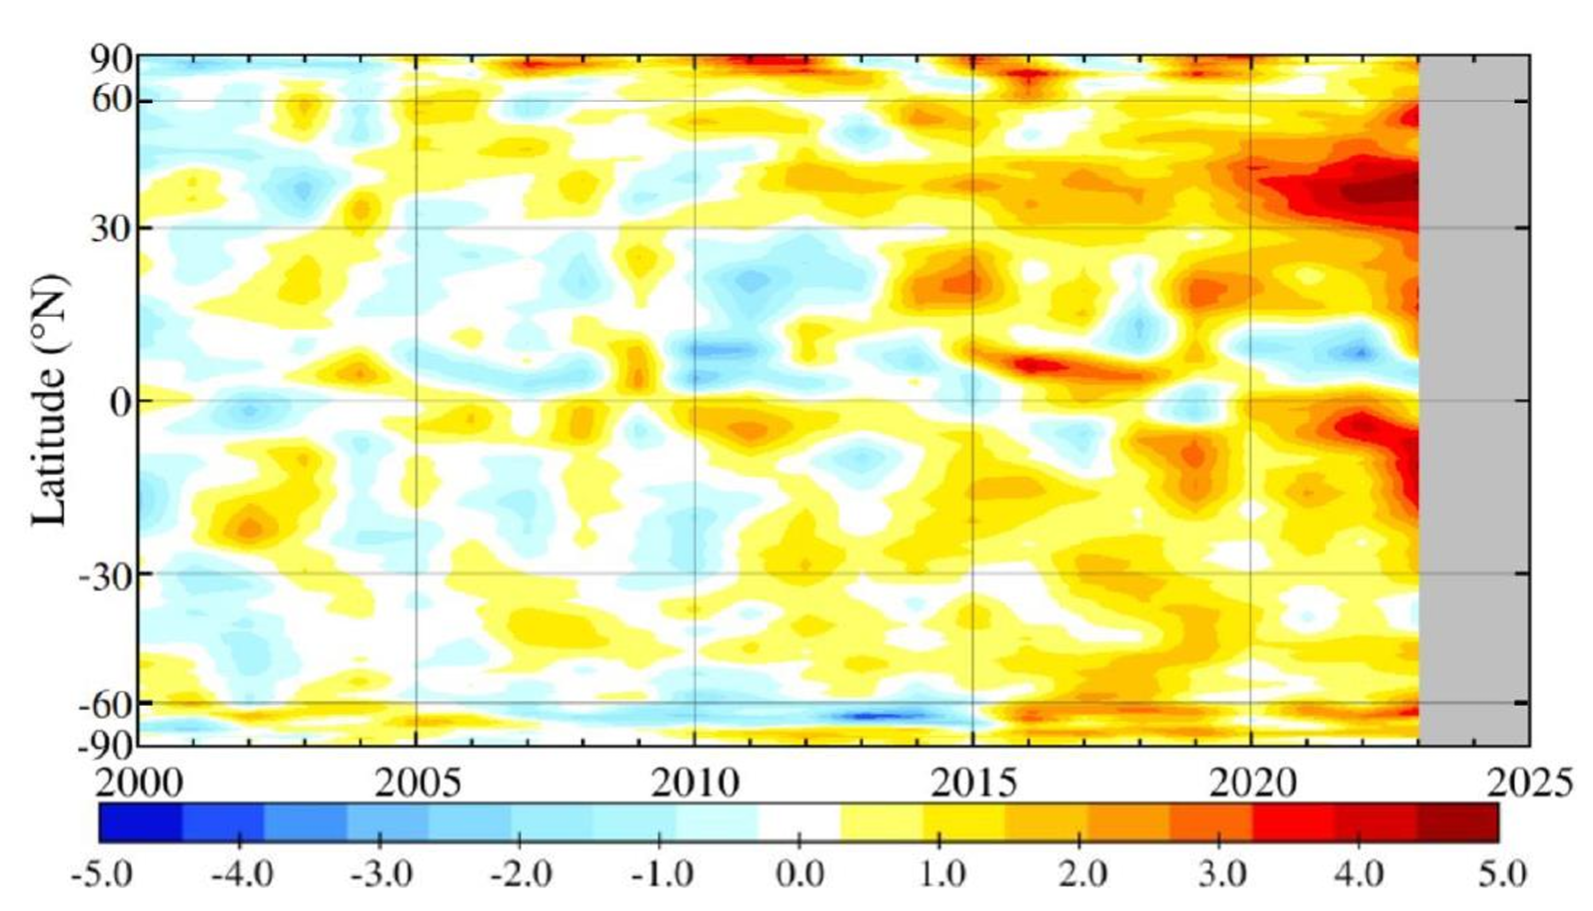
The climate forcing at 30-60°N implied by ASR is so large that we should expect a detectable surface temperature response. A major scientific issue has been raised by an unprecedented increase of global sea surface temperature (SST) in 2023, so it is appropriate to ask whether there is a relationship between the large increase in ASR and increased SST. Fig. 5 shows that the pattern of temperature change corresponds with the location and temporal development of the ASR anomaly. Coincidence does not prove causality, as high temperatures could cause reduced cloud cover and increased ASR, so we must seek additional evidence.
The largest SST change is at 30-60°N (Fig. 5), the region with decreased aerosols. That SST increase did not appear suddenly in 2023 – it was well underway in 2020. During 2020-2022 the tropics were in a La Niña cooling trend with the La Niña depth disguised by the effect of accelerated global warming on the temperature of upper ocean layers. Global SST made a big jump in 2023 because tropical, midlatitude, and polar temperature changes were all suddenly in warming phase. There is no basis for fear that new physics has come into play. The tropics will cool as the El Niño fades later this year, although the present large planetary energy imbalance will inhibit the size of the global temperature decline.
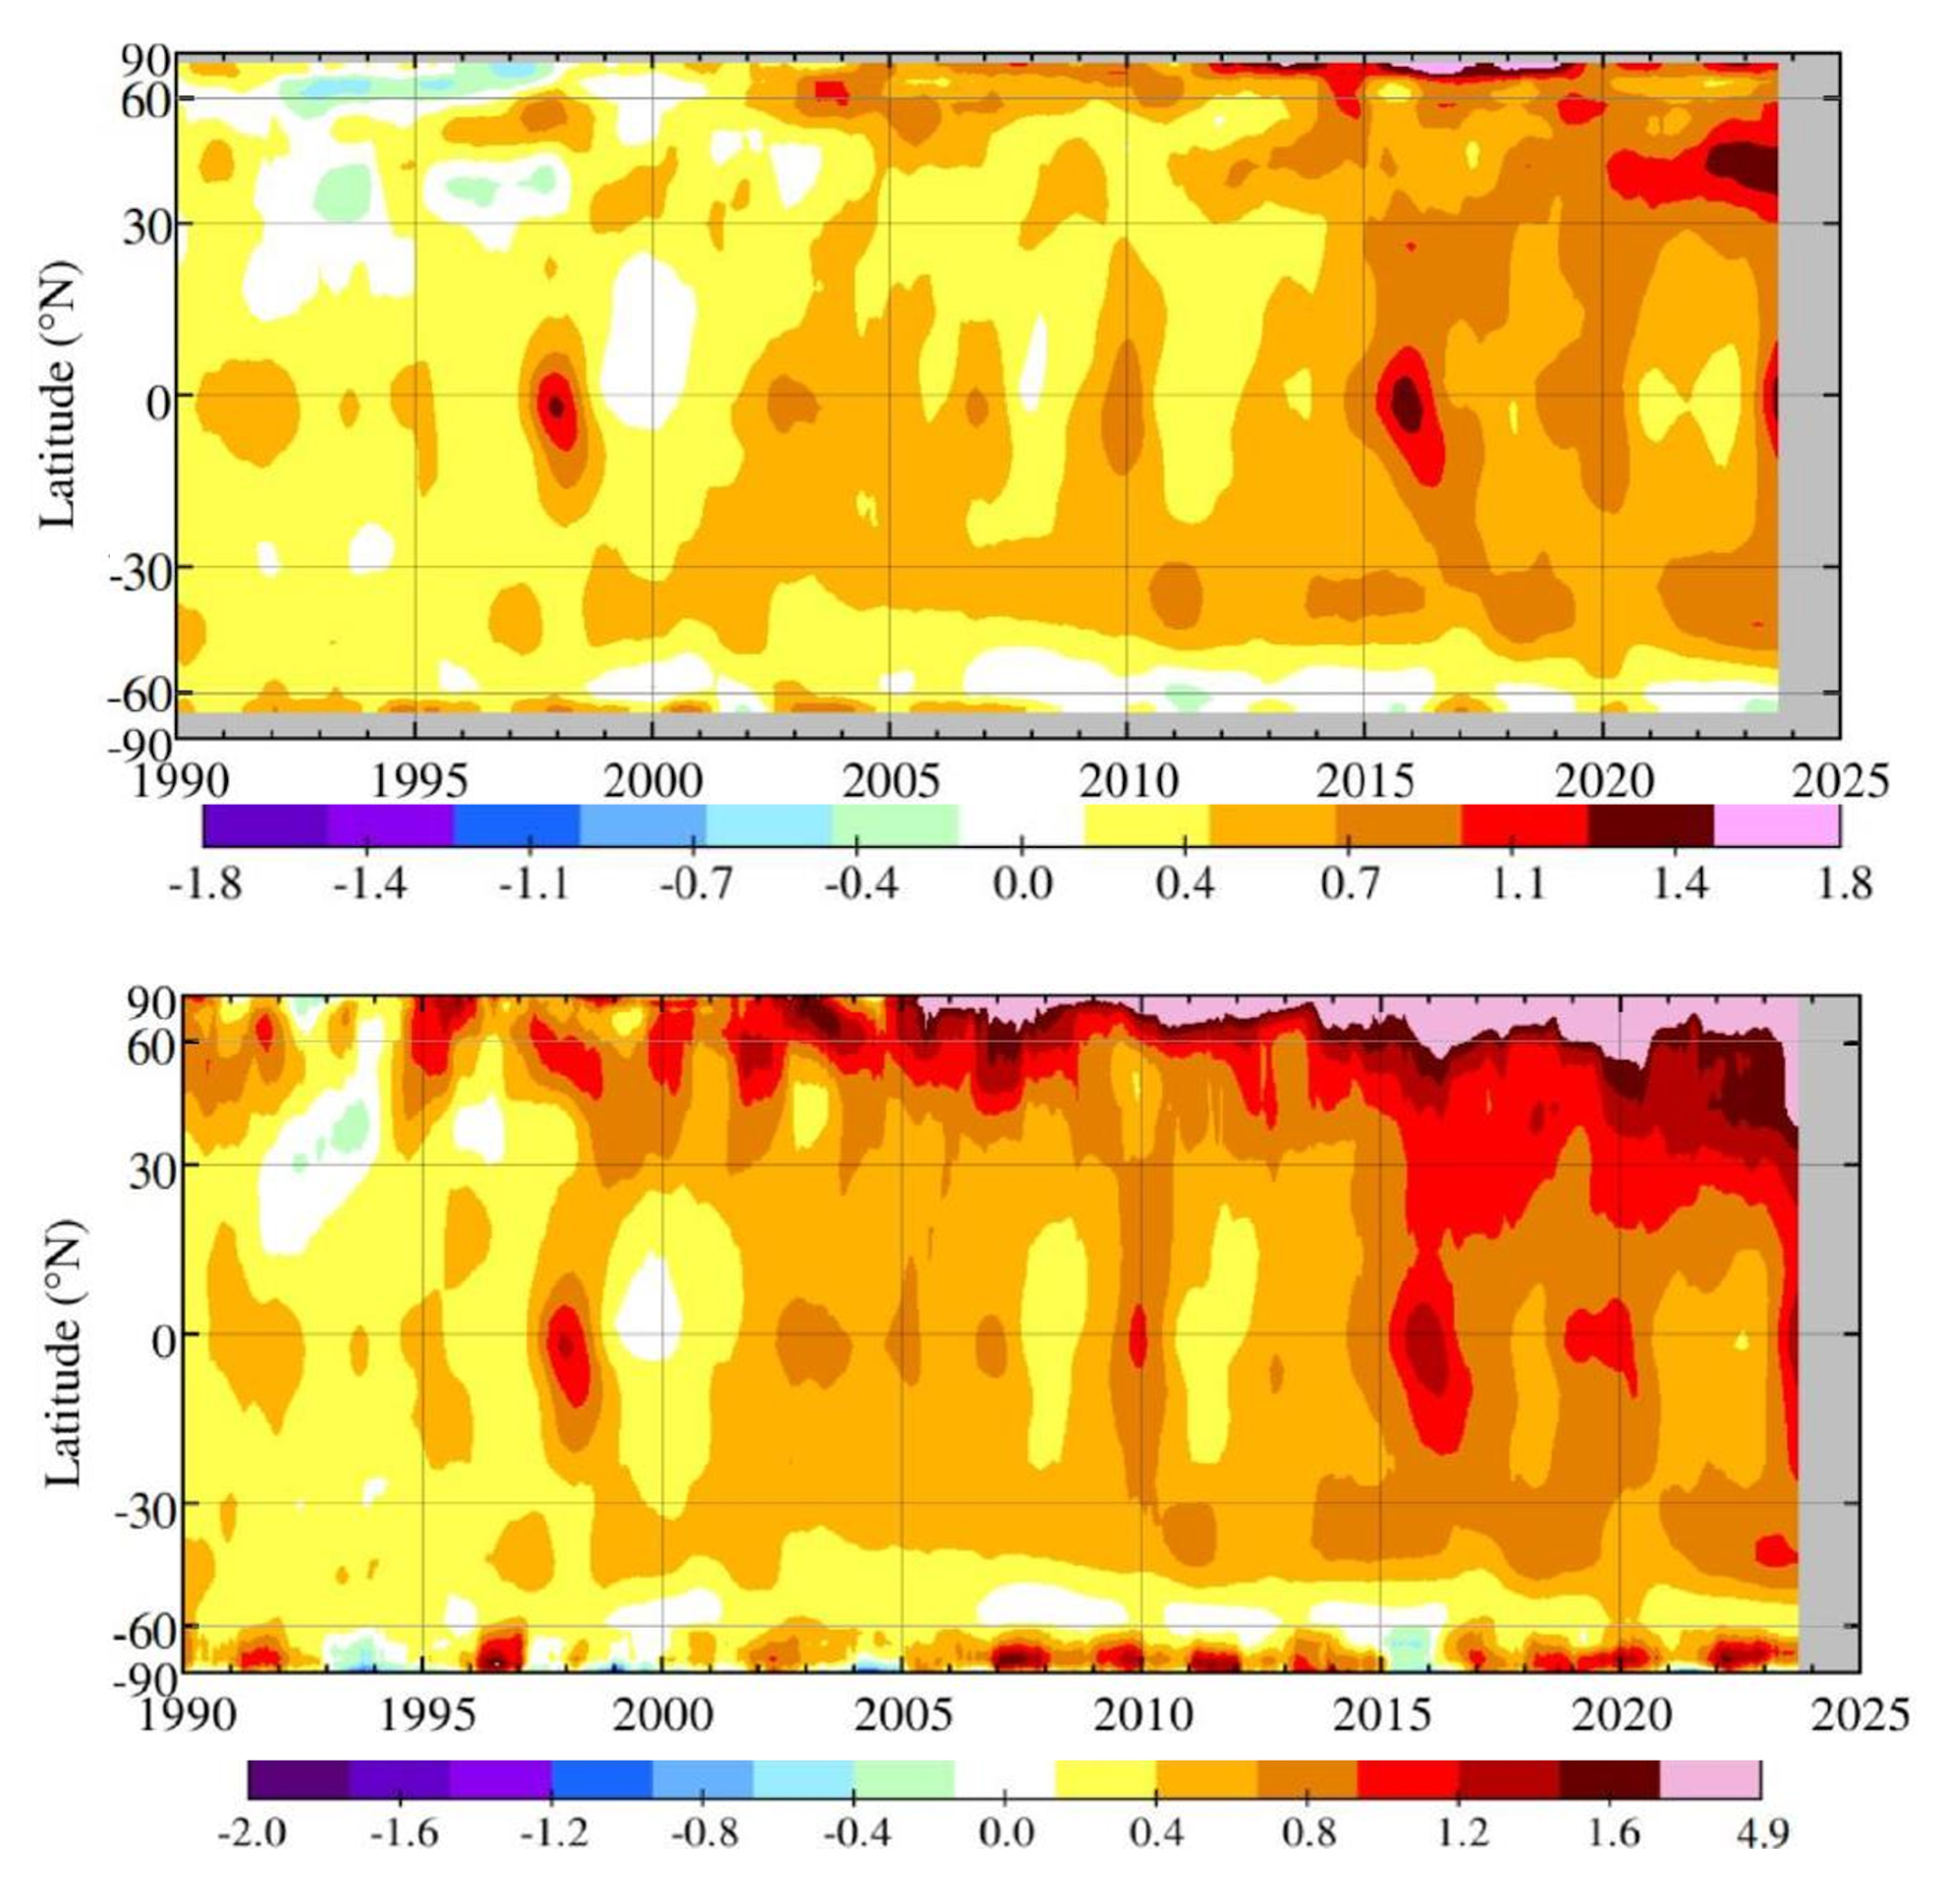
Zonal-mean surface temperature (Fig. 6) based on the GISS temperature analysis supports the interpretation of global warming that we have presented here and elsewhere. Warming is accelerating in the past 10-15 years, especially at midlatitudes in the Northern Hemisphere.
The fact that the climate physics is understandable is no reason to relax. On the contrary, we have shown that the world is approaching a point of no return in which the overturning ocean circulation may shut down as early as midcentury and sea level rise of many meters will occur on a time scale of 50-150 years. Time is running short to make the public and policymakers aware of the threat posed by the delayed response of our climate system and of the actions that should replace present wishful thinking (hopium). This education will not happen instantly, but it is realistic to hope that we can greatly improve understanding this decade, a period that should be long enough to expose the fruitlessness of present policies, as well as to verify the physics of ongoing climate change. [more]