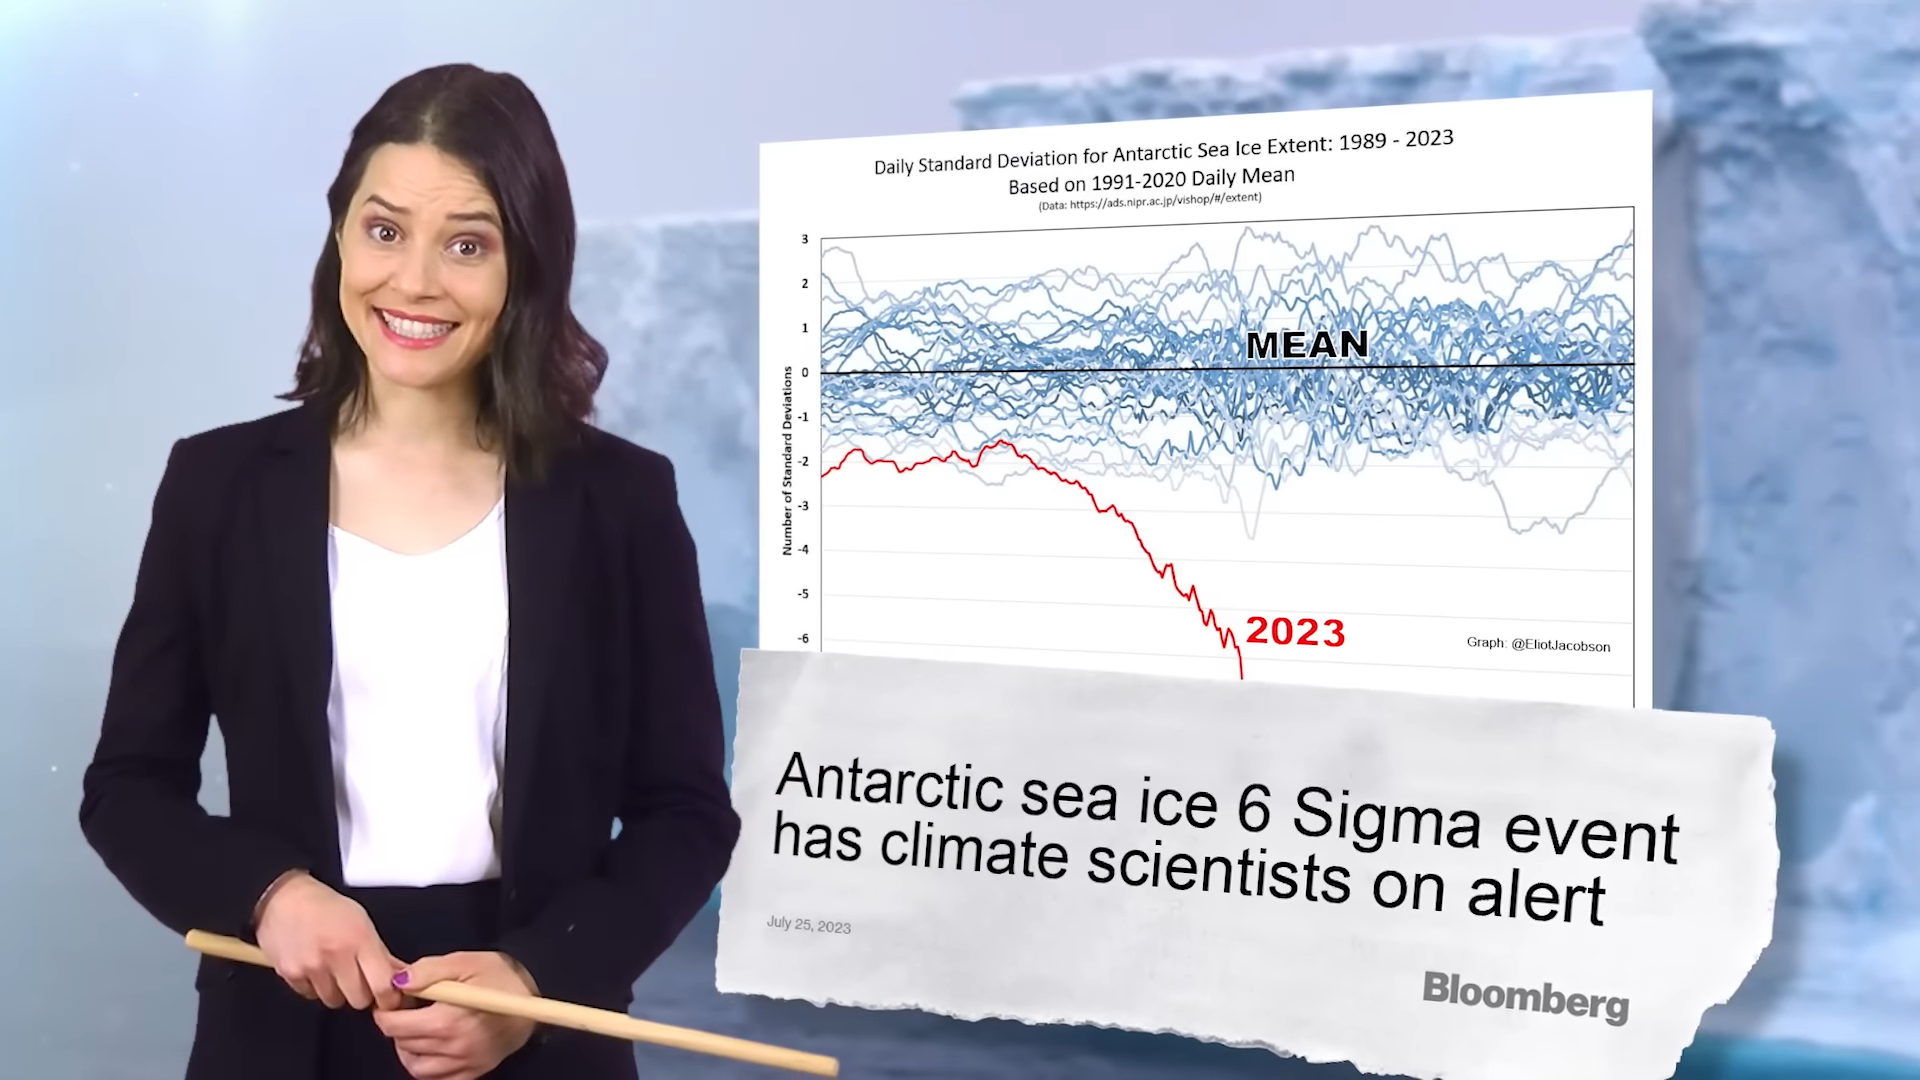
1 August 2023 (The Juice Media) – Hello. Bonjour. Ciao stronzi. Namaste. Ham maadarachod hain. I’m from the Australien Government with a message to the world. As cities bake, fires rage, reefs die, jet streams weaken, and 6-Ligma events cause climate scientists to shit their dacks, many are wondering if we’ve finally broken our favourite […]
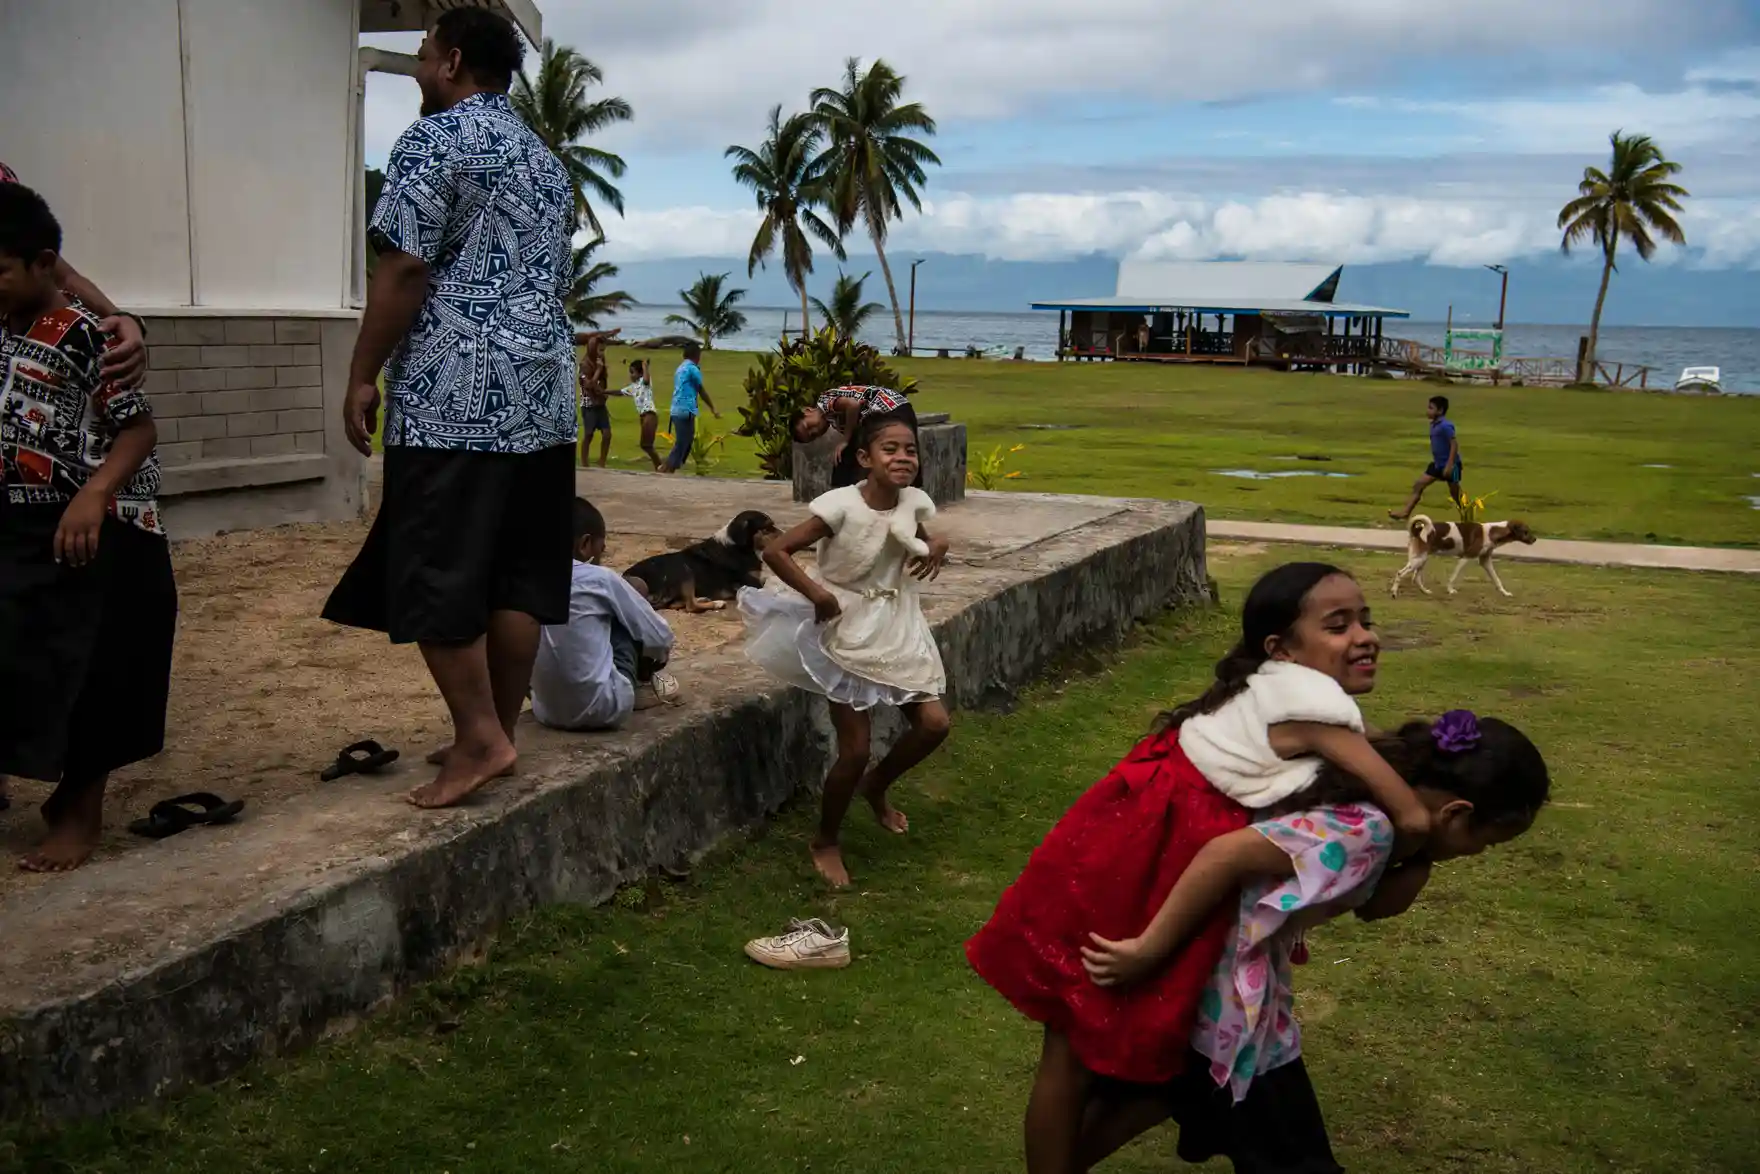
By Pauline Rouquette 11 November 2023 (France24) – Canberra announced on Friday that it is offering climate refuge to Tuvaluans, unveiling the terms of a pact that would enable citizens of the 26-square kilometre archipelago – the fourth smallest state in the world – to move to Australia to “live, study and work”. Located near […]
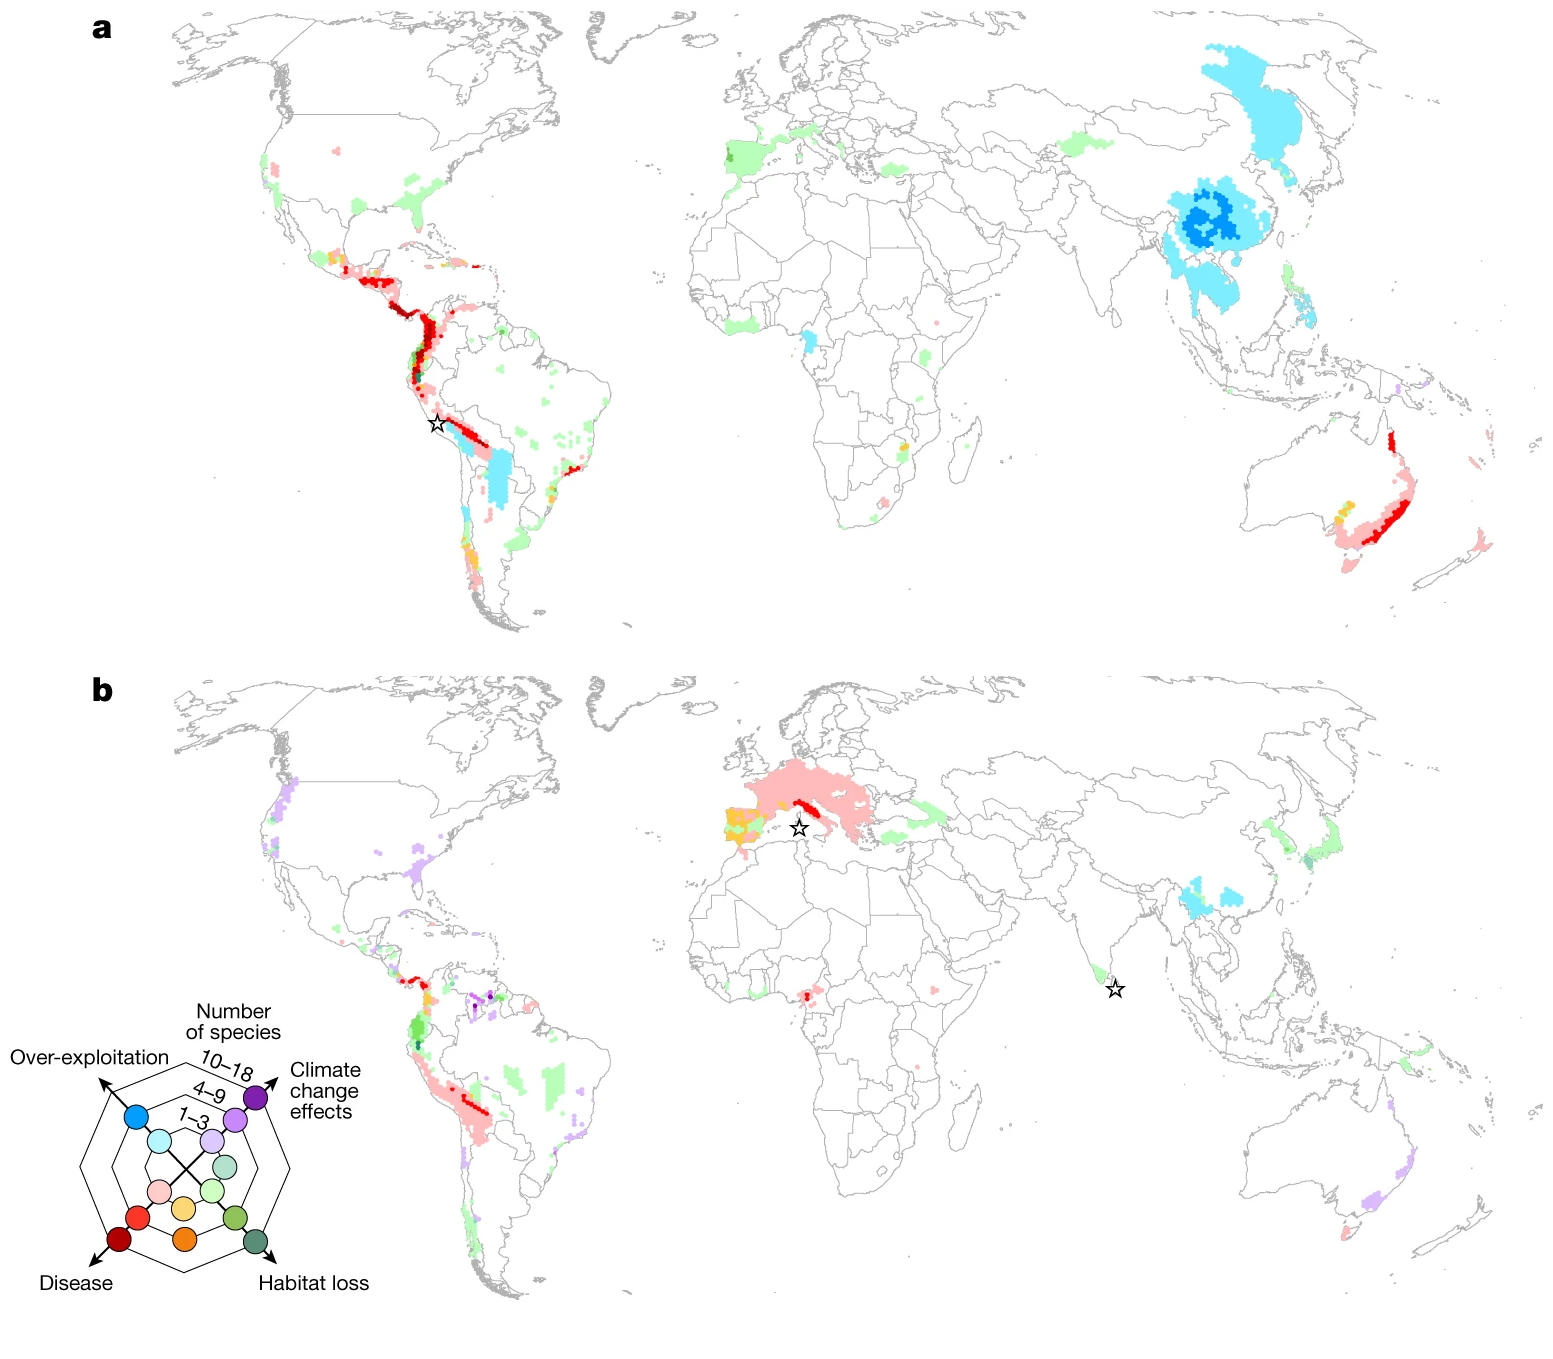
By JoAnn Adkins 4 October 2023 (FIU) – Amphibians are in trouble and in desperate need of conservation action, according to a new global assessment of the world’s amphibian population. Salamanders are experiencing the greatest decline in numbers, but frogs, toads, newts, and salamanders throughout the Neotropics — extending from South Florida and Caribbean islands […]
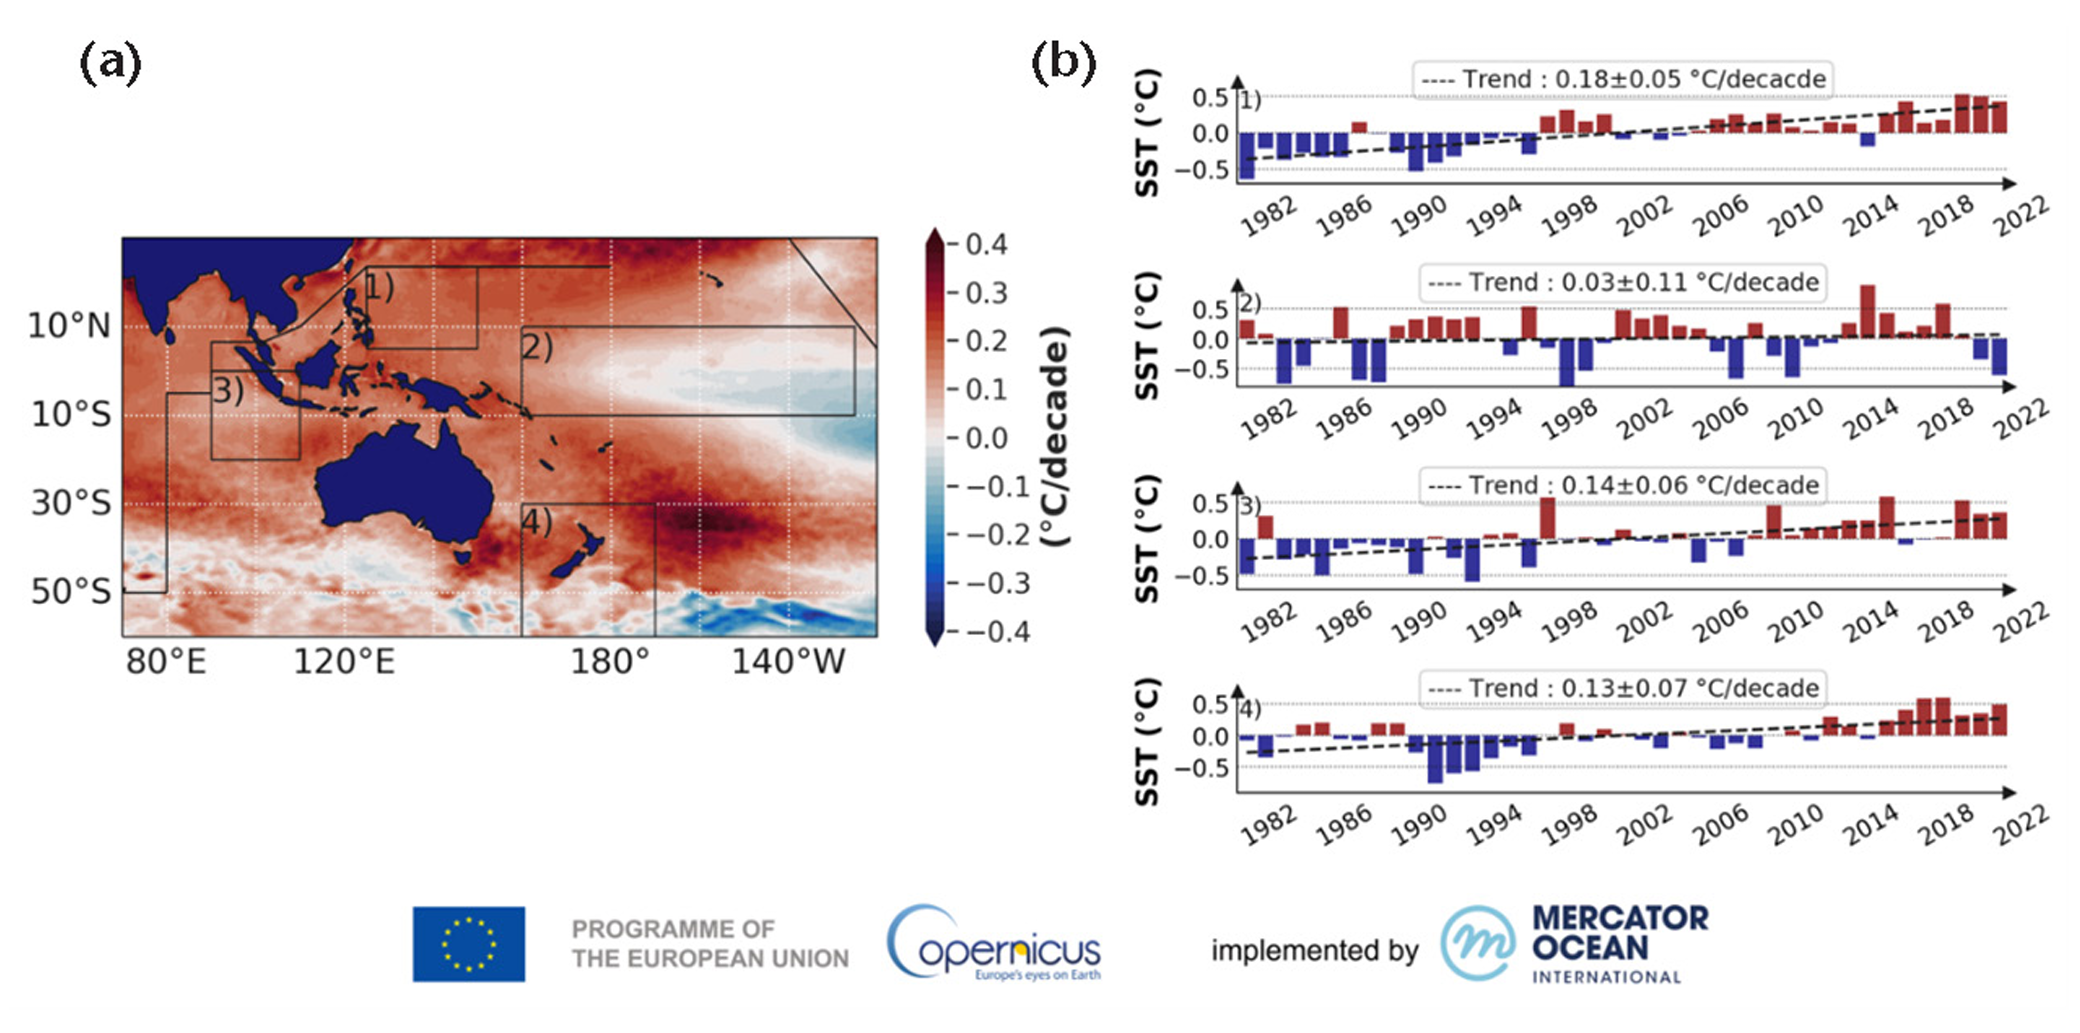
By Gabrielle Tétrault-Farber 17 August 2023 GENEVA (Reuters) – Sea levels in the South-West Pacific are rising faster than the global average, threatening low-lying islands while heat damages marine ecosystems, the U.N. meteorological agency said on Friday. In its State of the Climate in the South-West Pacific 2022 report, the World Meteorological Organization (WMO) said […]
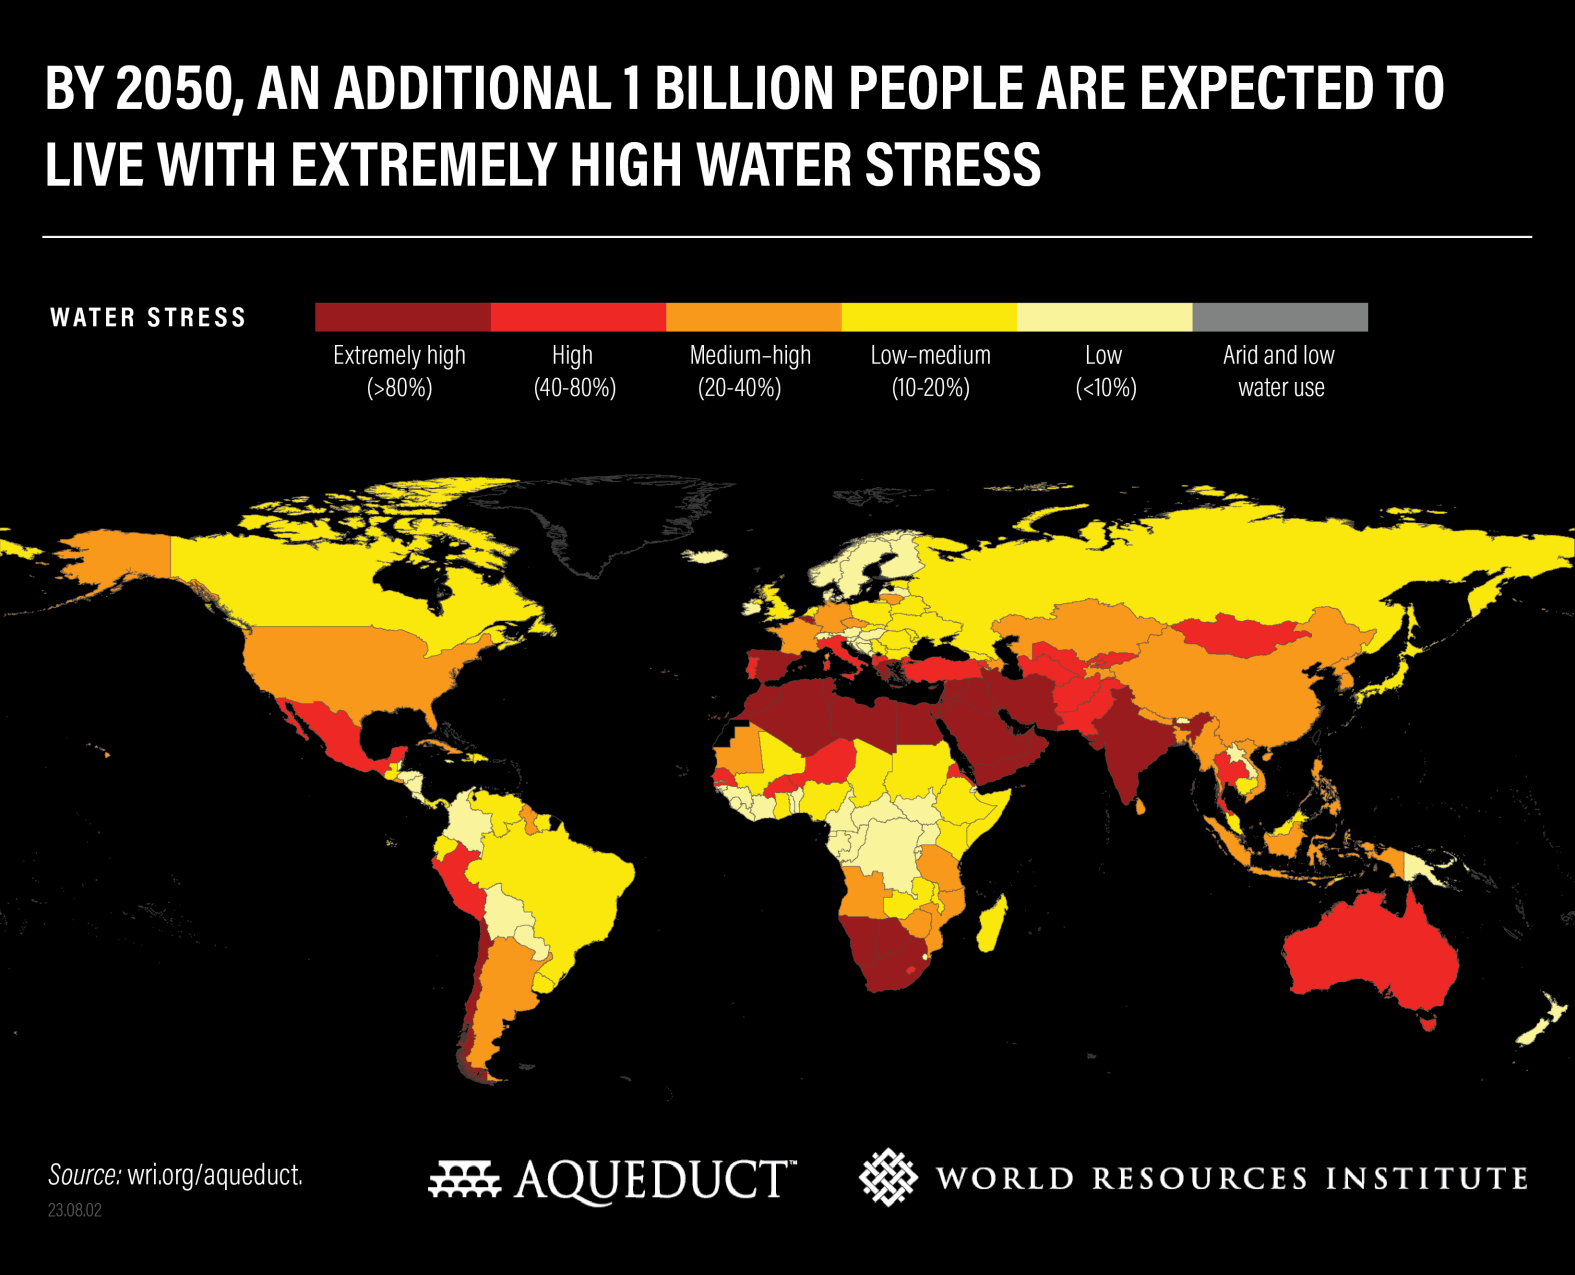
By Samantha Kuzma, Liz Saccoccia, and Marlena Chertock 16 August 2023 (WRI) – New data from WRI’s Aqueduct Water Risk Atlas show that 25 countries — housing one-quarter of the global population — face extremely high water stress each year, regularly using up almost their entire available water supply. And at least 50% of the world’s population […]
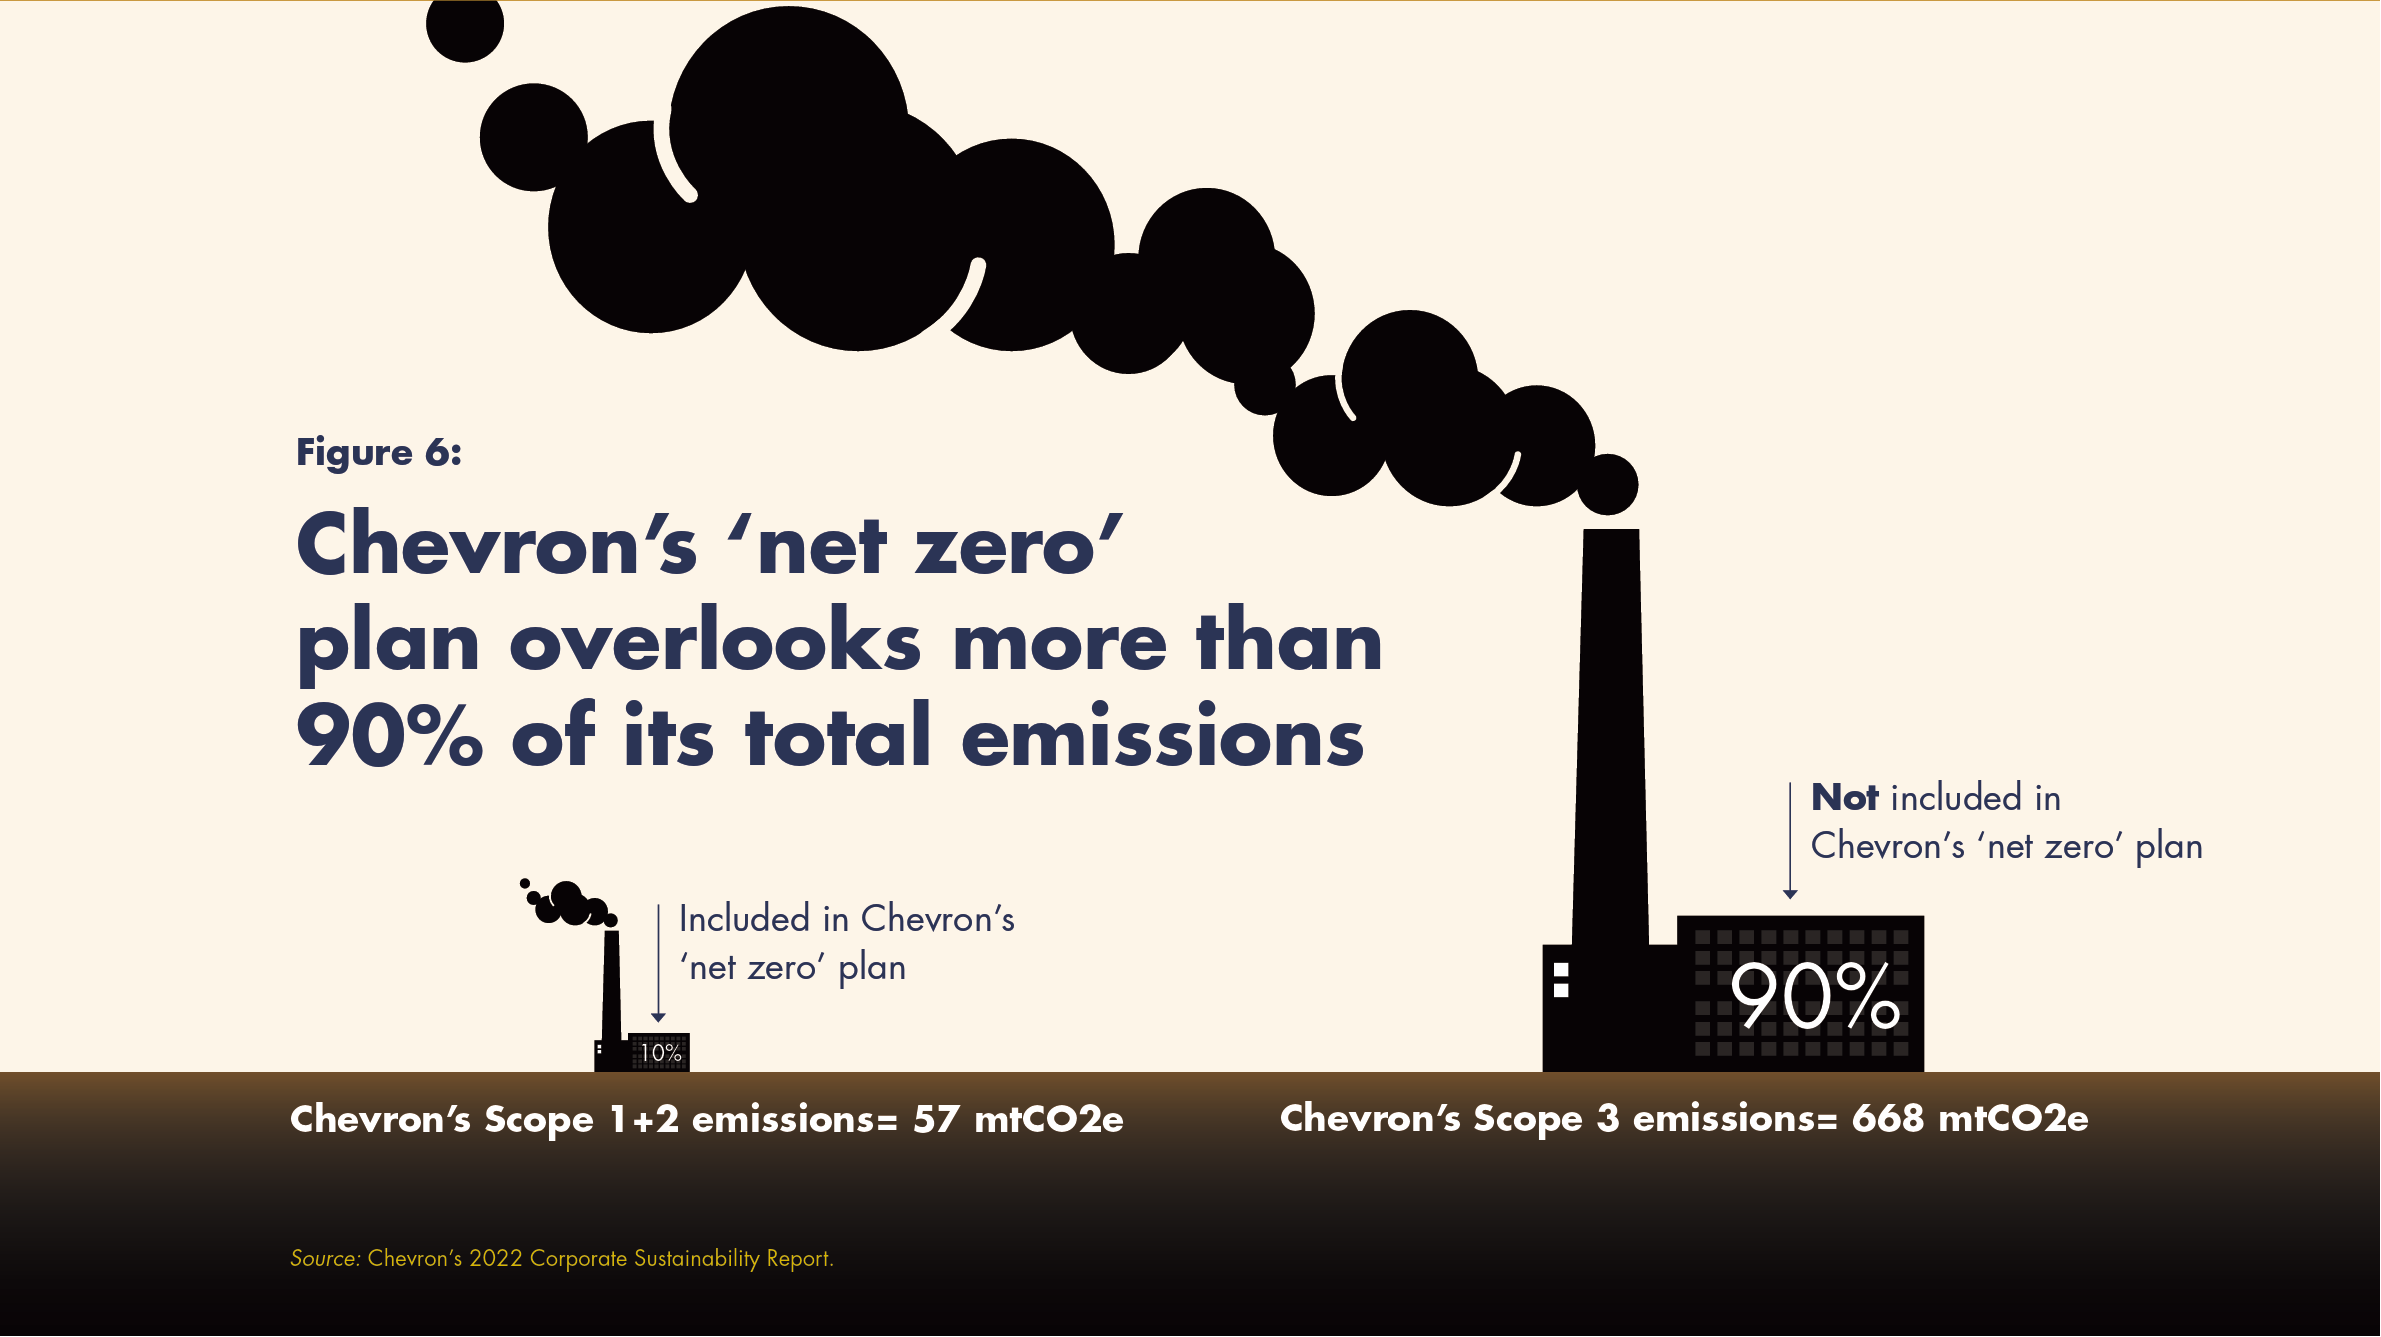
By Nina Lakhani 24 May 2023 NEW YORK (The Guardian) – A new investigation into Chevron’s climate pledge has found the fossil-fuel company relies on “junk” carbon offsets and “unviable” technologies, which do little to offset its vast greenhouse gas emissions and, in some cases, may actually be causing communities harm. Chevron, which reported $35.5bn […]
By Olivia Trani 1 June 2023 (VCU) – When it comes to public health, the United States is at a disadvantage compared with other developed countries. Americans experience more illness, have less access to health care and pay more for health services than citizens in other high-income countries. Americans also die earlier – and have been doing so […]
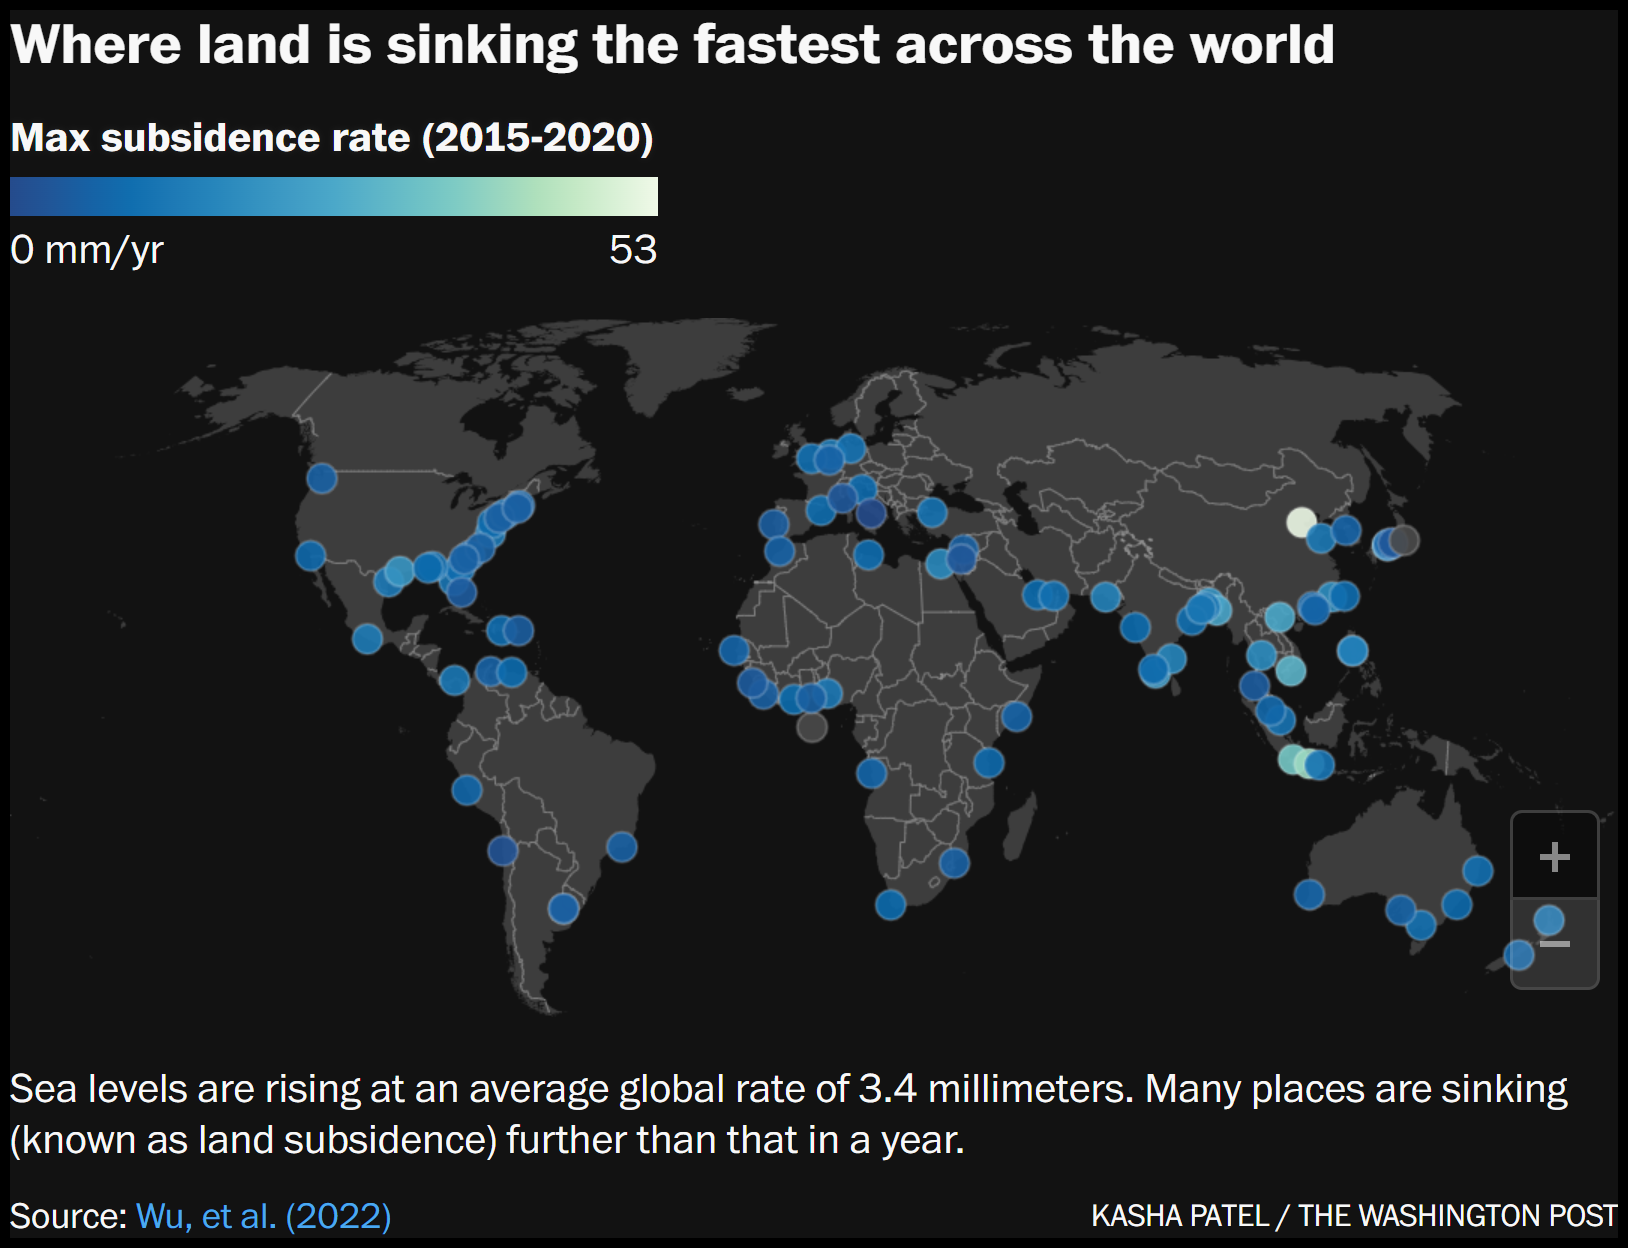
By Kasha Patel 30 May 2023 (The Washington Post) – Imagine Earth’s surface is like a stack of pancakes. The pancakes, or layers of soil and rocks, may appear fairly evenly stacked and fluffy. Over time though, the stack can become compressed, thinner and shorter. Scientists observe this downward motion of land, called land subsidence, […]
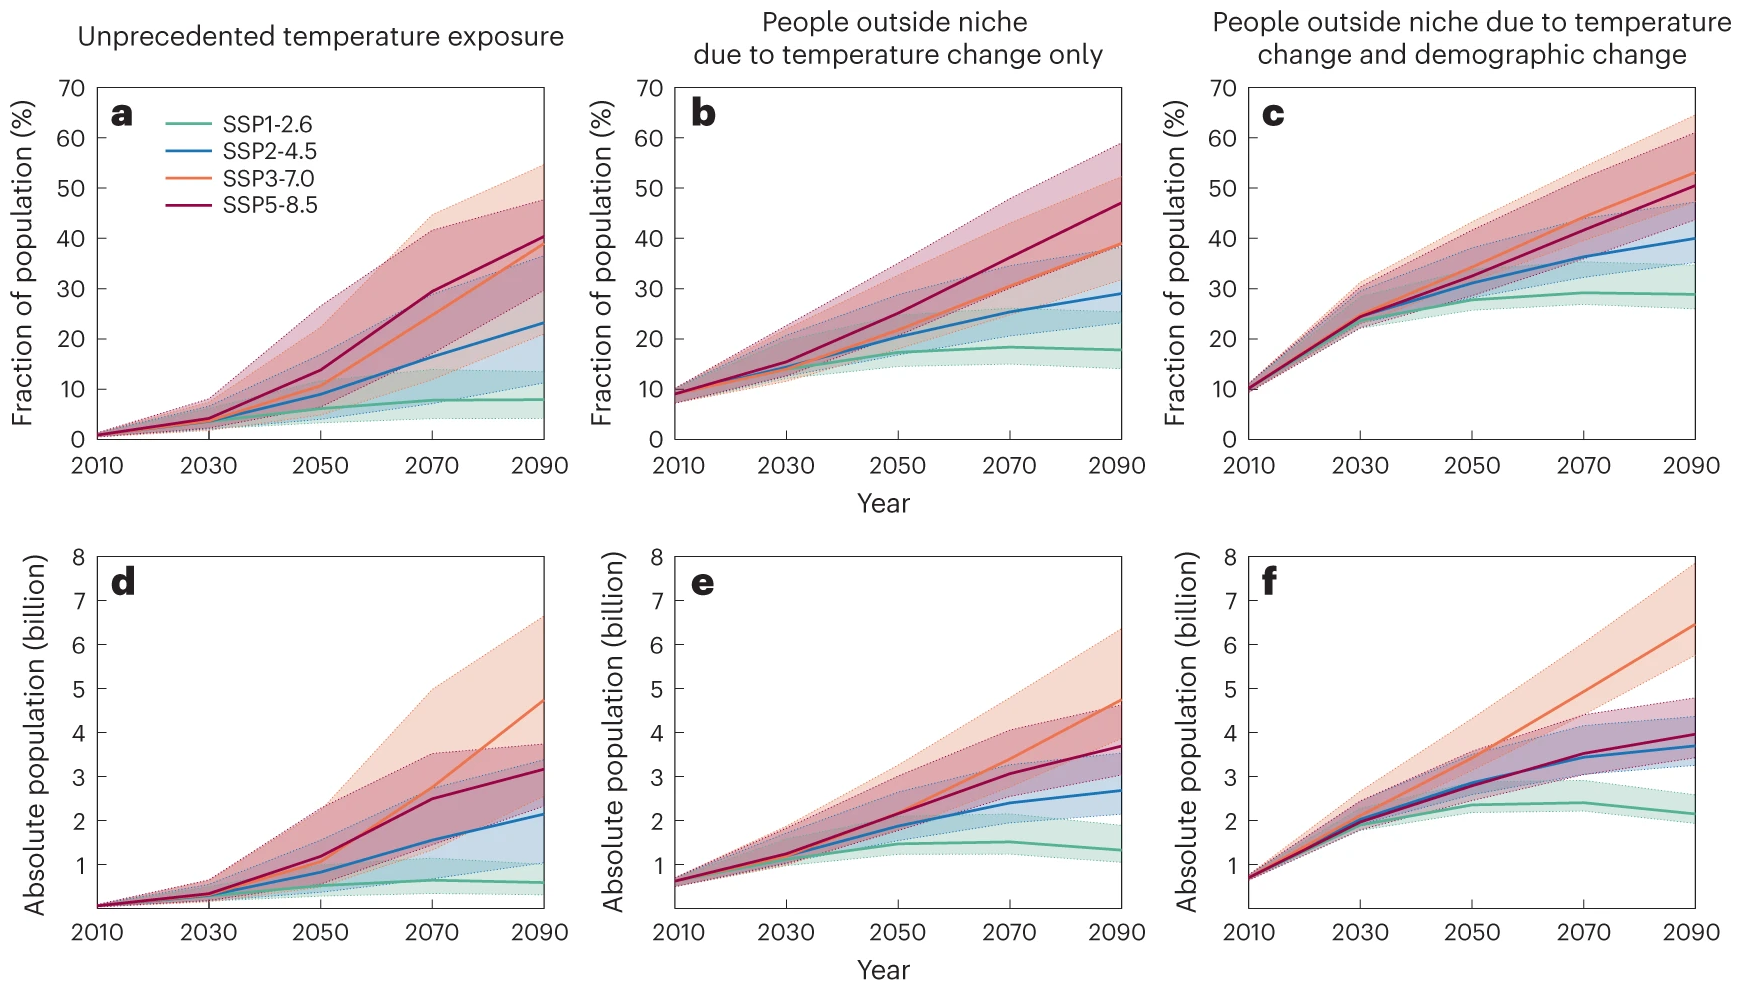
By Alex Morrison 22 May 2023 (University of Exeter) – Current climate policies will leave more than a fifth of humanity exposed to dangerously hot temperatures by 2100, new research suggests. Despite the Paris Agreement pledge to keep global warming well below 2°C (compared to pre-industrial levels), current policies are projected to result in 2.7°C warming by the […]
3 May 2023 (RSF) – According to the 2023 World Press Freedom Index – which evaluates the environment for journalism in 180 countries and territories and is published on World Press Freedom Day (3 May) – the situation is “very serious” in 31 countries, “difficult” in 42, “problematic” in 55, and “good” or “satisfactory” in 52 countries. In […]