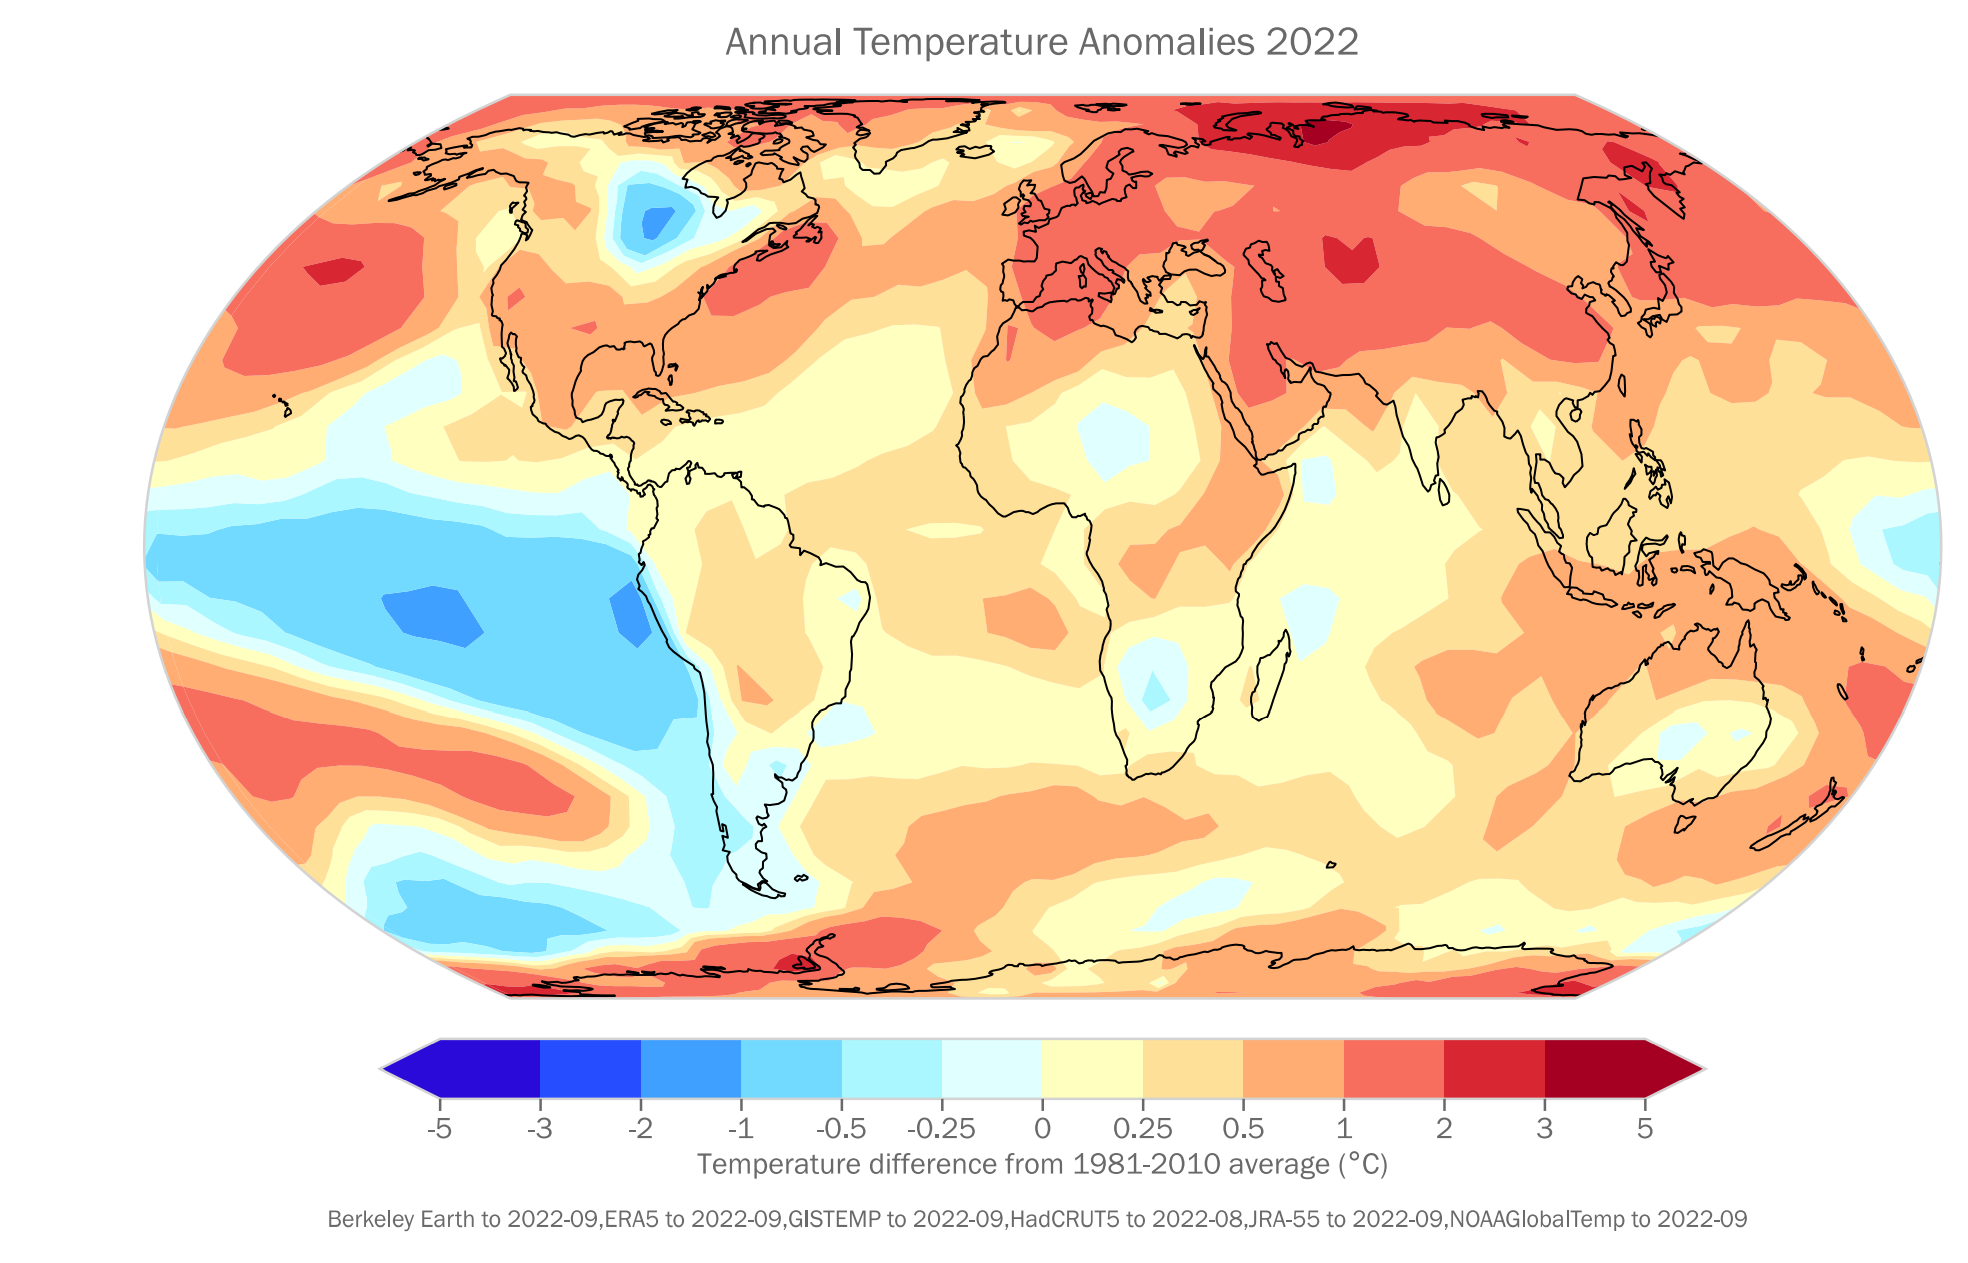
By Seth Borenstein 6 November 2022 SHARM EL-SHEIKH, Egypt (AP) – Earth’s warming weather and rising seas are getting worse and doing so faster than before, the World Meteorological Organization warned Sunday in a somber note as world leaders started gathering for international climate negotiations. [Eight warmest years on record witness upsurge in climate change impacts –Des] […]
By Sarah Sloat 29 September 2022 (NBC News) – Scientists now have unambiguous proof that a phenomenon critical to predicting the impact of climate change exists. Researchers announced Thursday that they had detected the sea level “fingerprint” of the Greenland ice sheet melt, pinpointing the unique pattern of sea level change linked to the melting ice. It’s the […]
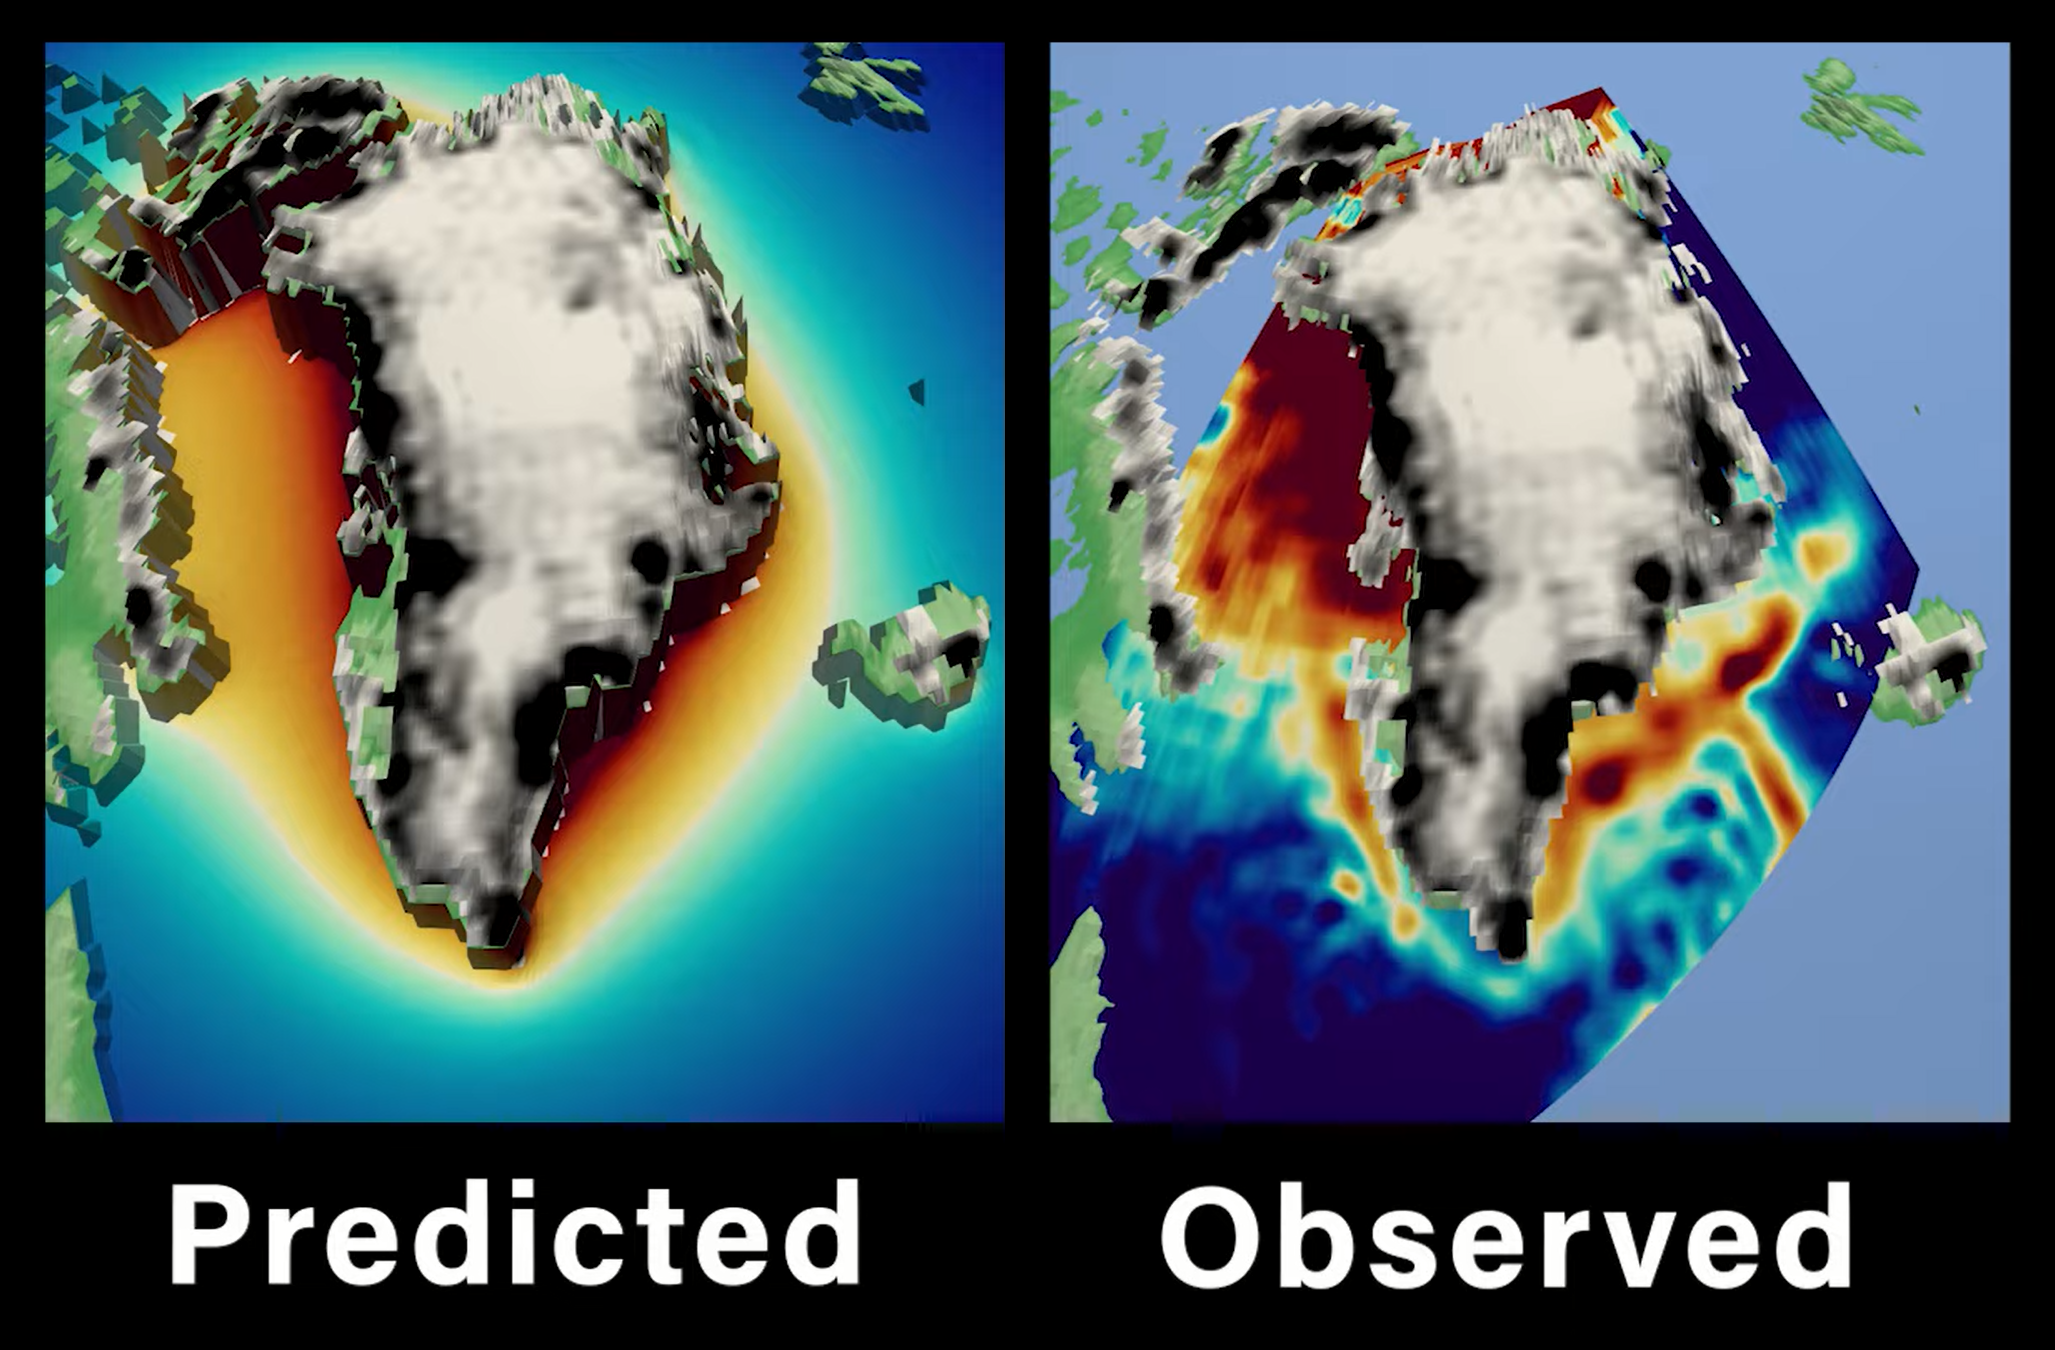
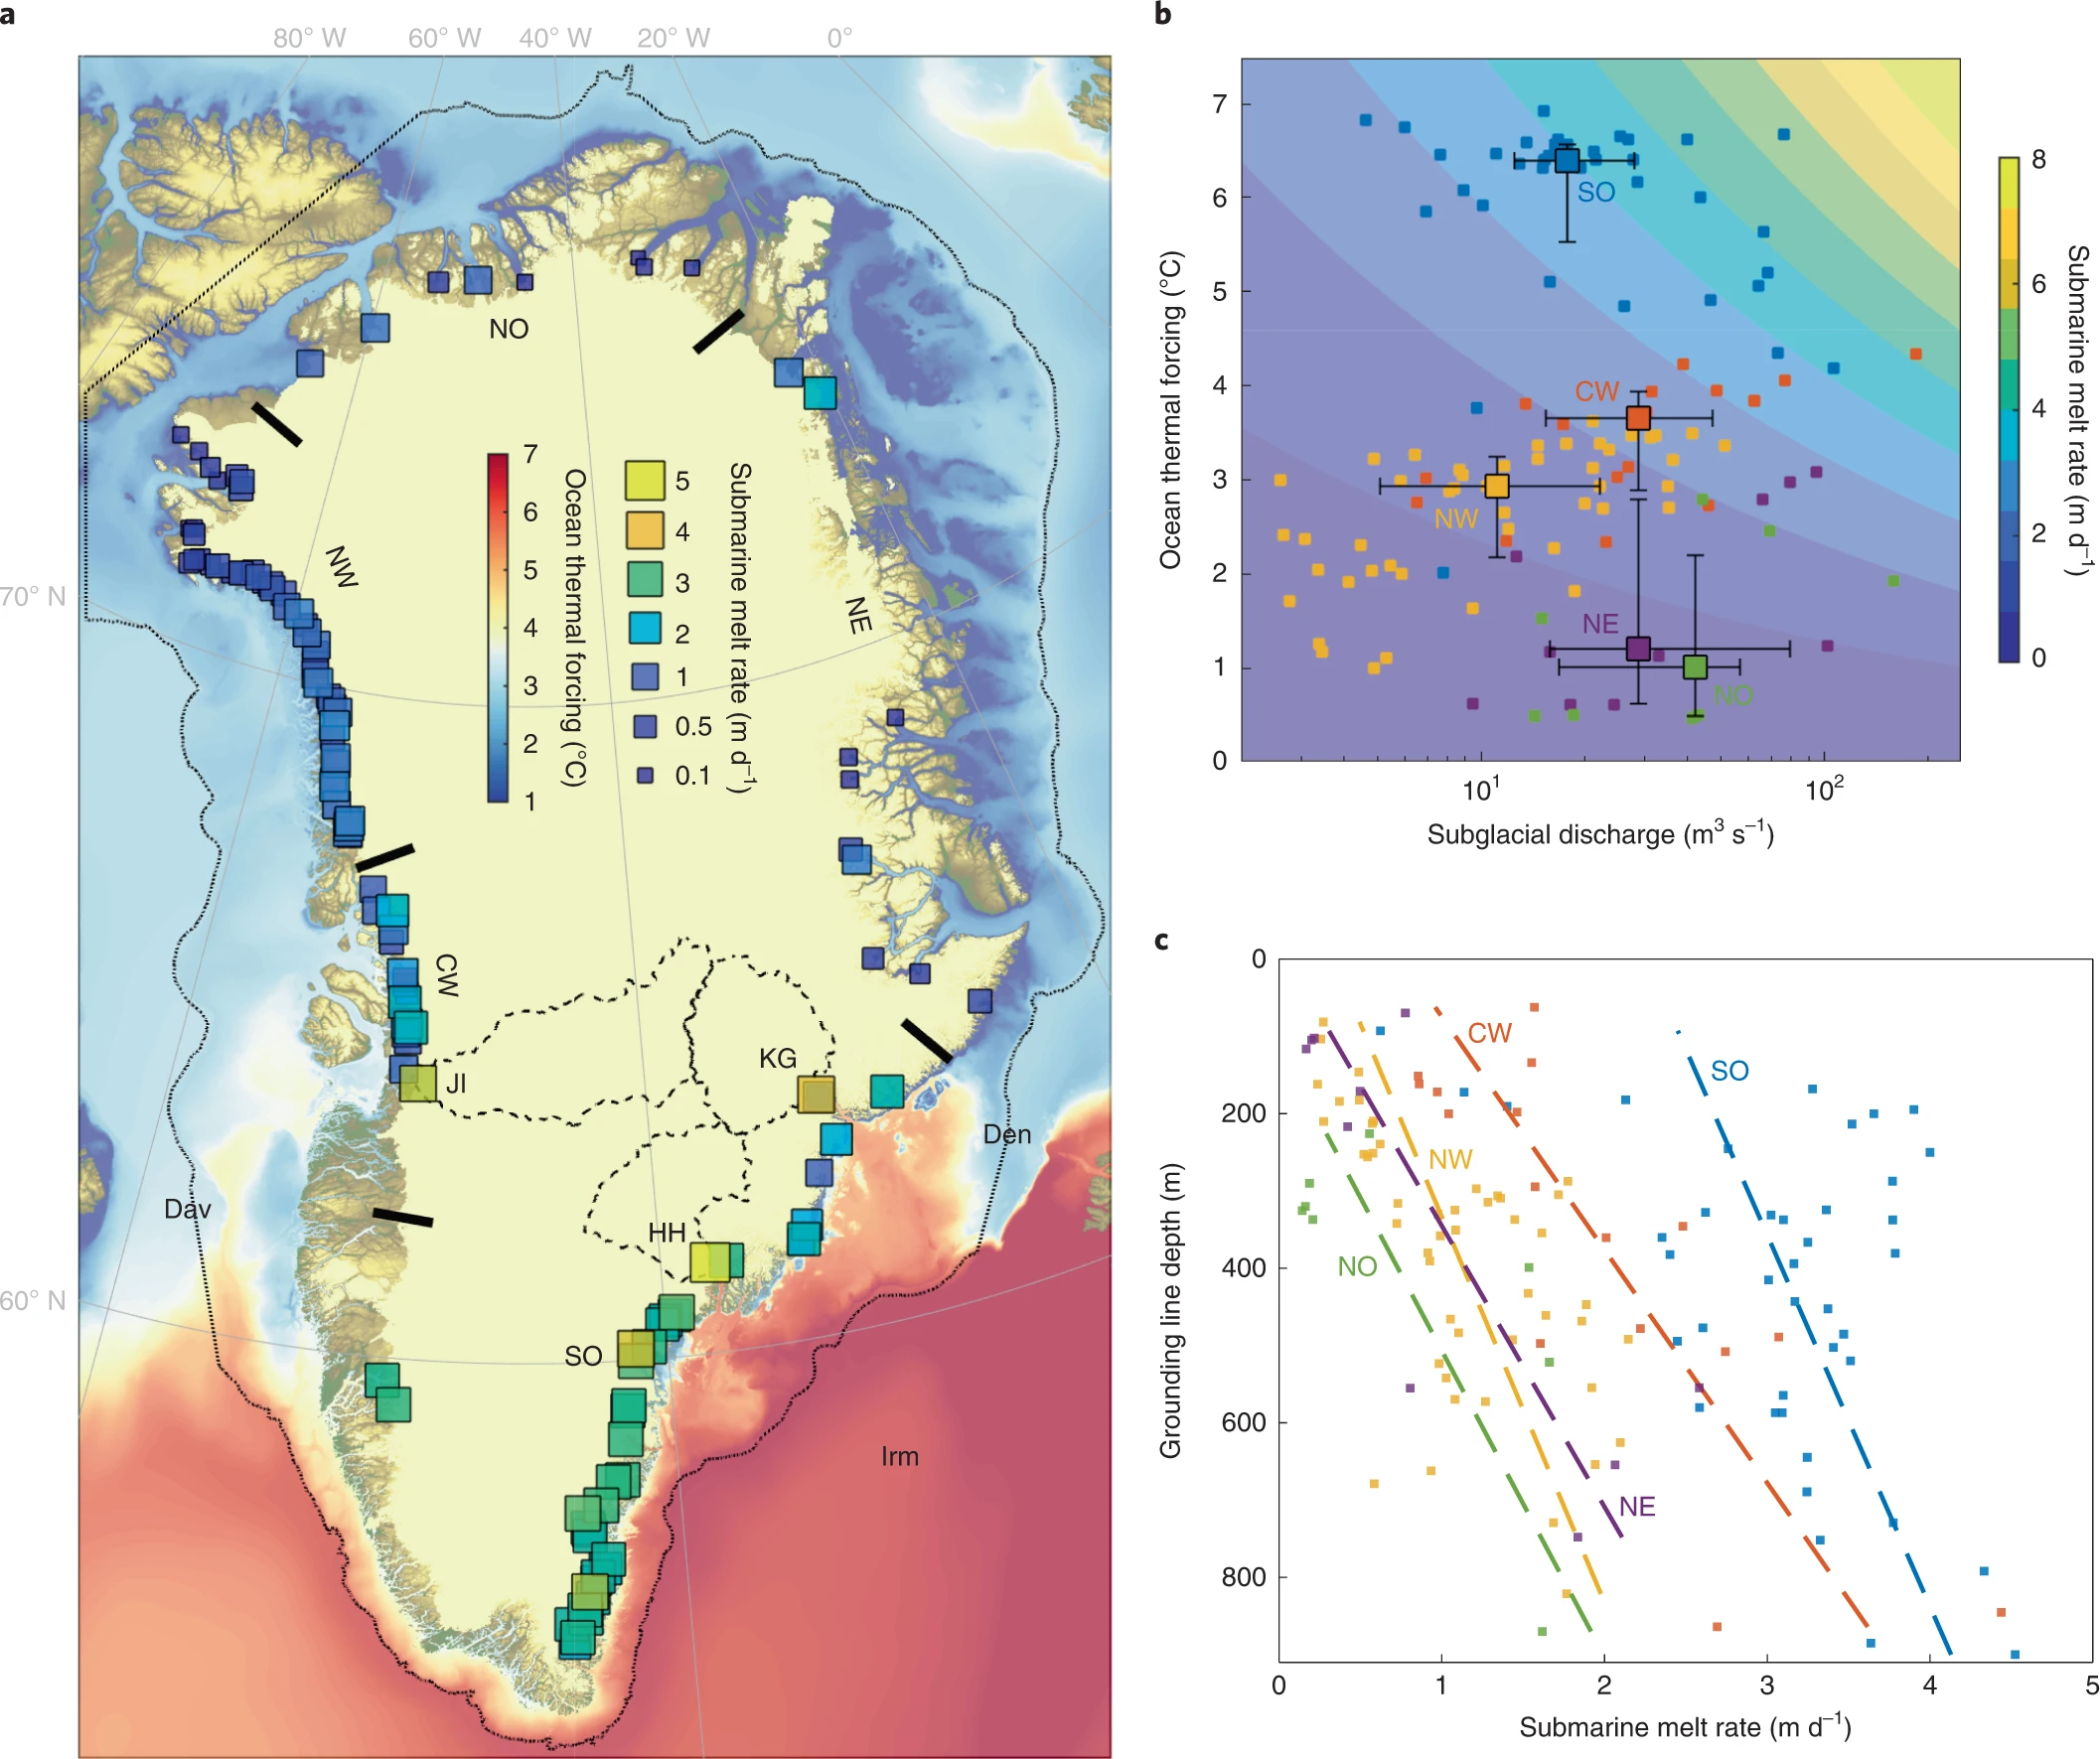
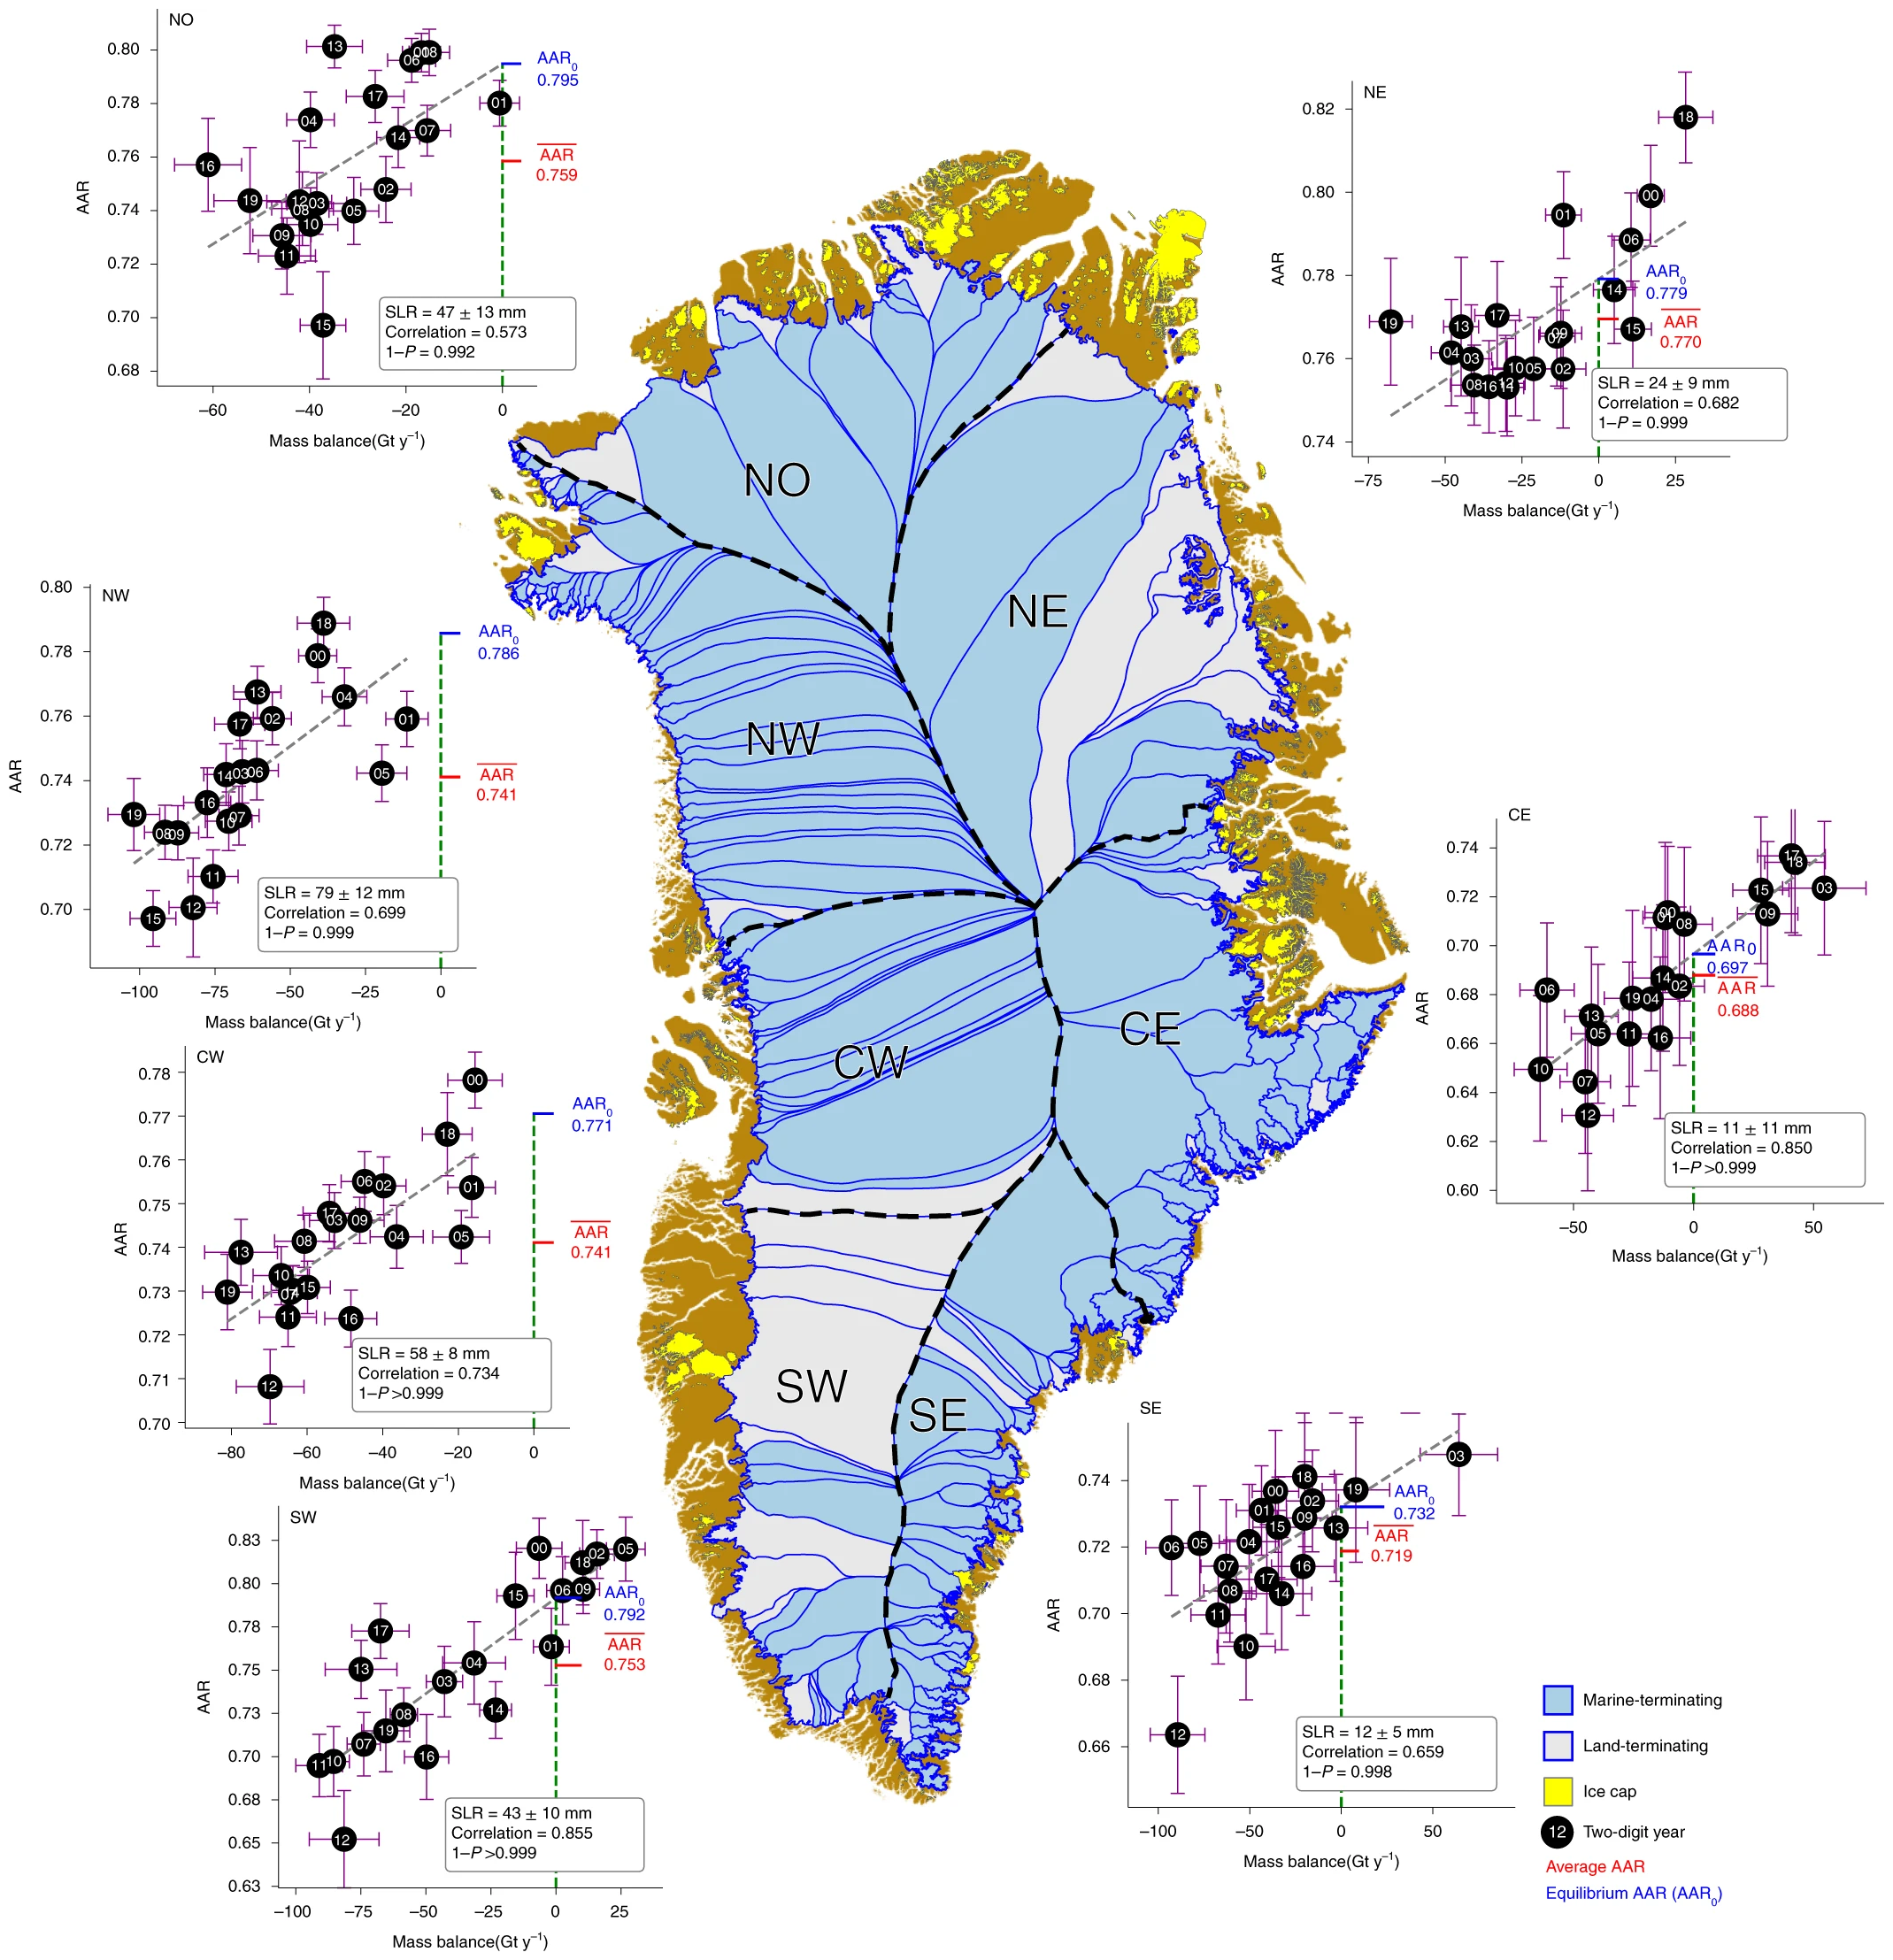
By Rachel Koning Beals 17 October 2022 (MarketWatch) – The Greenland ice sheet — one of the two most important glaciers of its kind on Earth — may be even more sensitive to the warming climate than scientists previously thought. The findings, published in the journal Nature Geoscience, shed fresh light on the forces driving ice […]
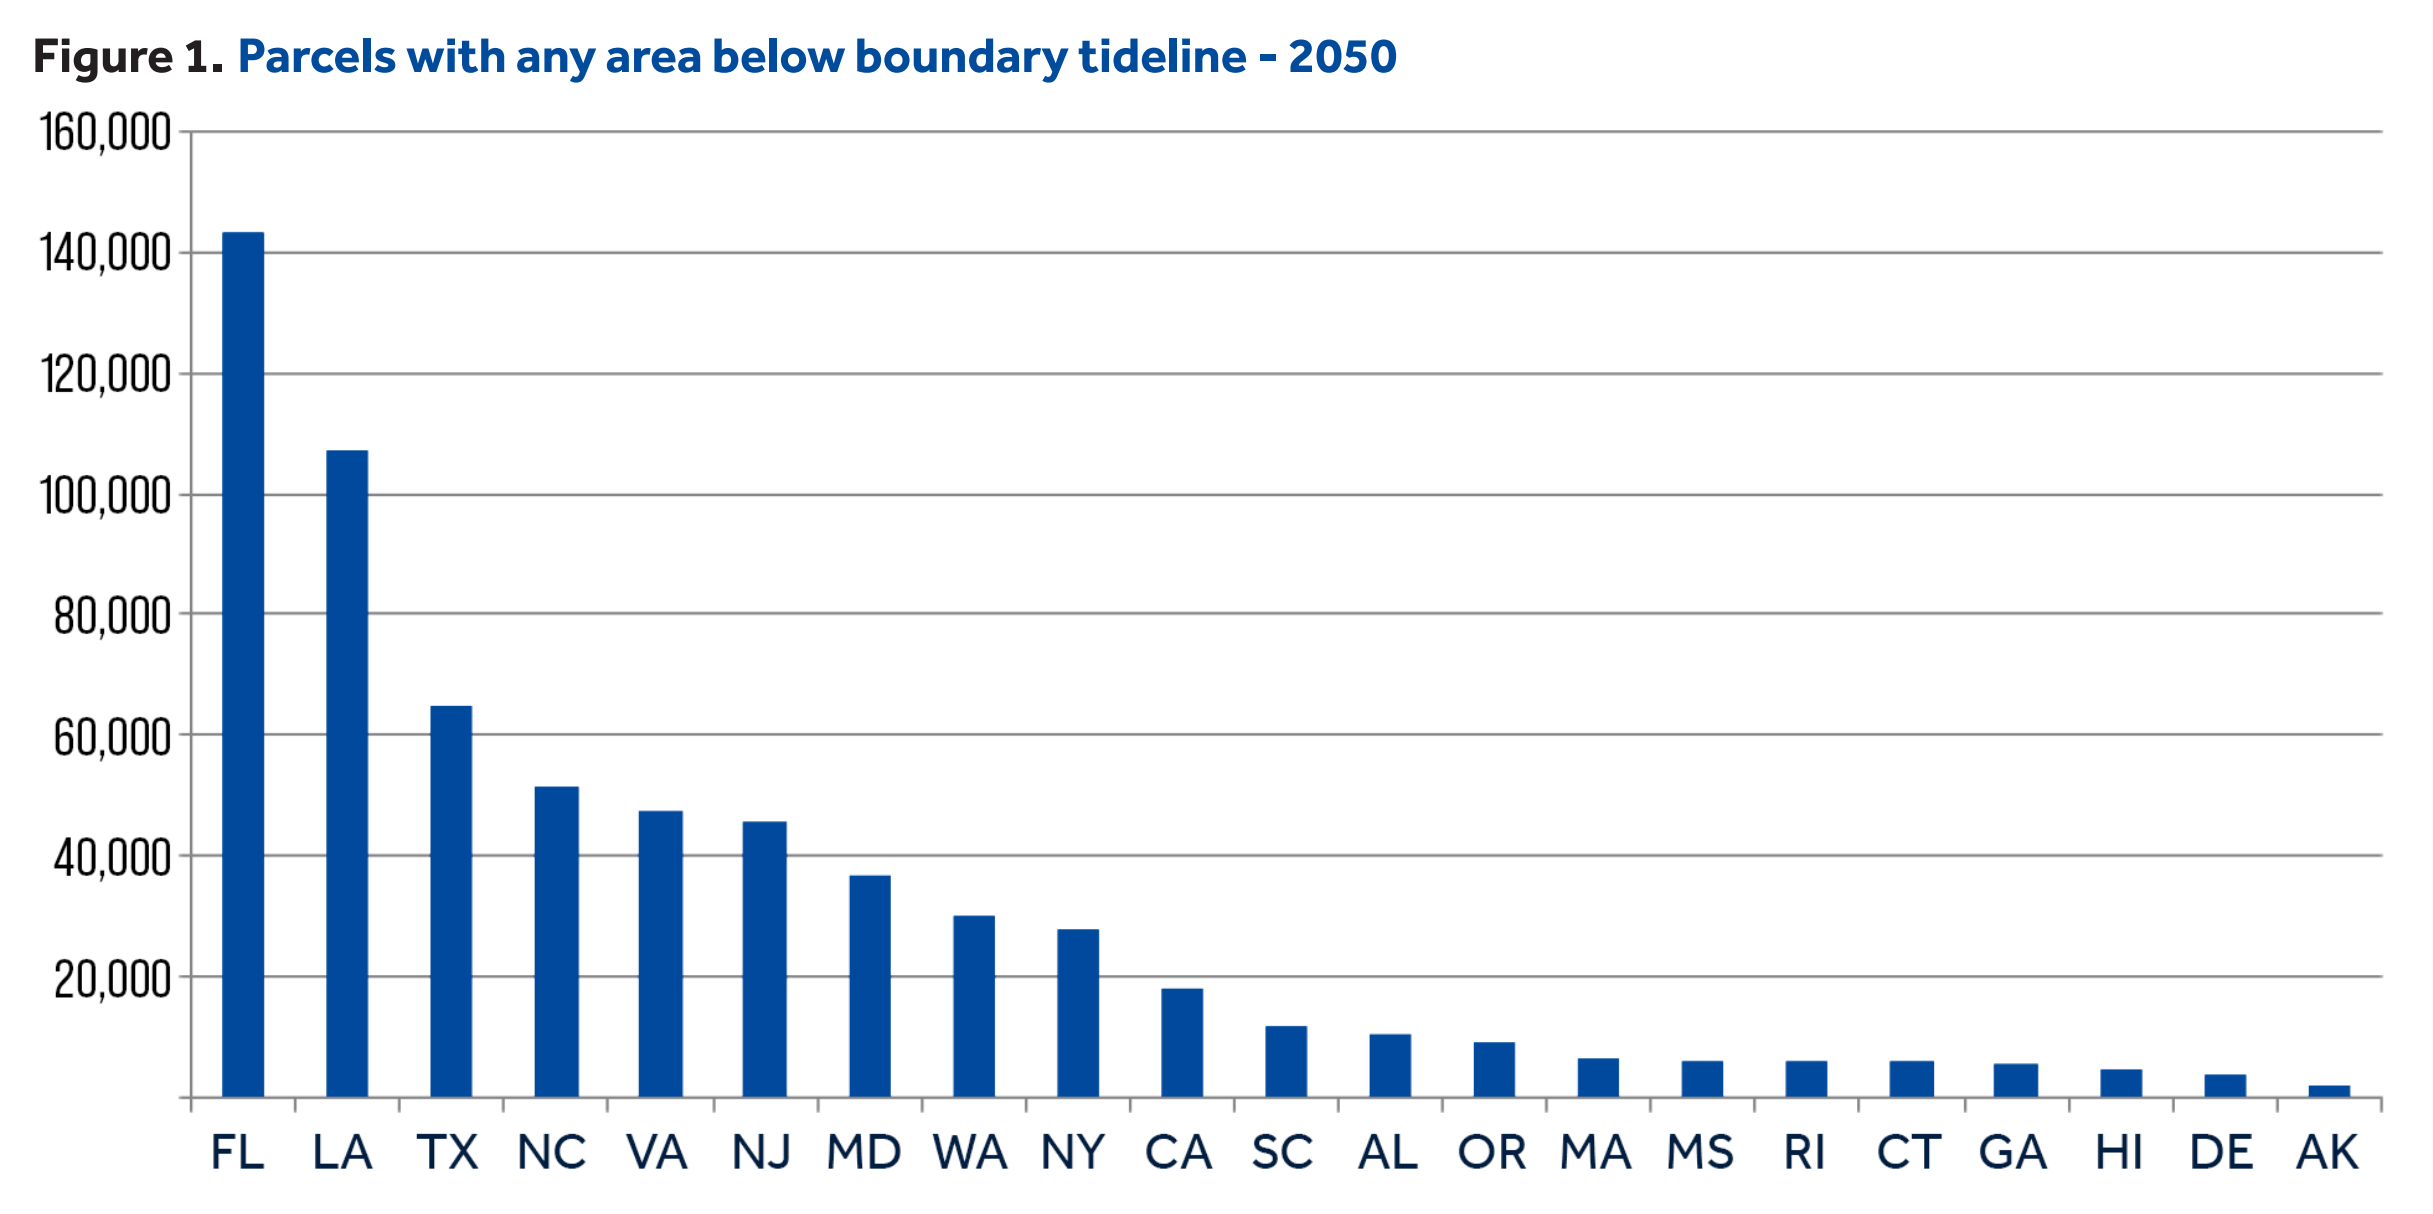
PRINCETON, N.J., 8 September 2022 (Climate Central) – New analysis from Climate Central quantifies the risk of sea level rise to the tax bases of hundreds of coastal counties across 24 states and Washington, D.C. as more land falls beneath the tideline. By 2100 more than 1 million properties with a combined assessed value exceeding $108 billion are projected to be […]
By Matthew Rozsa 7 September 2022 (Salon) – That sea levels will rise as Earth’s ice melts is a prophecy that began to come true long ago, at the dawn of industrial civilization when humans began pumping vast amounts of greenhouse gases into the atmosphere. Yet the timeline for sea level rise is not yet fully understood, nor do we really […]
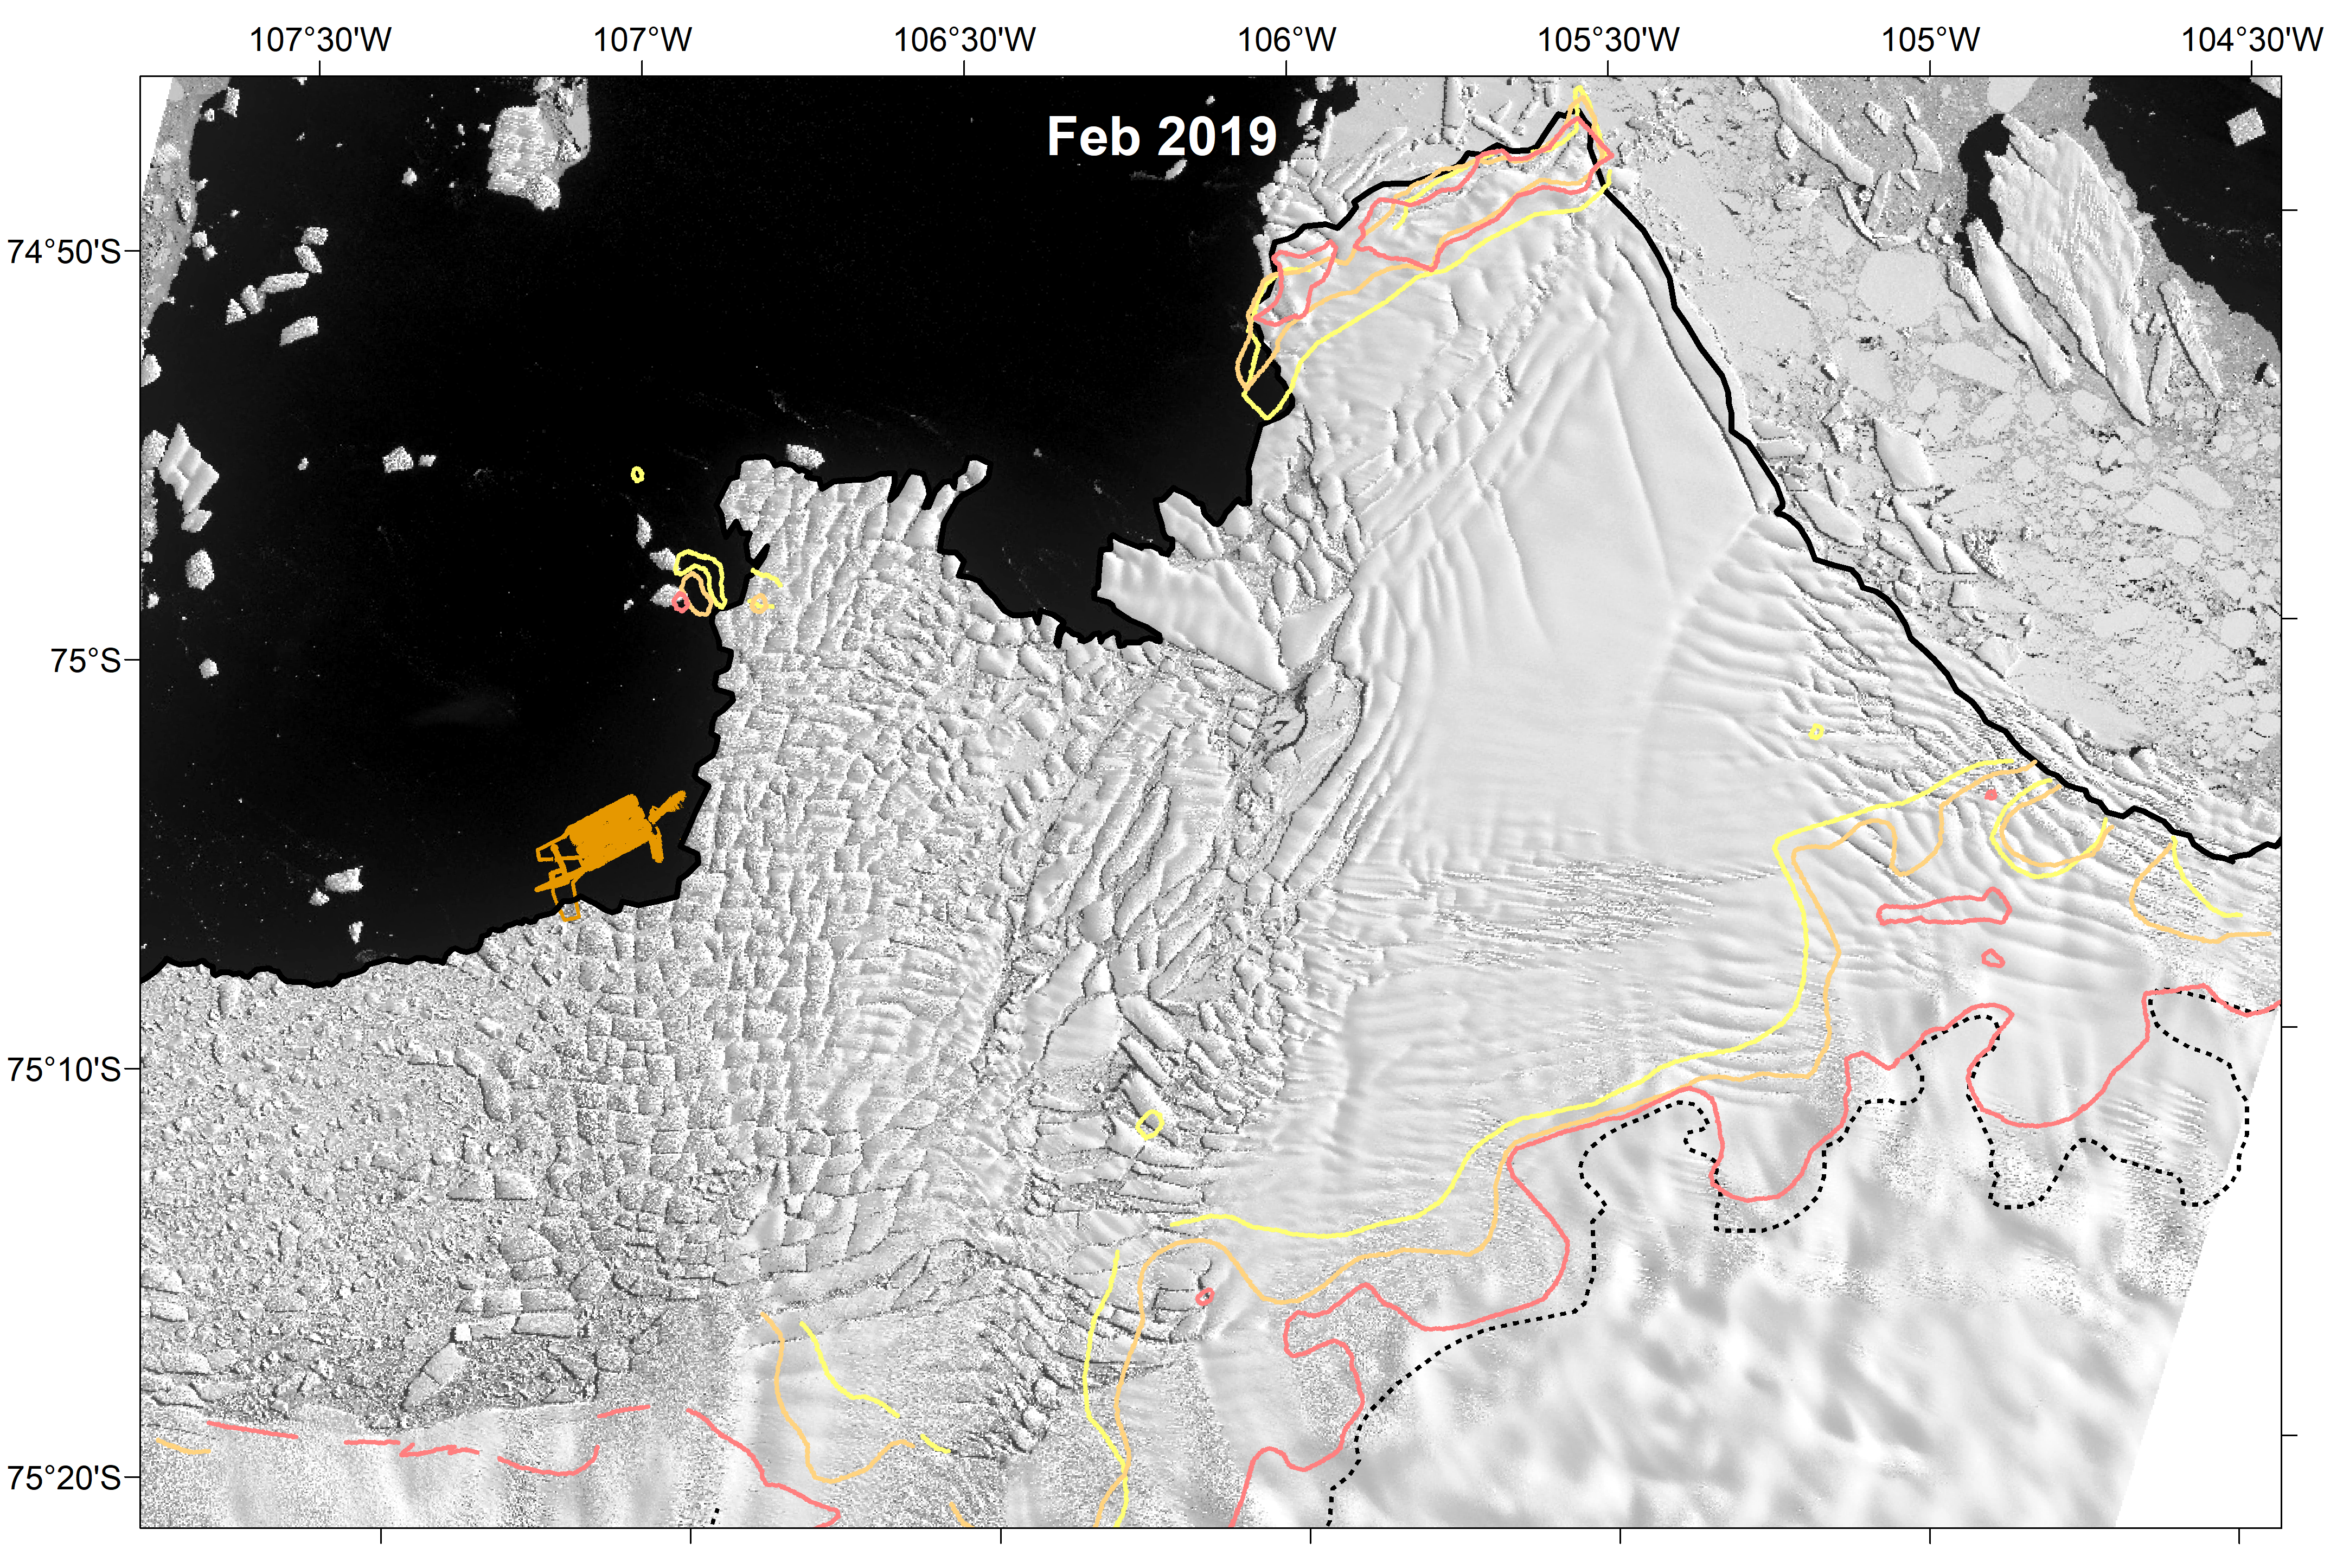
By Li Cohen 6 September 2022 (CBS News) – The loss of a glacier the size of Florida in Antarctica could wreak havoc on the world as scientists expect it would raise global sea levels up to 10 feet. It’s already melting at a fast rate — and scientists say its collapse may only rapidly […]
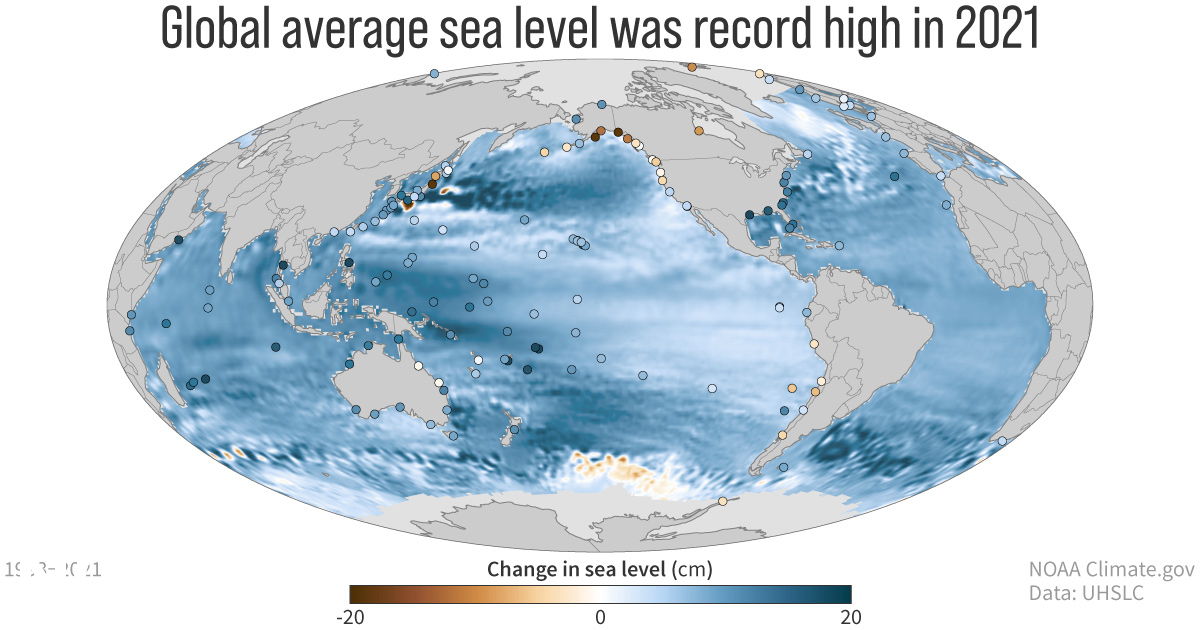
31 August 2022 (NOAA) – Greenhouse gas concentrations, global sea levels and ocean heat content reached record highs in 2021, according to the 32nd annual State of the Climate report. The international annual review of the world’s climate, led by scientists from NOAA’s National Centers for Environmental Information and published by the Bulletin of the […]
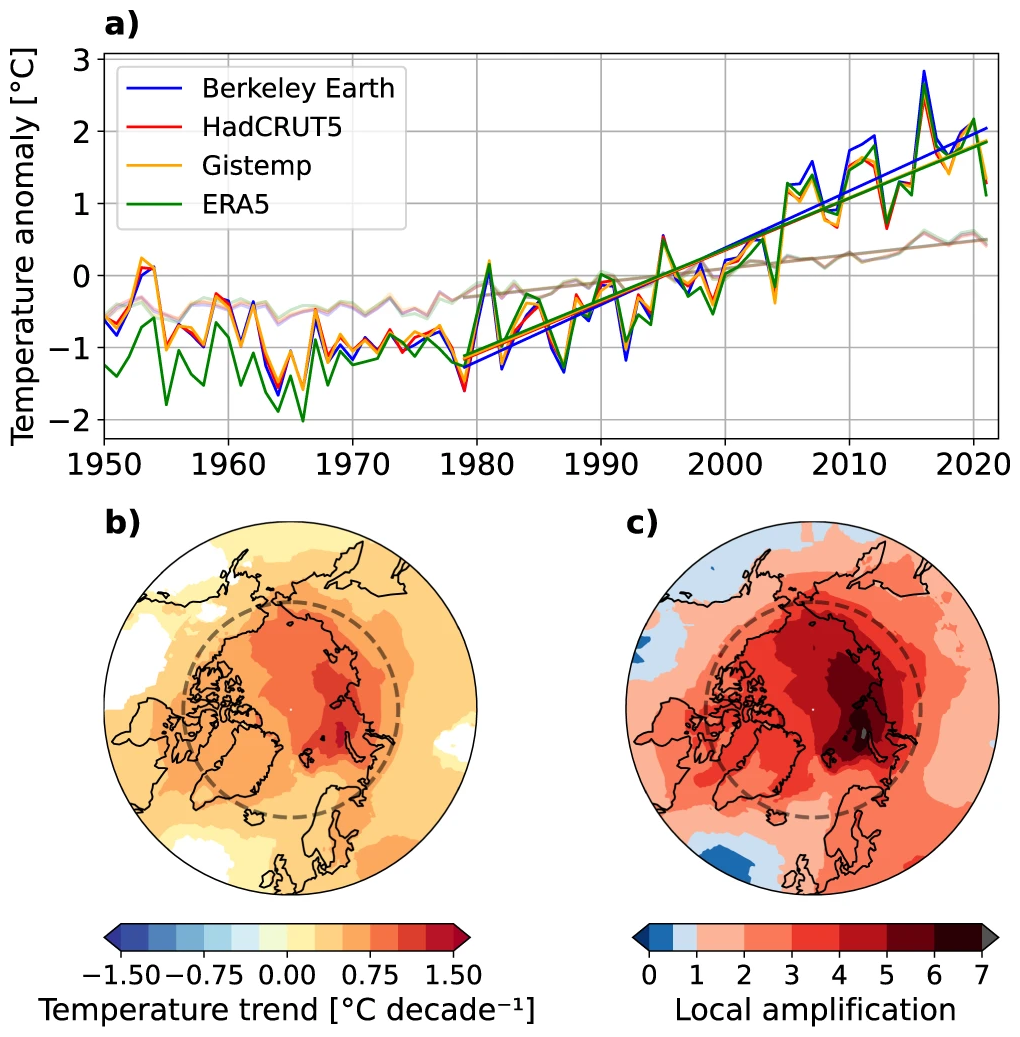
PARIS, 11 August 2022 (AFP) – The Arctic has warmed nearly four times faster than the rest of the planet over the last 40 years, according to research published Thursday that suggests climate models are underestimating the rate of polar heating. The United Nations’ climate science panel said in a special report in 2019 that […]
GENEVA, 18 May 2022 (WMO) – Four key climate change indicators – greenhouse gas concentrations, sea level rise, ocean heat and ocean acidification – set new records in 2021. This is yet another clear sign that human activities are causing planetary scale changes on land, in the ocean, and in the atmosphere, with harmful and […]
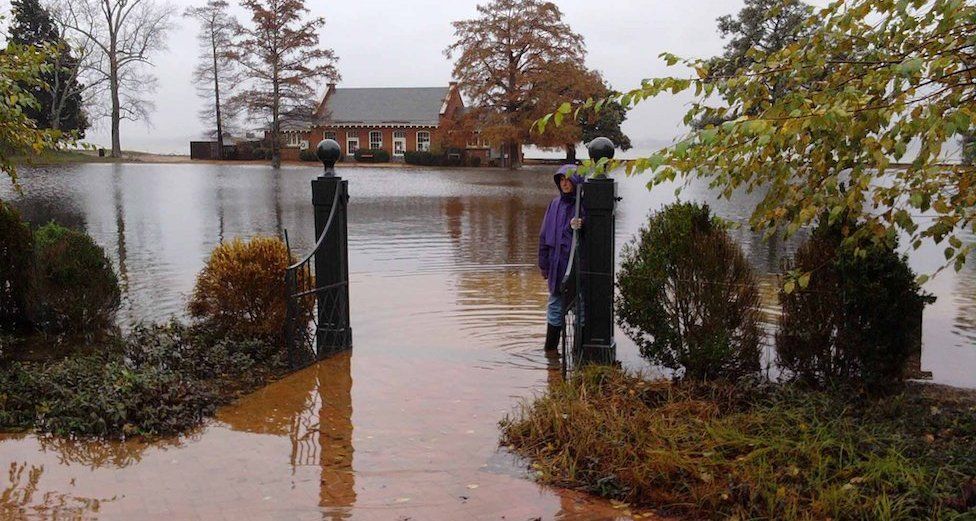
By Jane O’Brien 4 May 2022 JAMESTOWN, Virginia (BBC News) – One of the most important historic sites in America has been put on a list of endangered places. Preservation groups warn that Jamestown, Virginia, may not survive another generation because of climate change. In 1607, the small island near the mouth of the Chesapeake […]