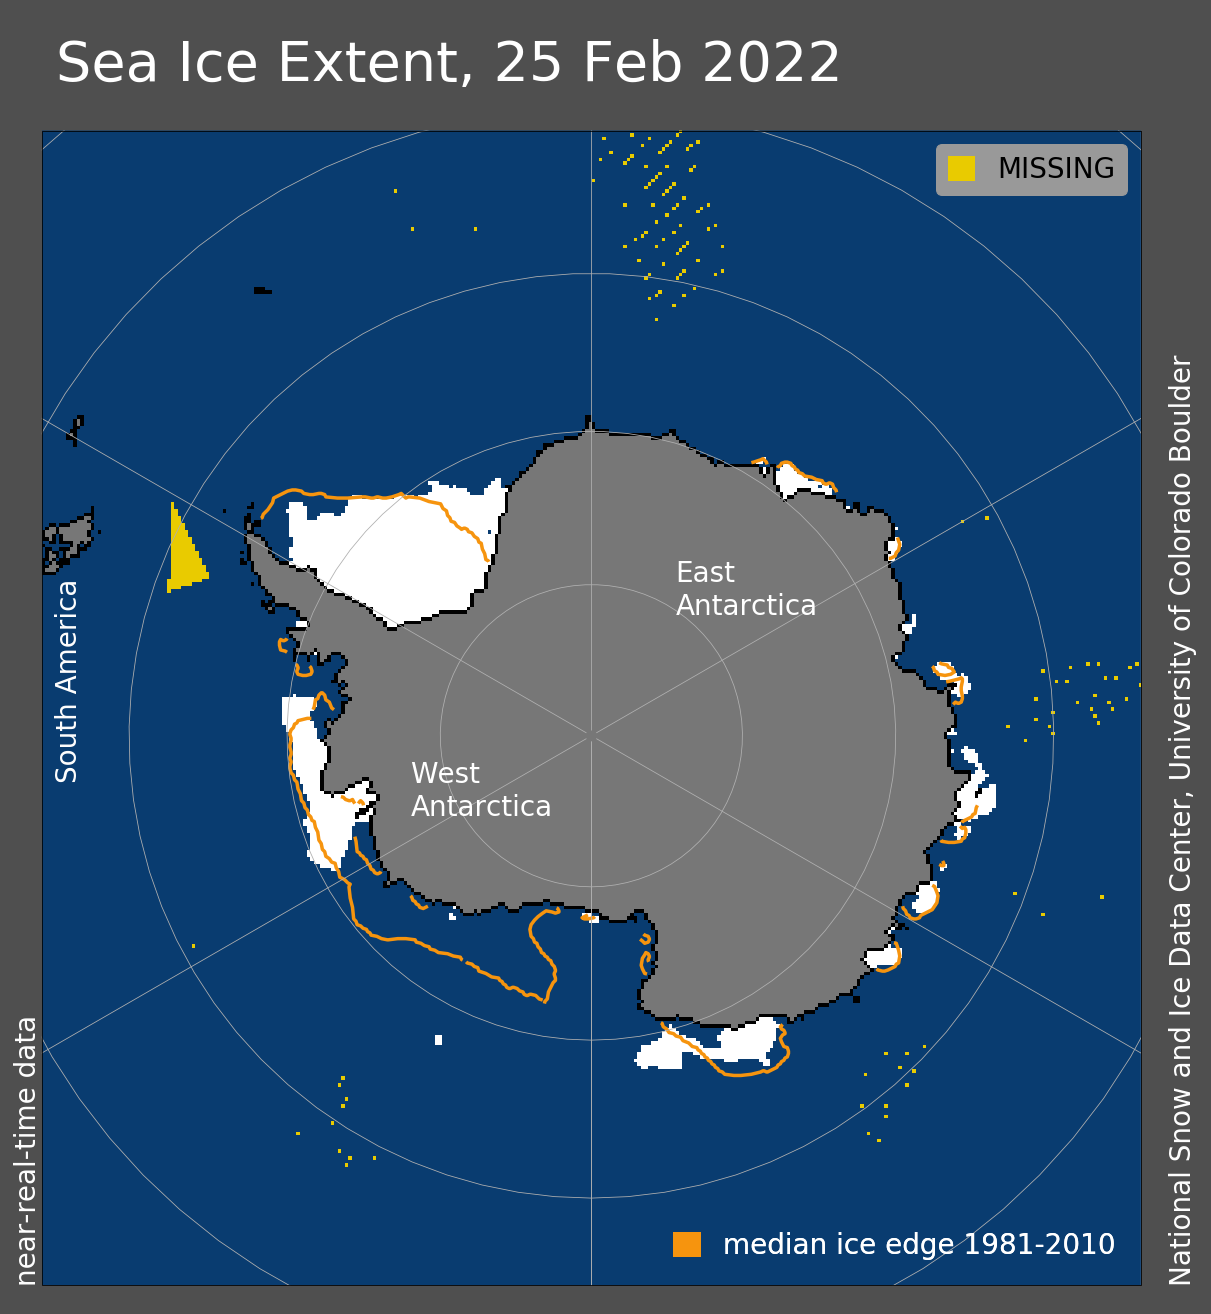
1 April 2022 (WMO) – Record high temperatures, rain and the collapse of an ice shelf in East Antarctica have prompted questions and concern about the possible role of climate change in the coldest and driest part of the world. Record high temperatures, rain and the collapse of an ice shelf in East Antarctica have […]
By Risa Palm and Toby W. Bolsen 25 March 2022 (The Conversation) – Apollo Beach, Florida, is a maze of canals lined with hundreds of houses perched right near the water’s edge. The whole community, just south of Tampa, is only about 3 feet above sea level, meaning it’s at risk from storm surge as […]
By Isla Binnie 25 March 2022 (Reuters) – An East Antarctica ice shelf disintegrated this month following a period of extreme heat in the region, according to scientists. Satellite images show the 1,200 square-kilometre Conger Ice Shelf collapsed completely on or around March 15. “Possible it hit its tipping point following the #Antarctic #AtmosphericRiver and […]
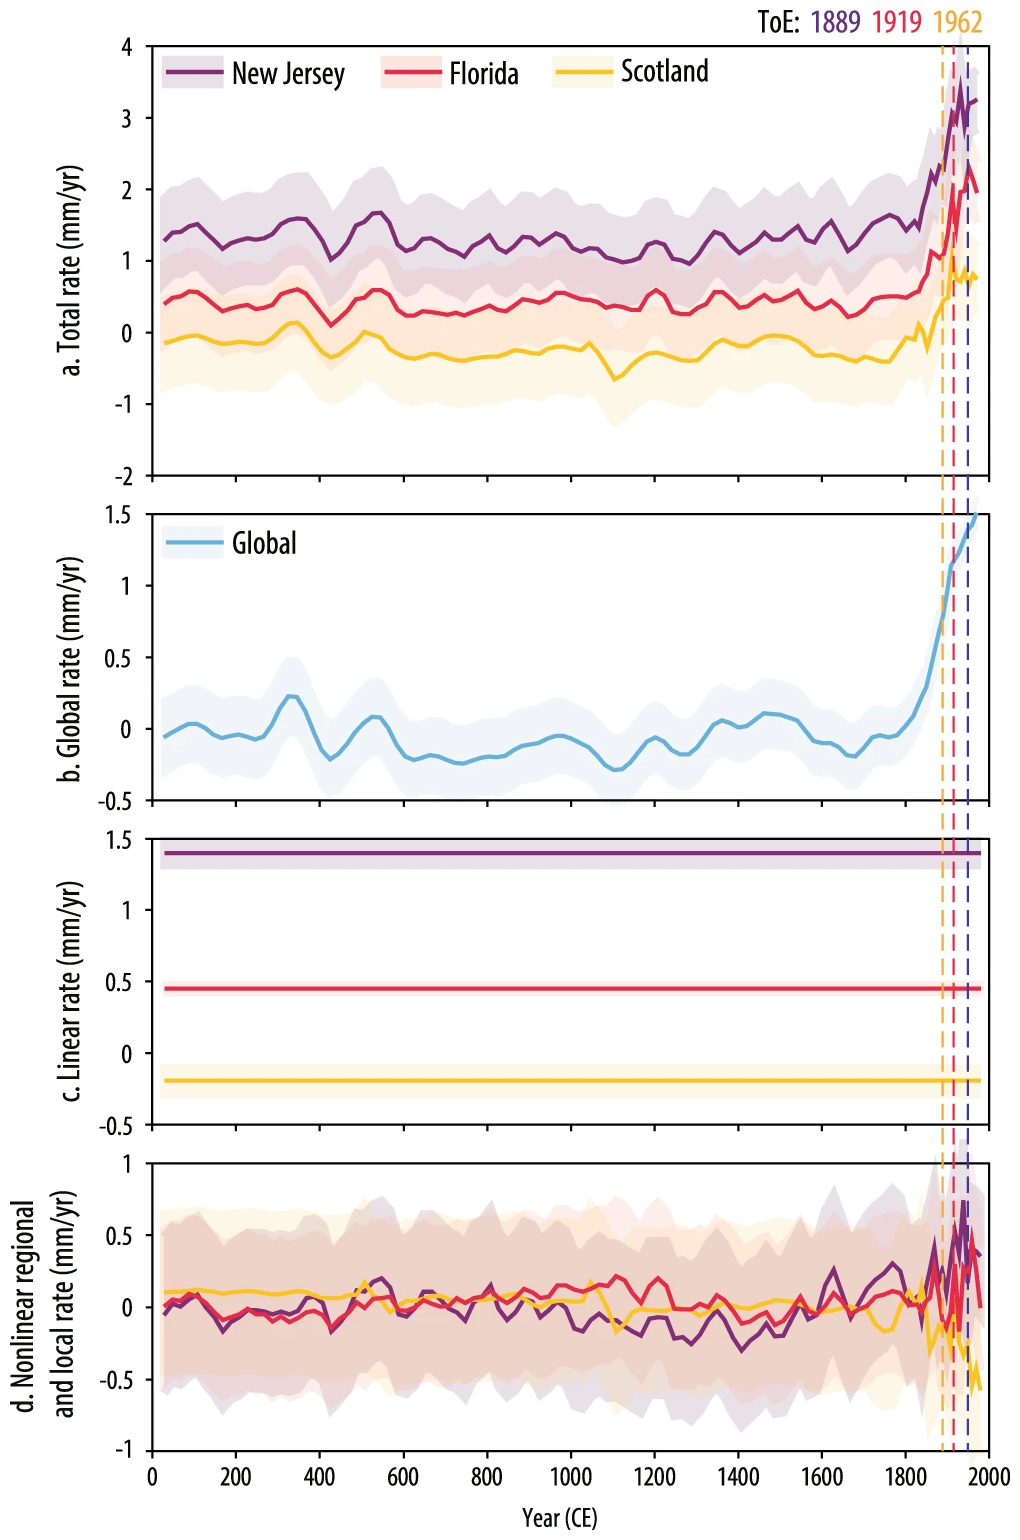
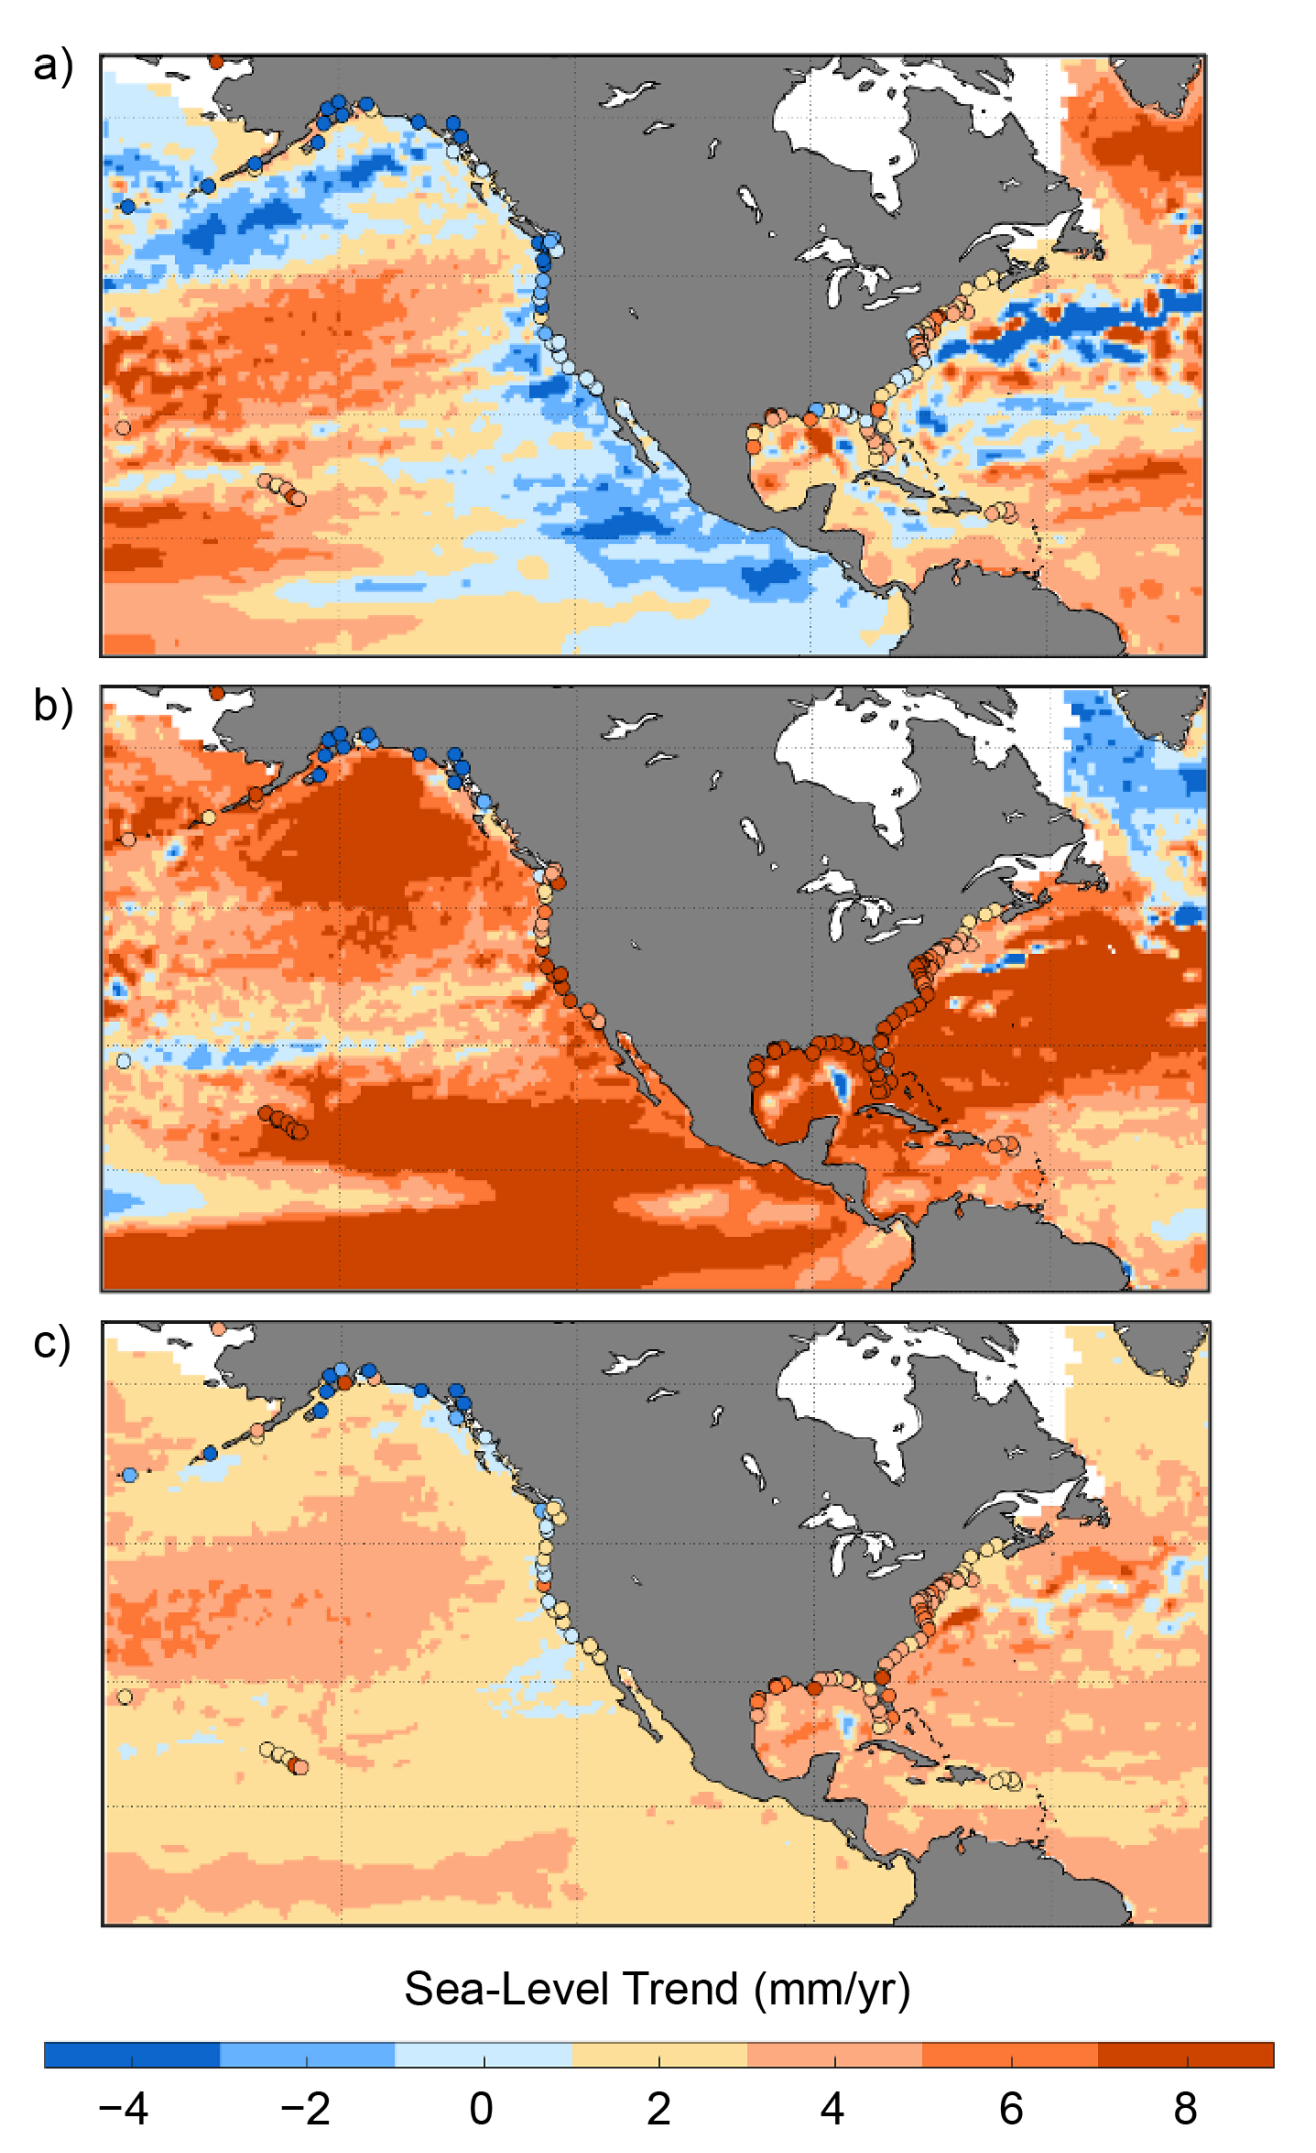
18 February 2022 (Rutgers University) – An international team of scientists including Rutgers researchers has found that modern rates of sea level rise began emerging in 1863 as the Industrial Age intensified, coinciding with evidence for early ocean warming and glacier melt. The study, which used a global database of sea-level records spanning the last […]
15 February 2022 (NOAA) – The United States is expected to experience as much sea level rise by the year 2050 as it witnessed in the previous hundred years. That’s according to a NOAA-led report updating sea level rise decision-support information for the U.S. released today in partnership with half a dozen other federal agencies. […]
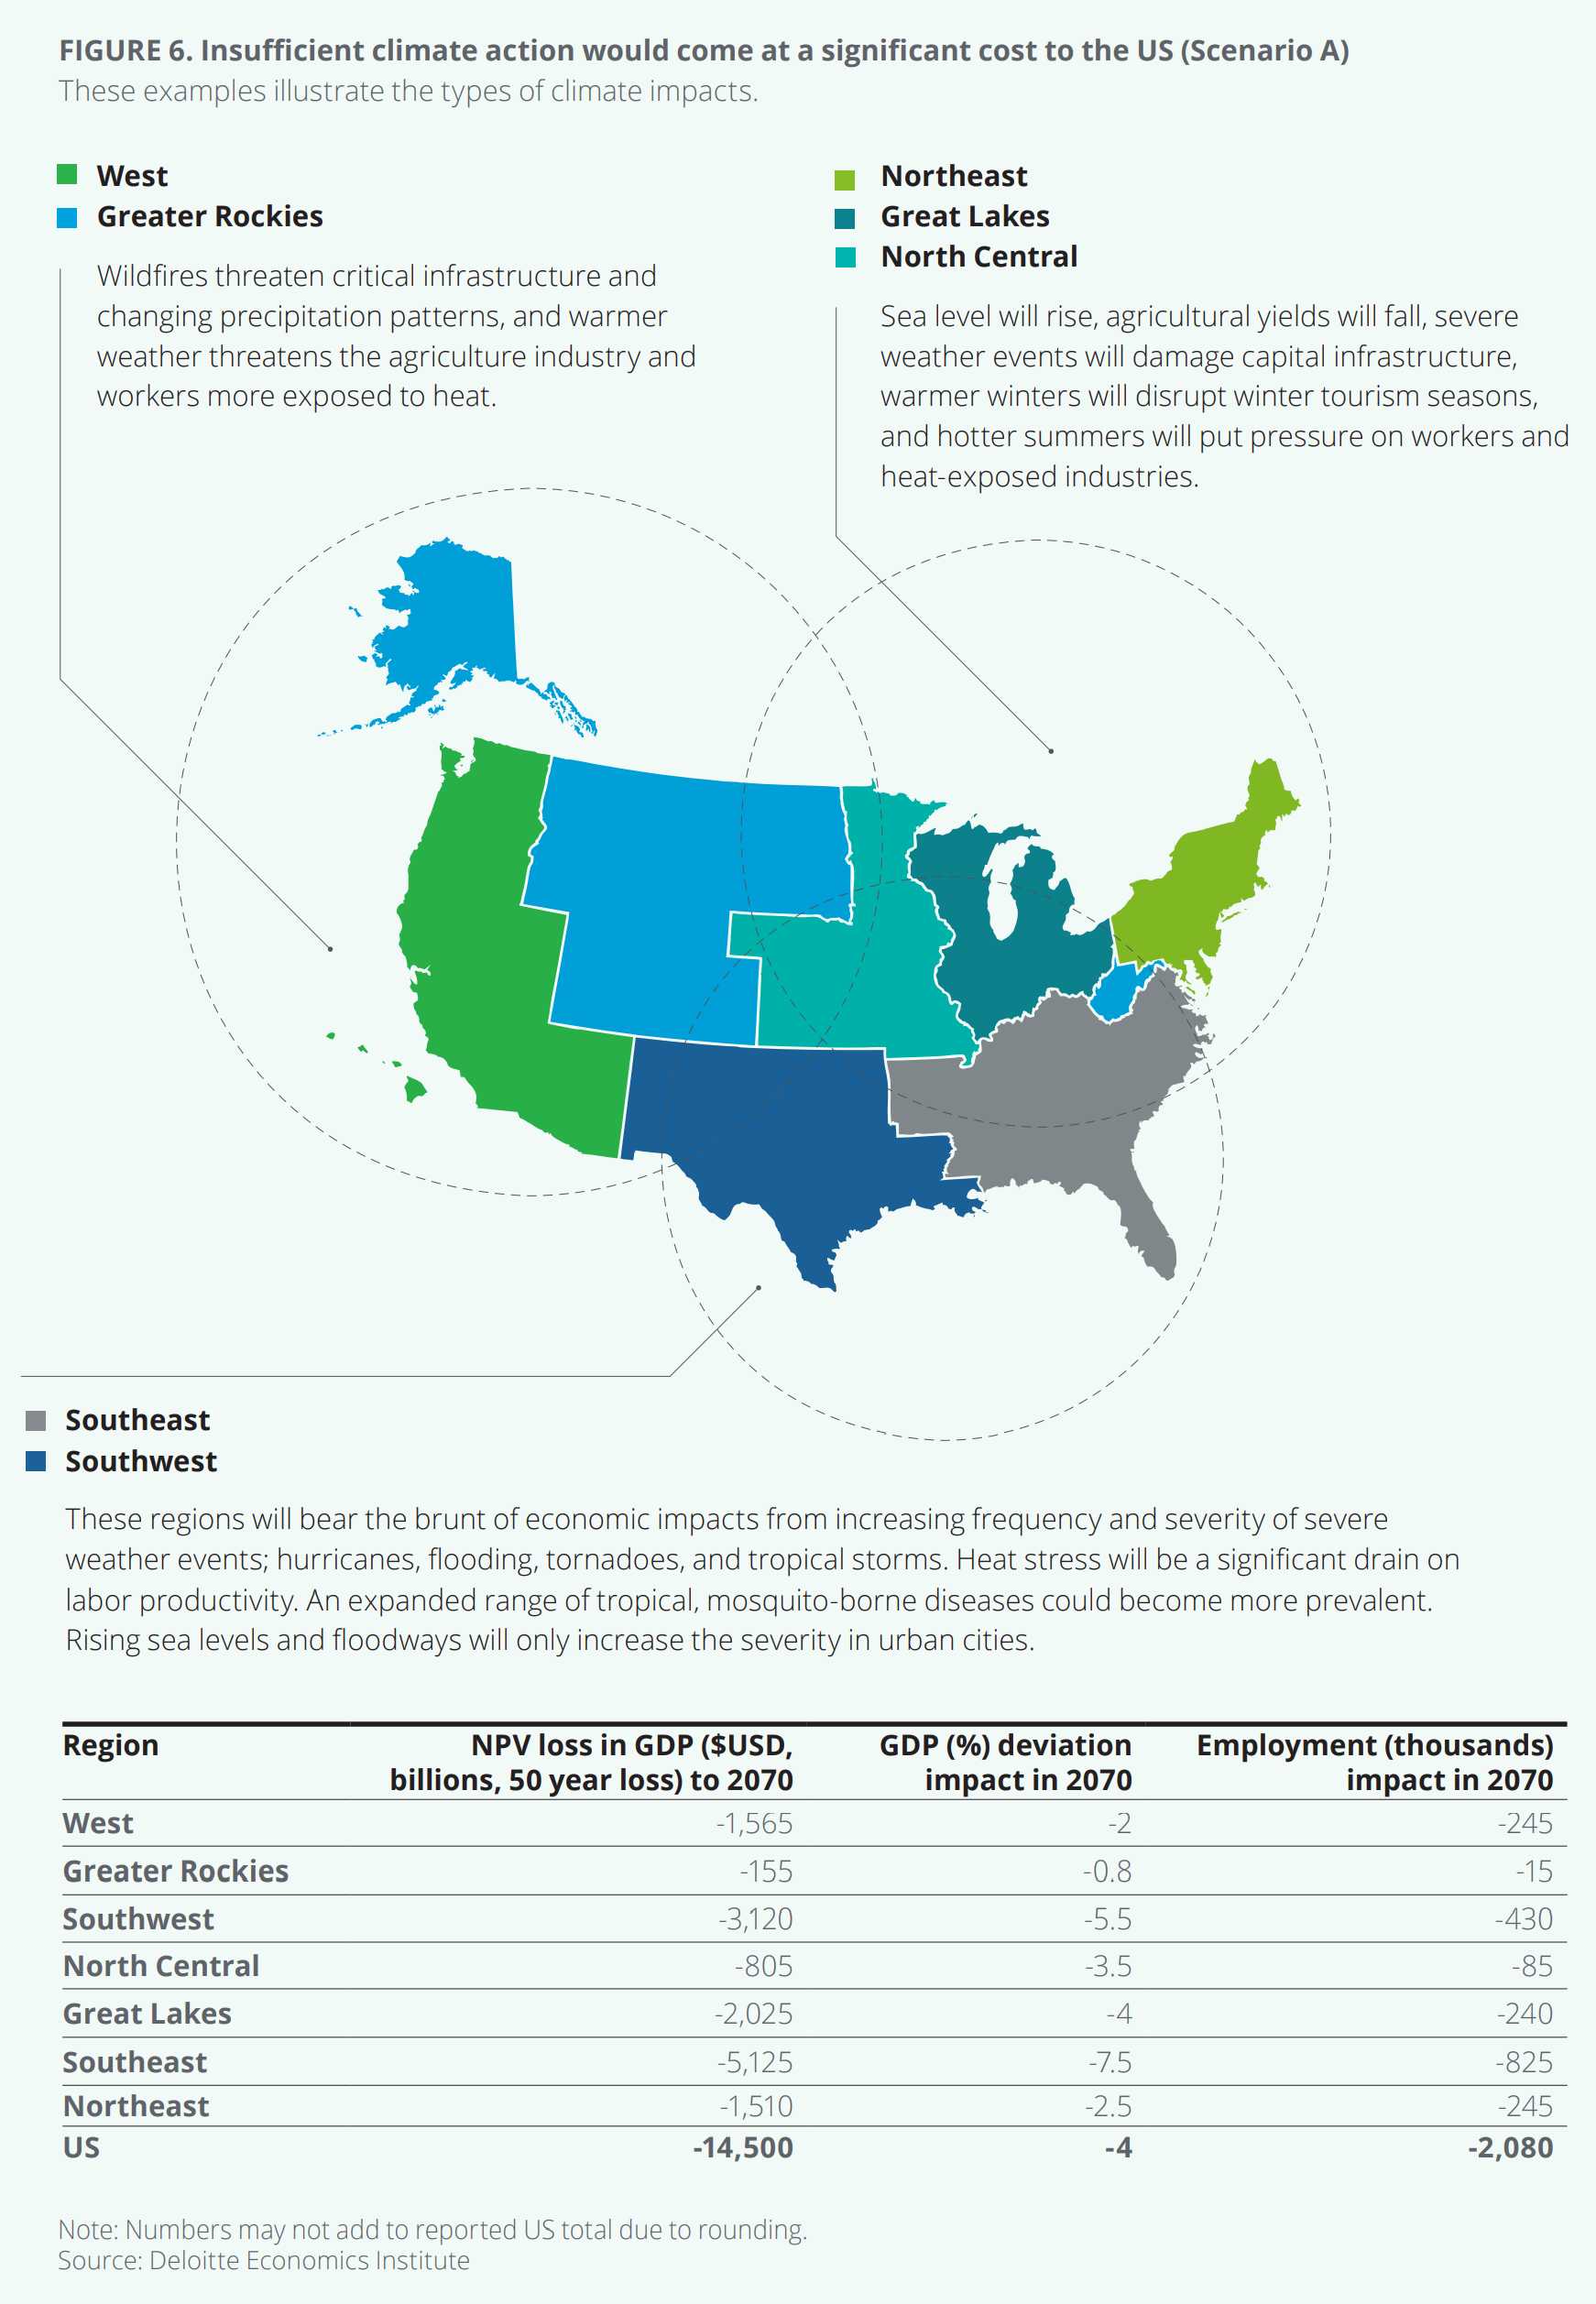
By Rachel Koning Beals 26 January 2022 (MarketWatch) – Definitive and deliberate climate action from Wall Street to Washington and beyond could deliver a $3 trillion gain to the U.S. economy over the next 50 years to 2070. But it’s the toll of inaction that would cost the nation nearly five times that amount, a […]
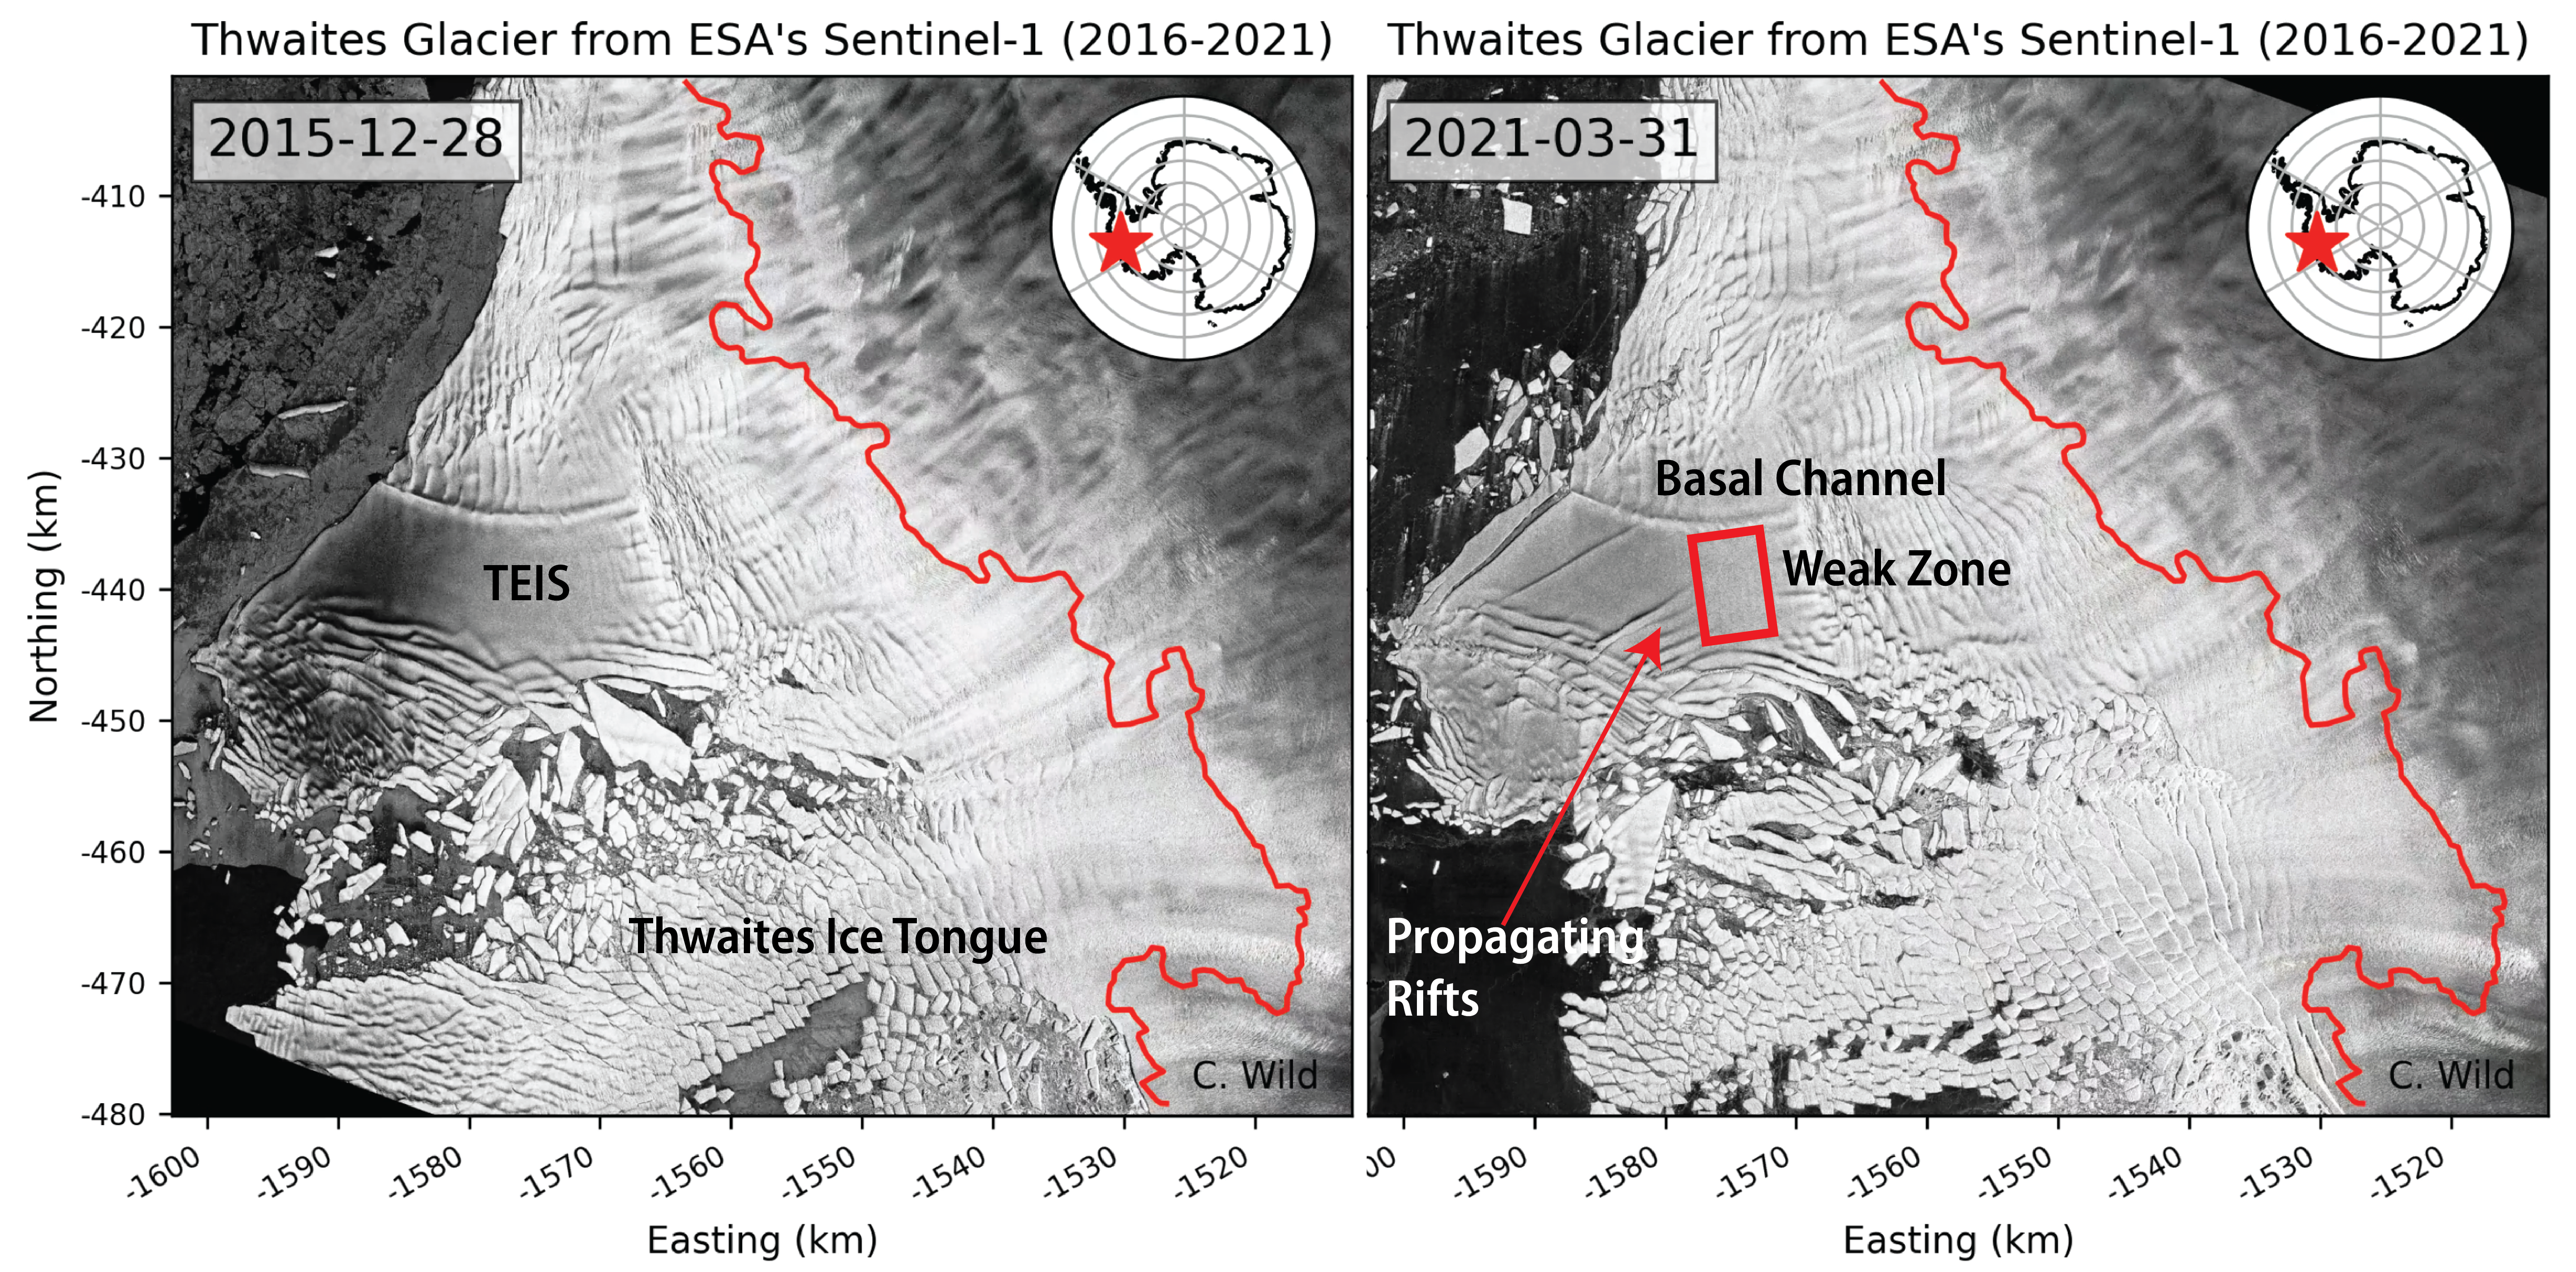
By Ella Gilbert 22 December 2021 (The Conversation) – The massive Thwaites glacier in West Antarctica contains enough ice to raise global sea levels by 65 centimeters if it were to completely collapse. And, worryingly, recent research suggests that its long-term stability is doubtful as the glacier haemorrhages more and more ice. Adding 65 centimeters to global sea levels […]
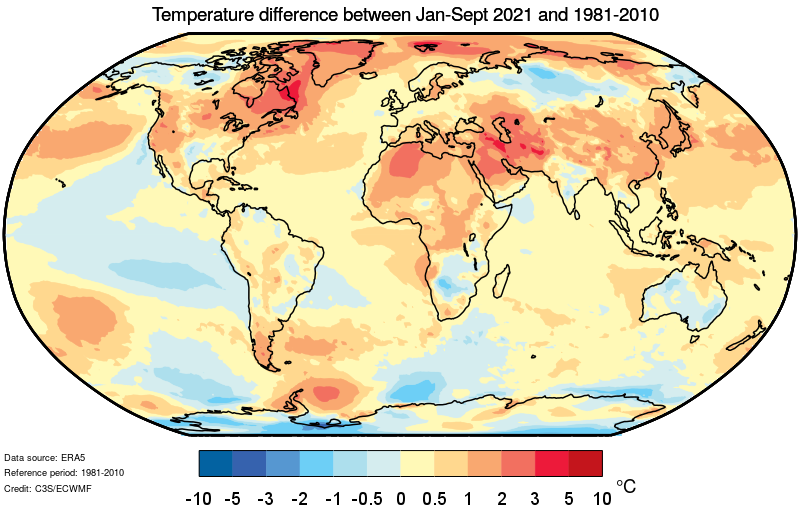
GENEVA, 31 October 2021 (WMO) – Record atmospheric greenhouse gas concentrations and associated accumulated heat have propelled the planet into uncharted territory, with far-reaching repercussions for current and future generations, according to the World Meteorological Organization (WMO). The past seven years are on track to be the seven warmest on record, according to the provisional WMO […]
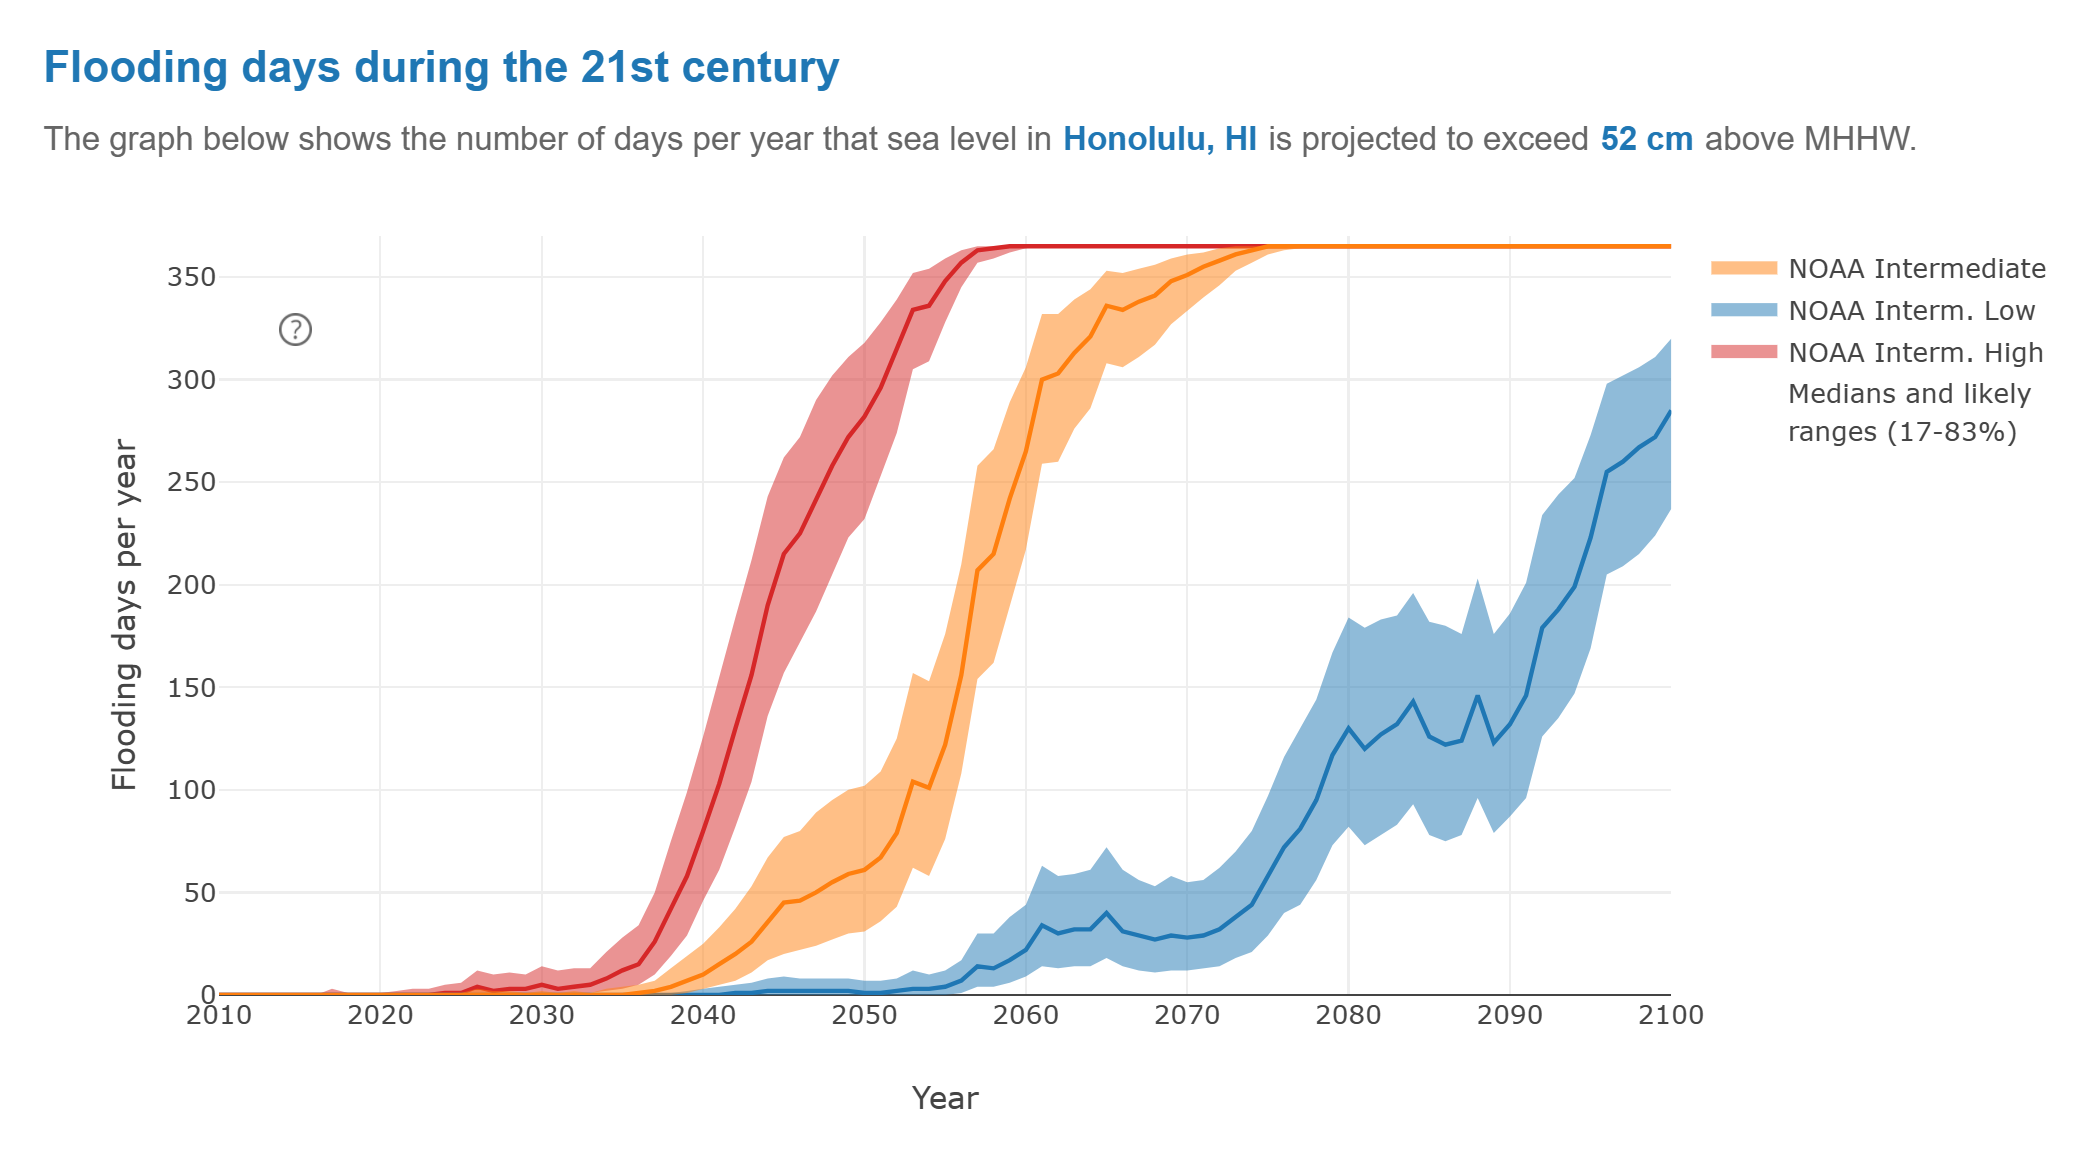
By Jim Morrison 2 August 2021 (WIRED) – During the summer of 2017, the tide rose to historic heights again and again in Honolulu, higher than at any time in the 112 years that records had been kept. Philip Thompson, director of the Sea Level Center at the University of Hawaii, wanted to know why. […]
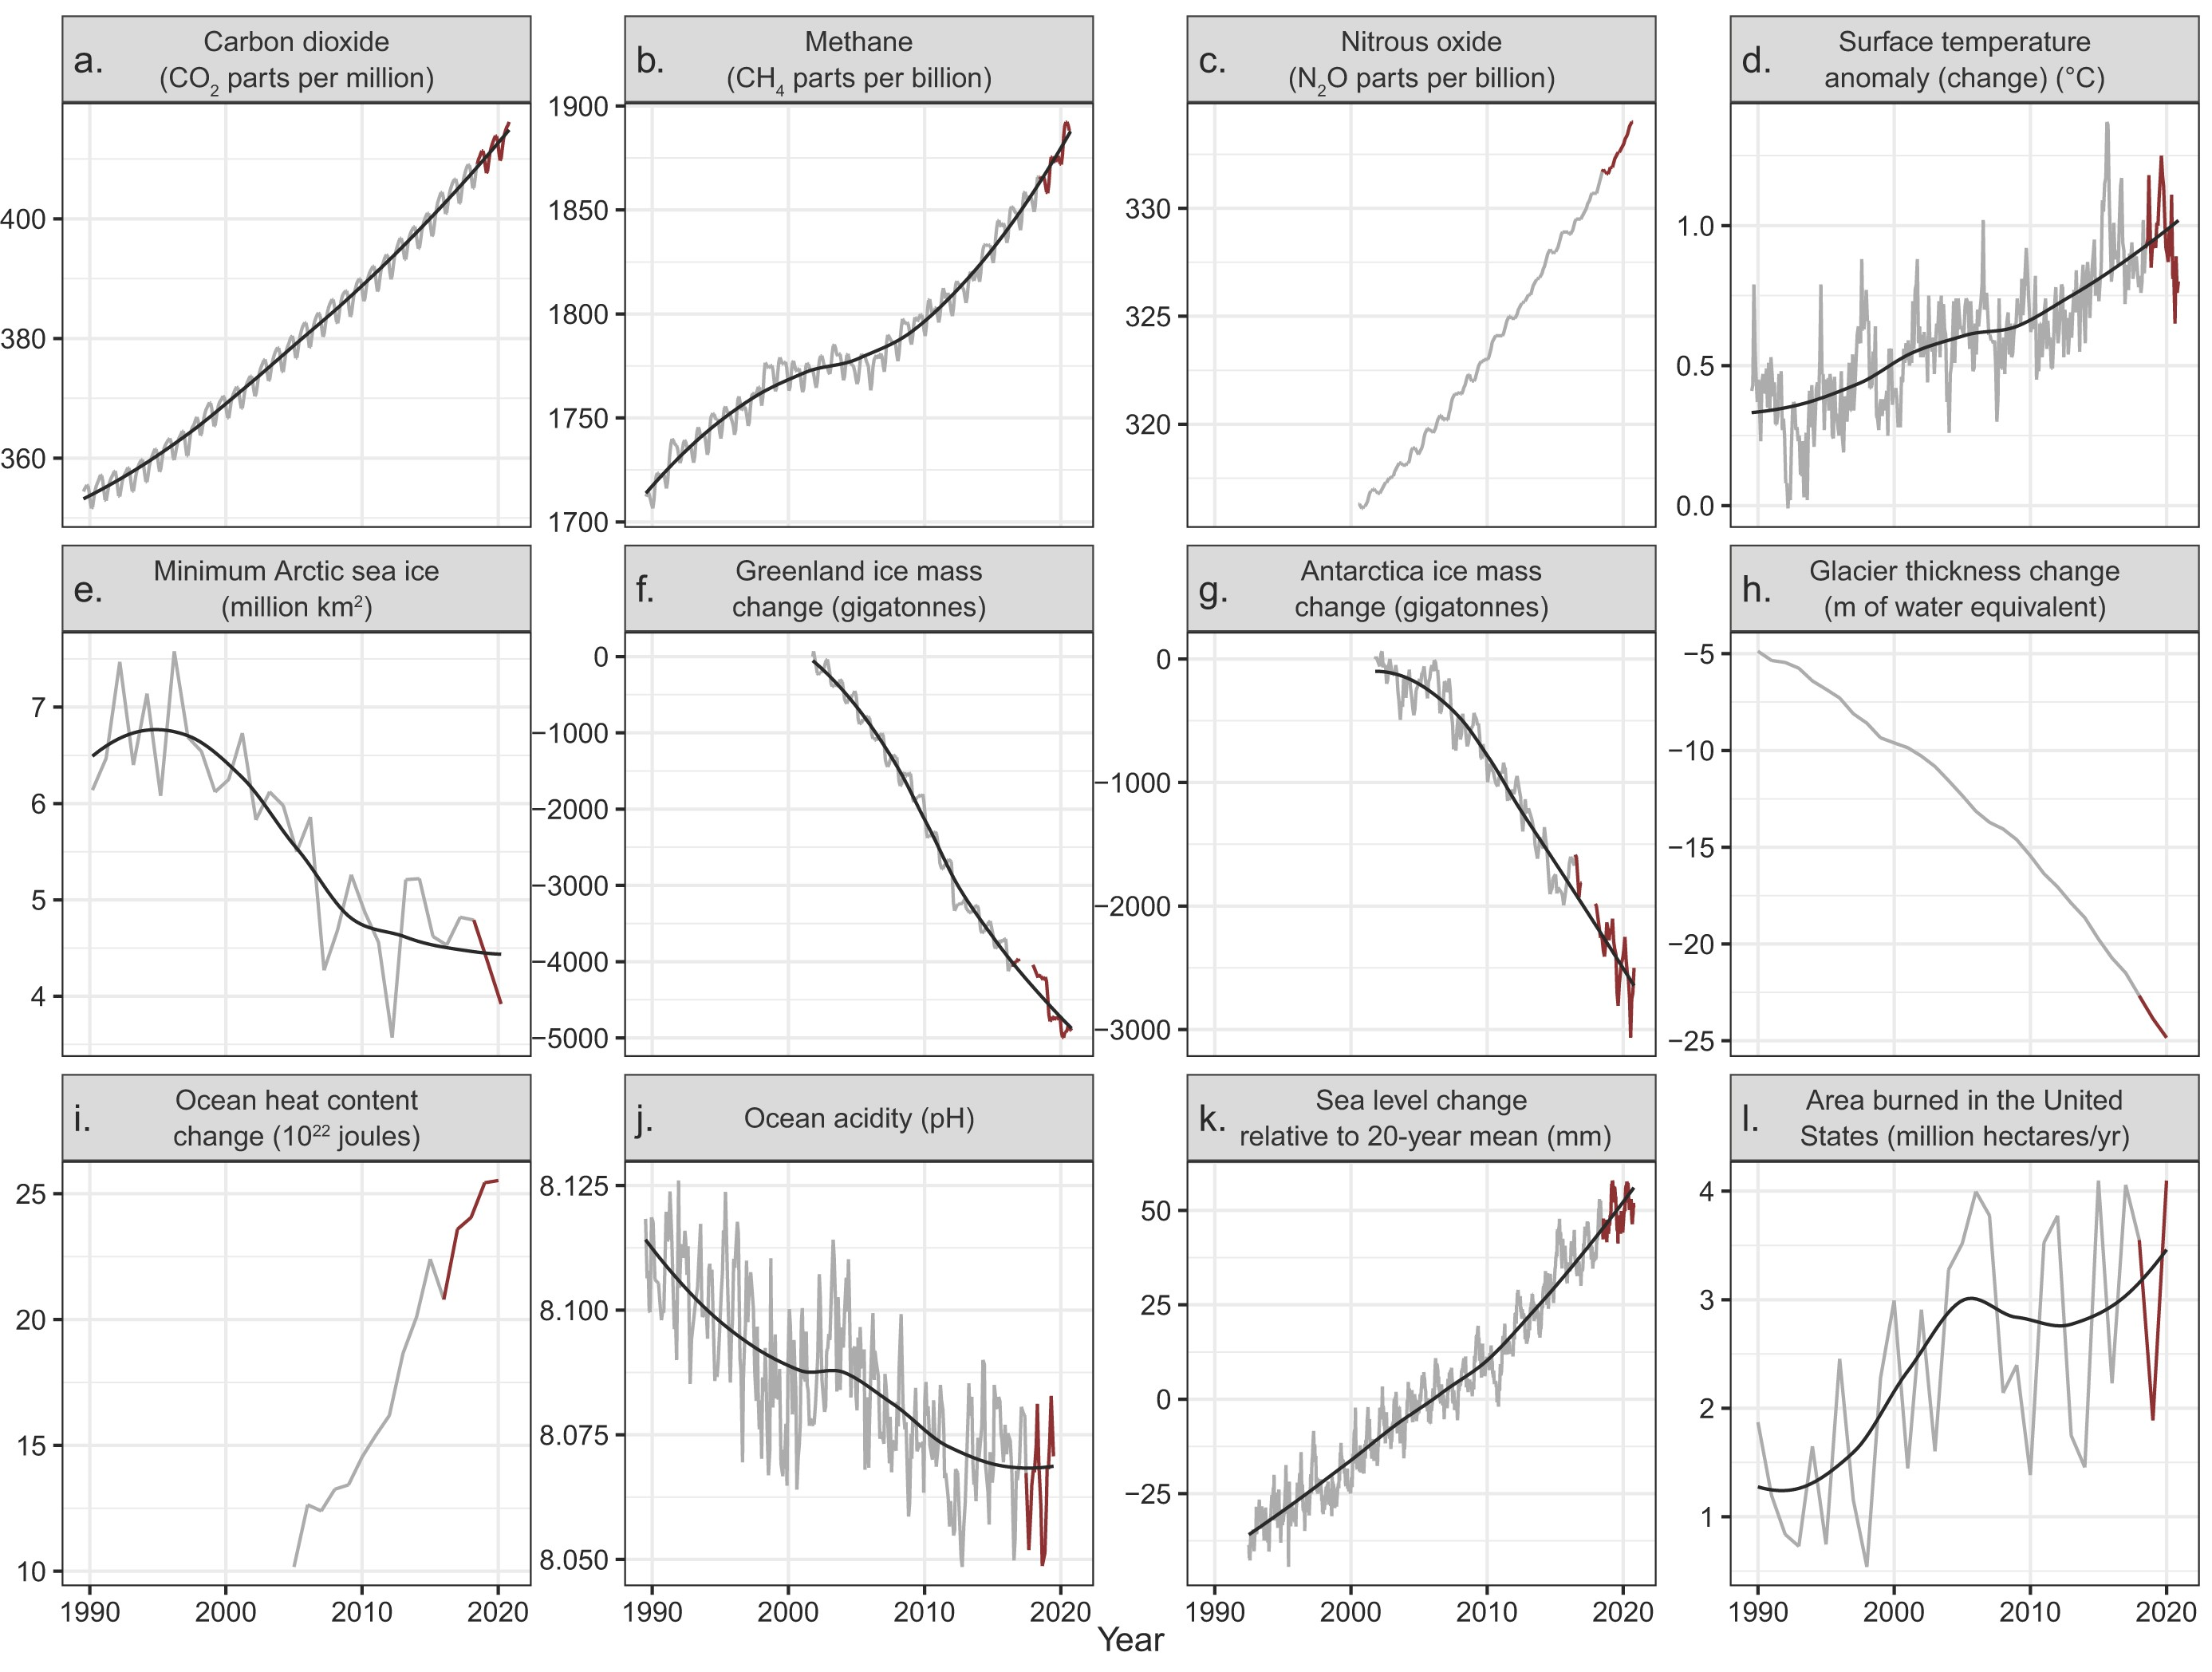
28 July 2021 (BioScience) – In 2019, Ripple and colleagues (2020) warned of untold suffering and declared a climate emergency together with more than 11,000 scientist signatories from 153 countries. They presented graphs of planetary vital signs indicating very troubling trends, along with little progress by humanity to address climate change. On the basis of […]