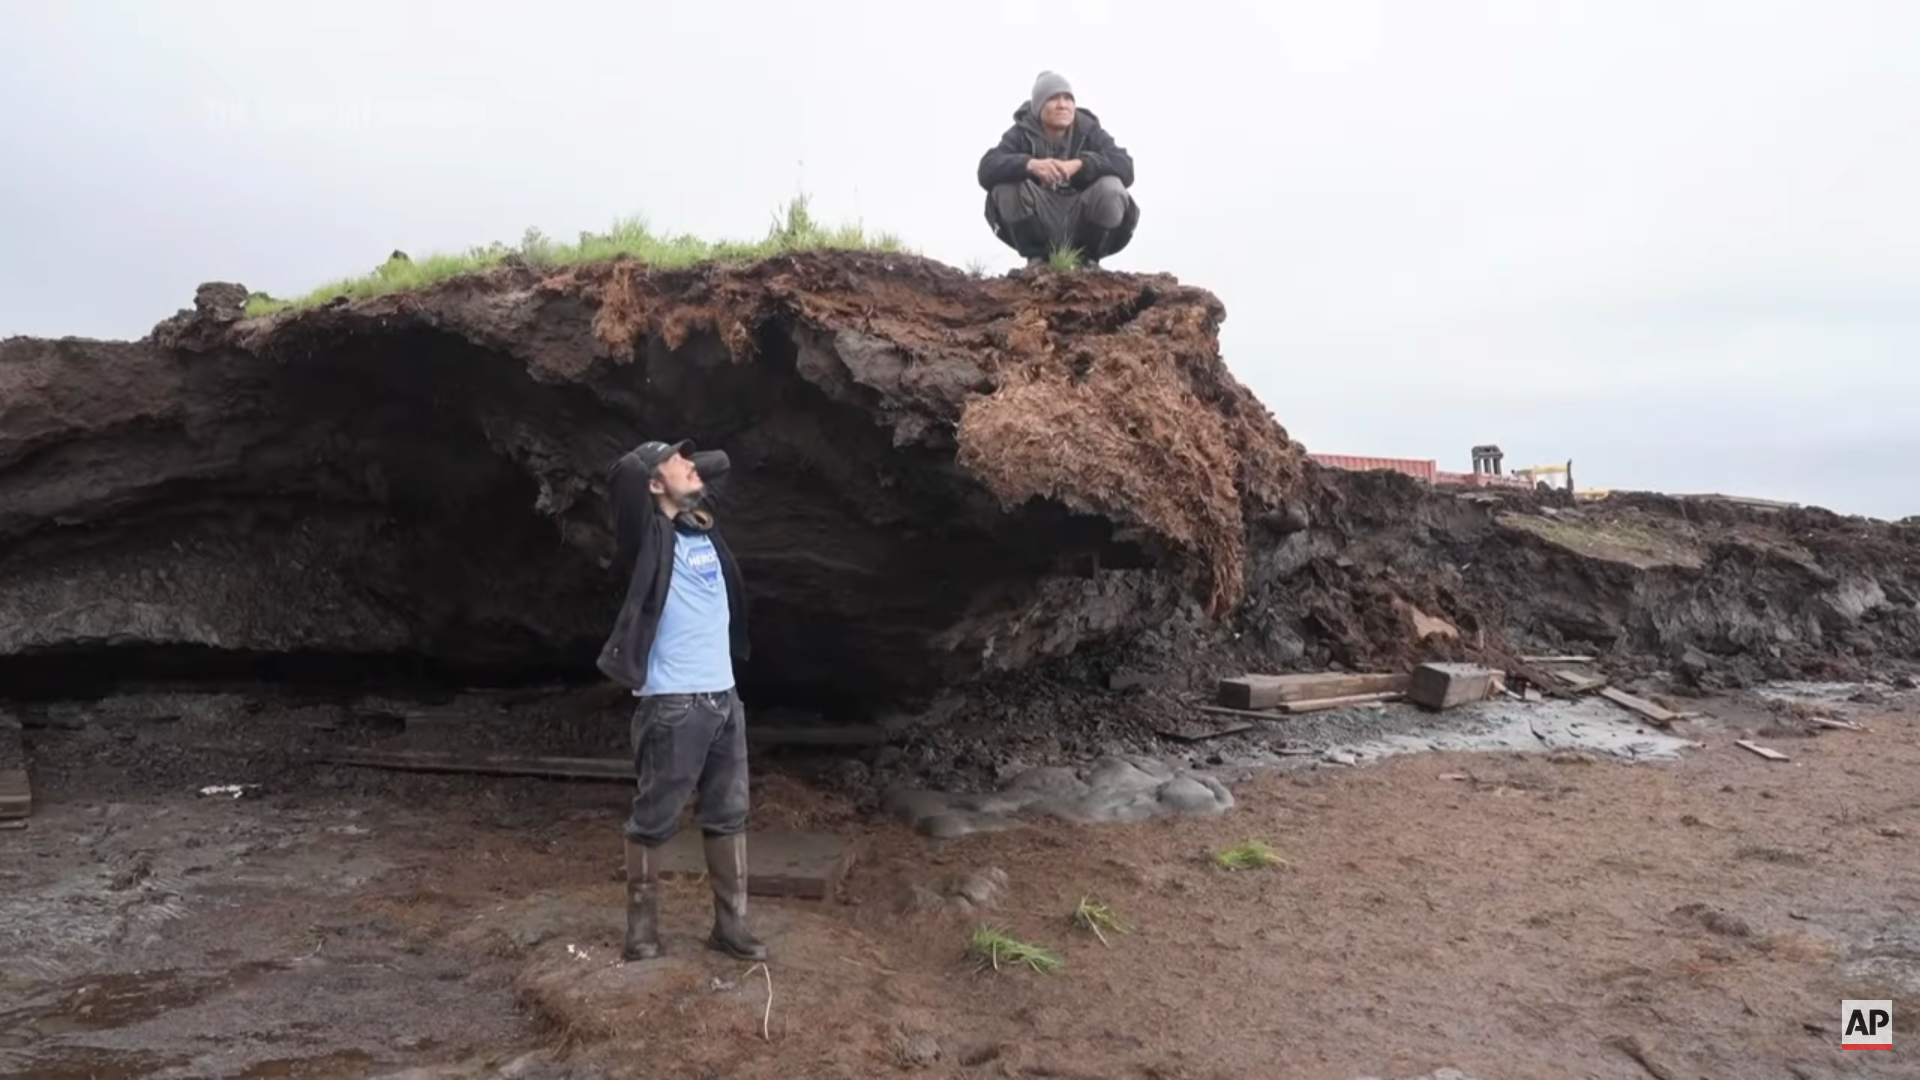
By Rick Bowmer and Mark Thiessen 28 September 2024 MERTARVIK, Alaska (AP) – Growing up along the banks of the Ninglick River in western Alaska, Ashley Tom would look out of her window after strong storms from the Bering Sea hit her village and notice something unsettling: the riverbank was creeping ever closer. It was […]
By Leslie Postal 5 July 2024 (Orlando Sentinel) – Textbook authors were told last month that some references to “climate change” must be removed from science books before they could be accepted for use in Florida’s public schools, according to two of those authors. A high school biology book also had to add citations to […]
By Scott Cohn 2 July 2024 (CNBC) – An insurance crisis that has sent premiums skyrocketing and caused carriers to flee coastal states like Florida and California is spreading, and it is fundamentally changing the real estate market in states across the country. “Not only is the cost higher than people anticipated, but just the inability to […]
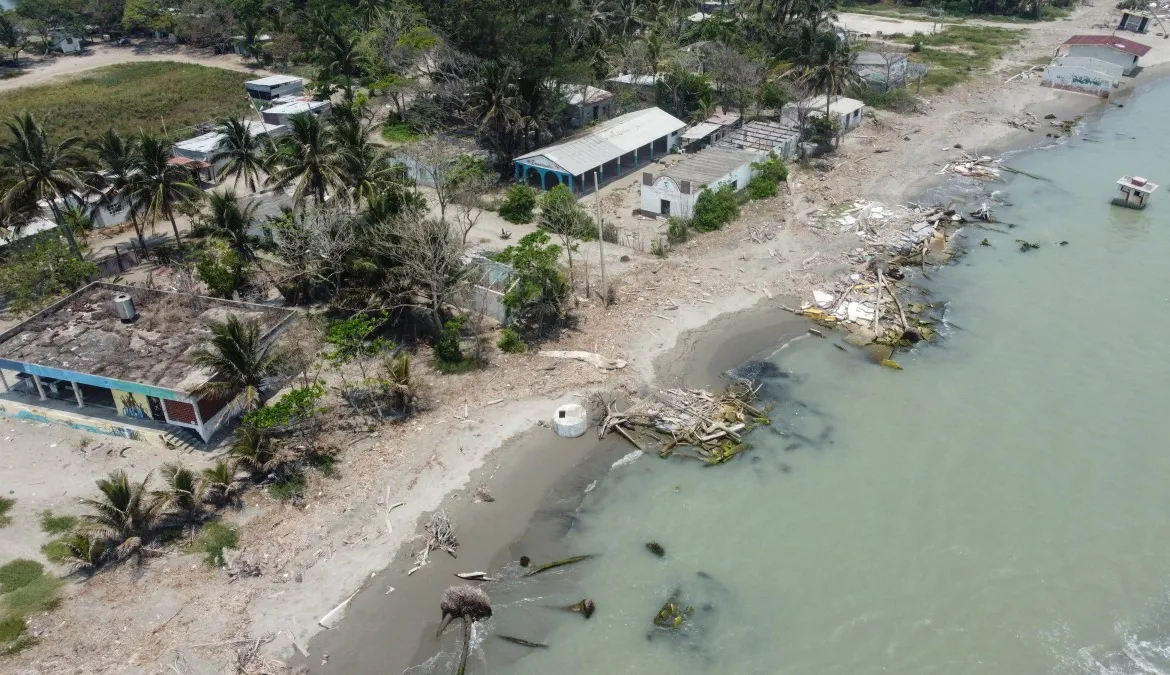
28 May 2024 (Al Jazeera) – Waves wash over abandoned homes in a Mexican village slowly being swallowed by the sea; a symbol of the climate change effects being felt by the major fossil fuel producer. The school where Adrian Perez used to attend classes in the community of El Bosque in the southern state […]
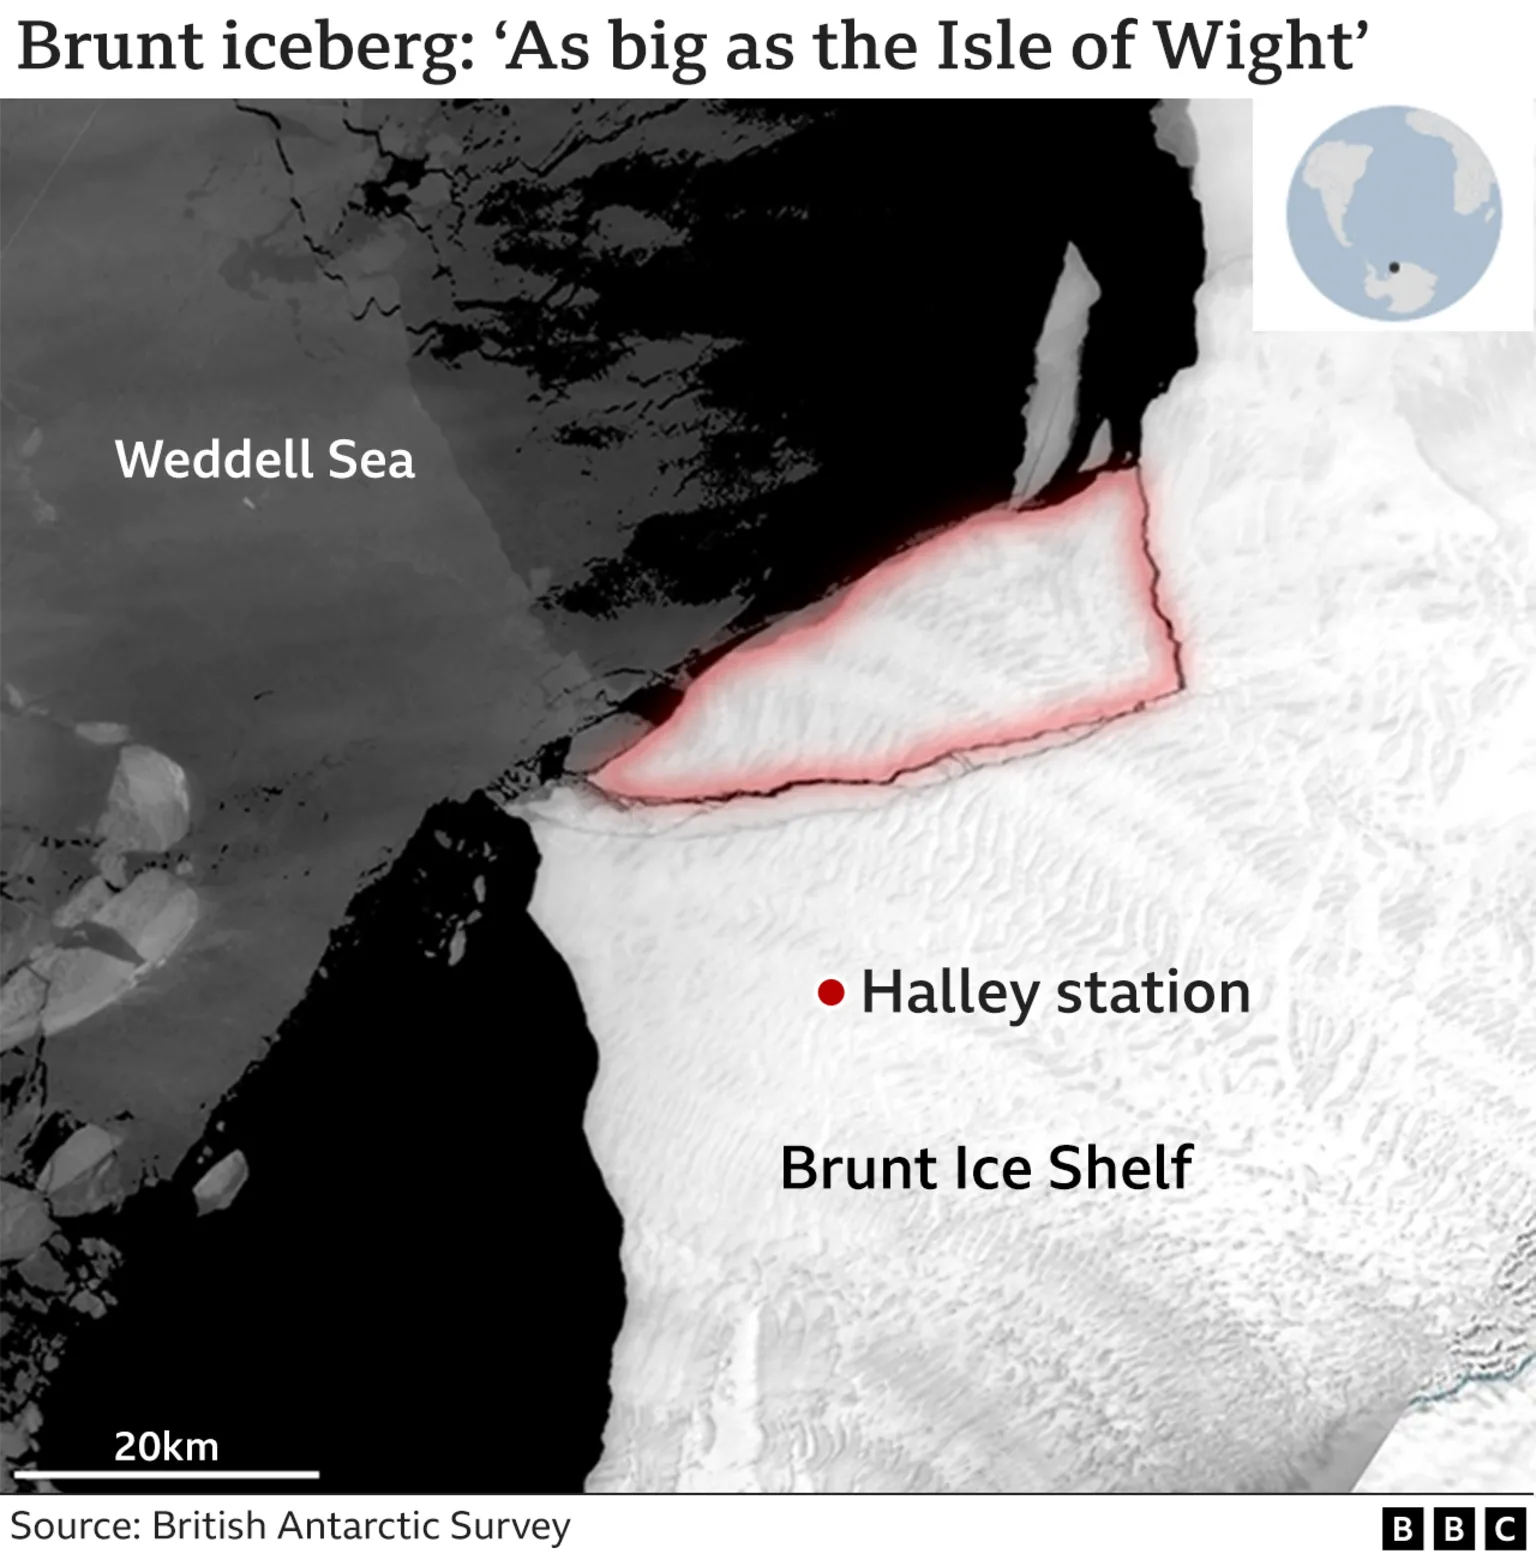
By Jonathan Amos 21 May 2024 (BBC News) – Another big iceberg has broken away from an area of the Antarctic that hosts the UK’s Halley research station. It is the third such block to calve near the base in the past three years. This new one is not quite as large, but still measures […]
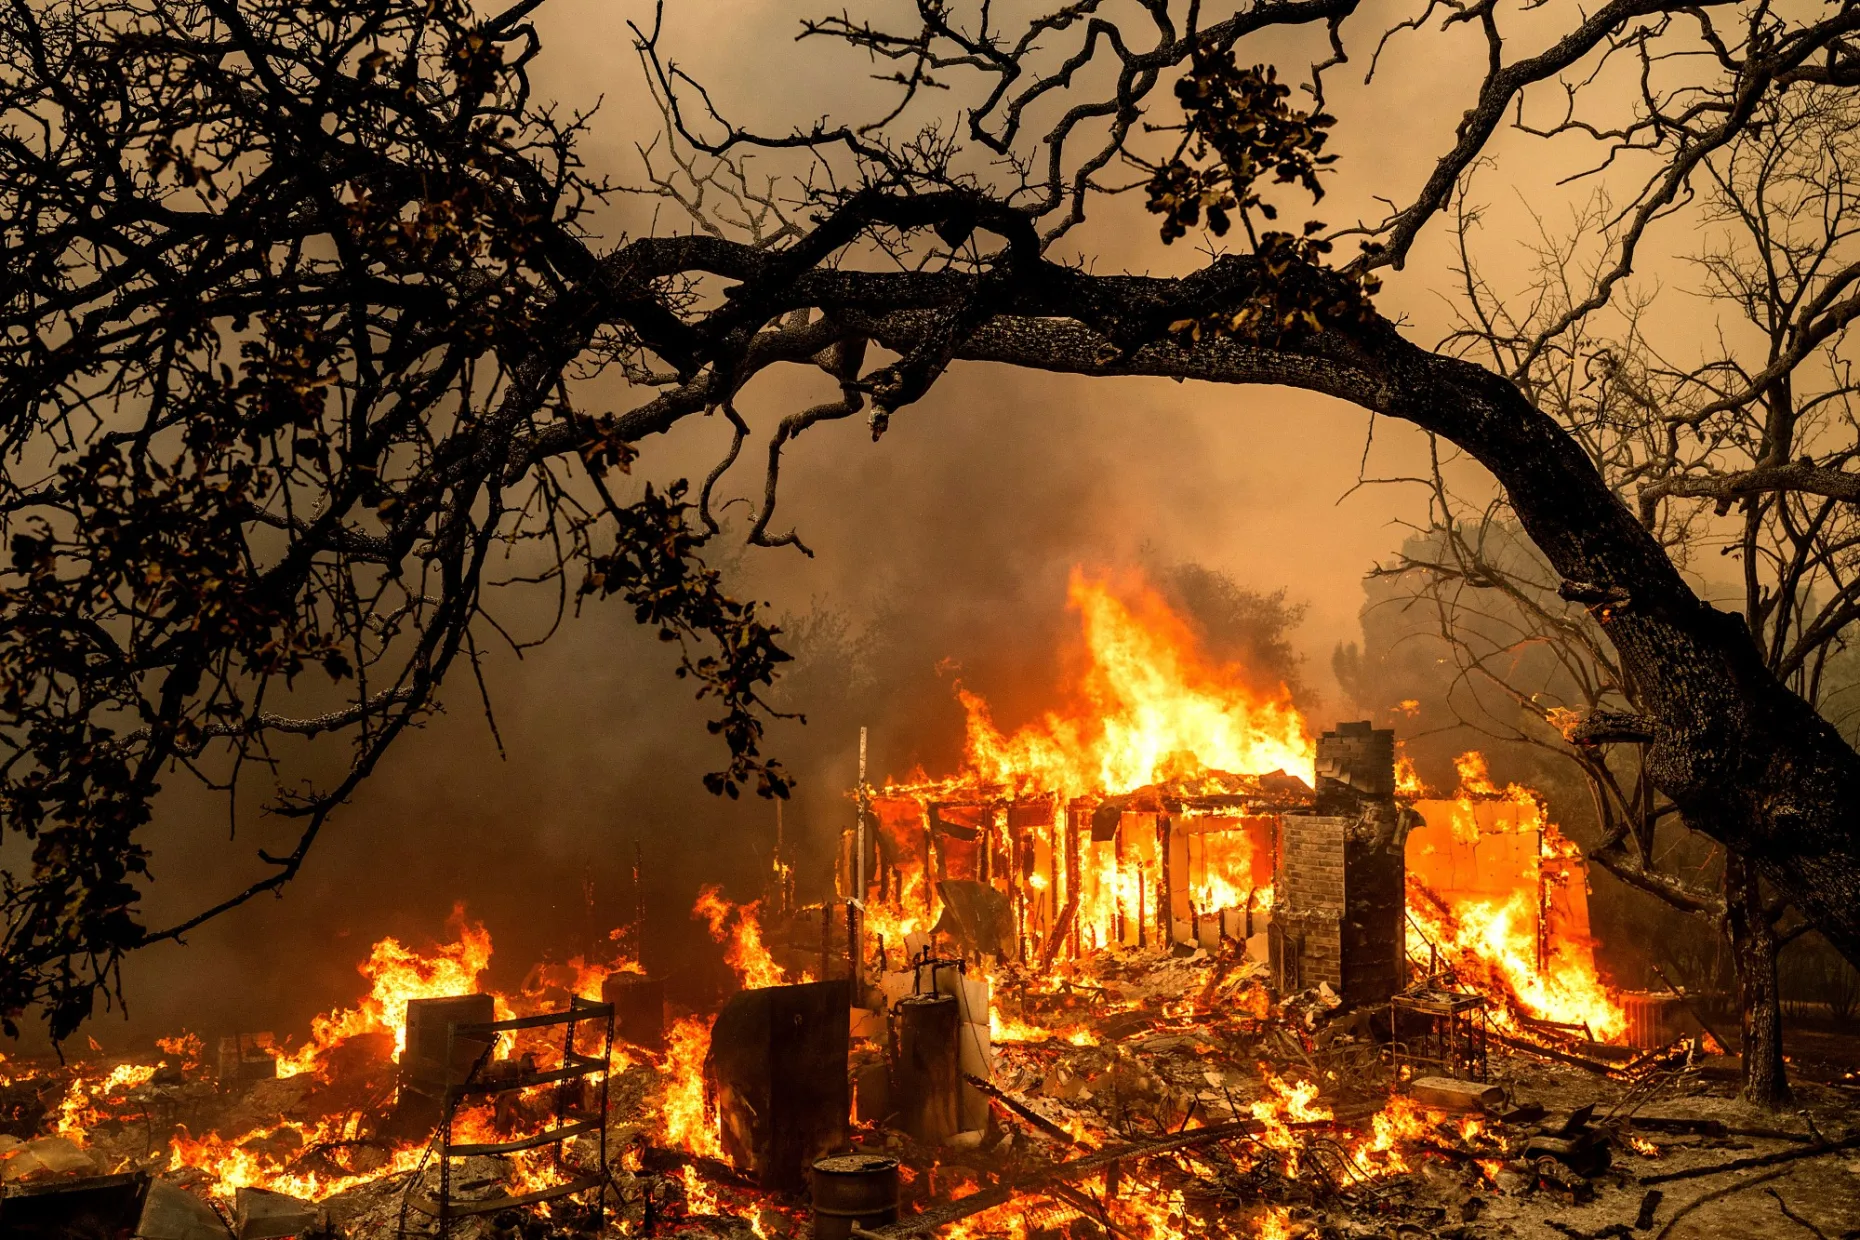
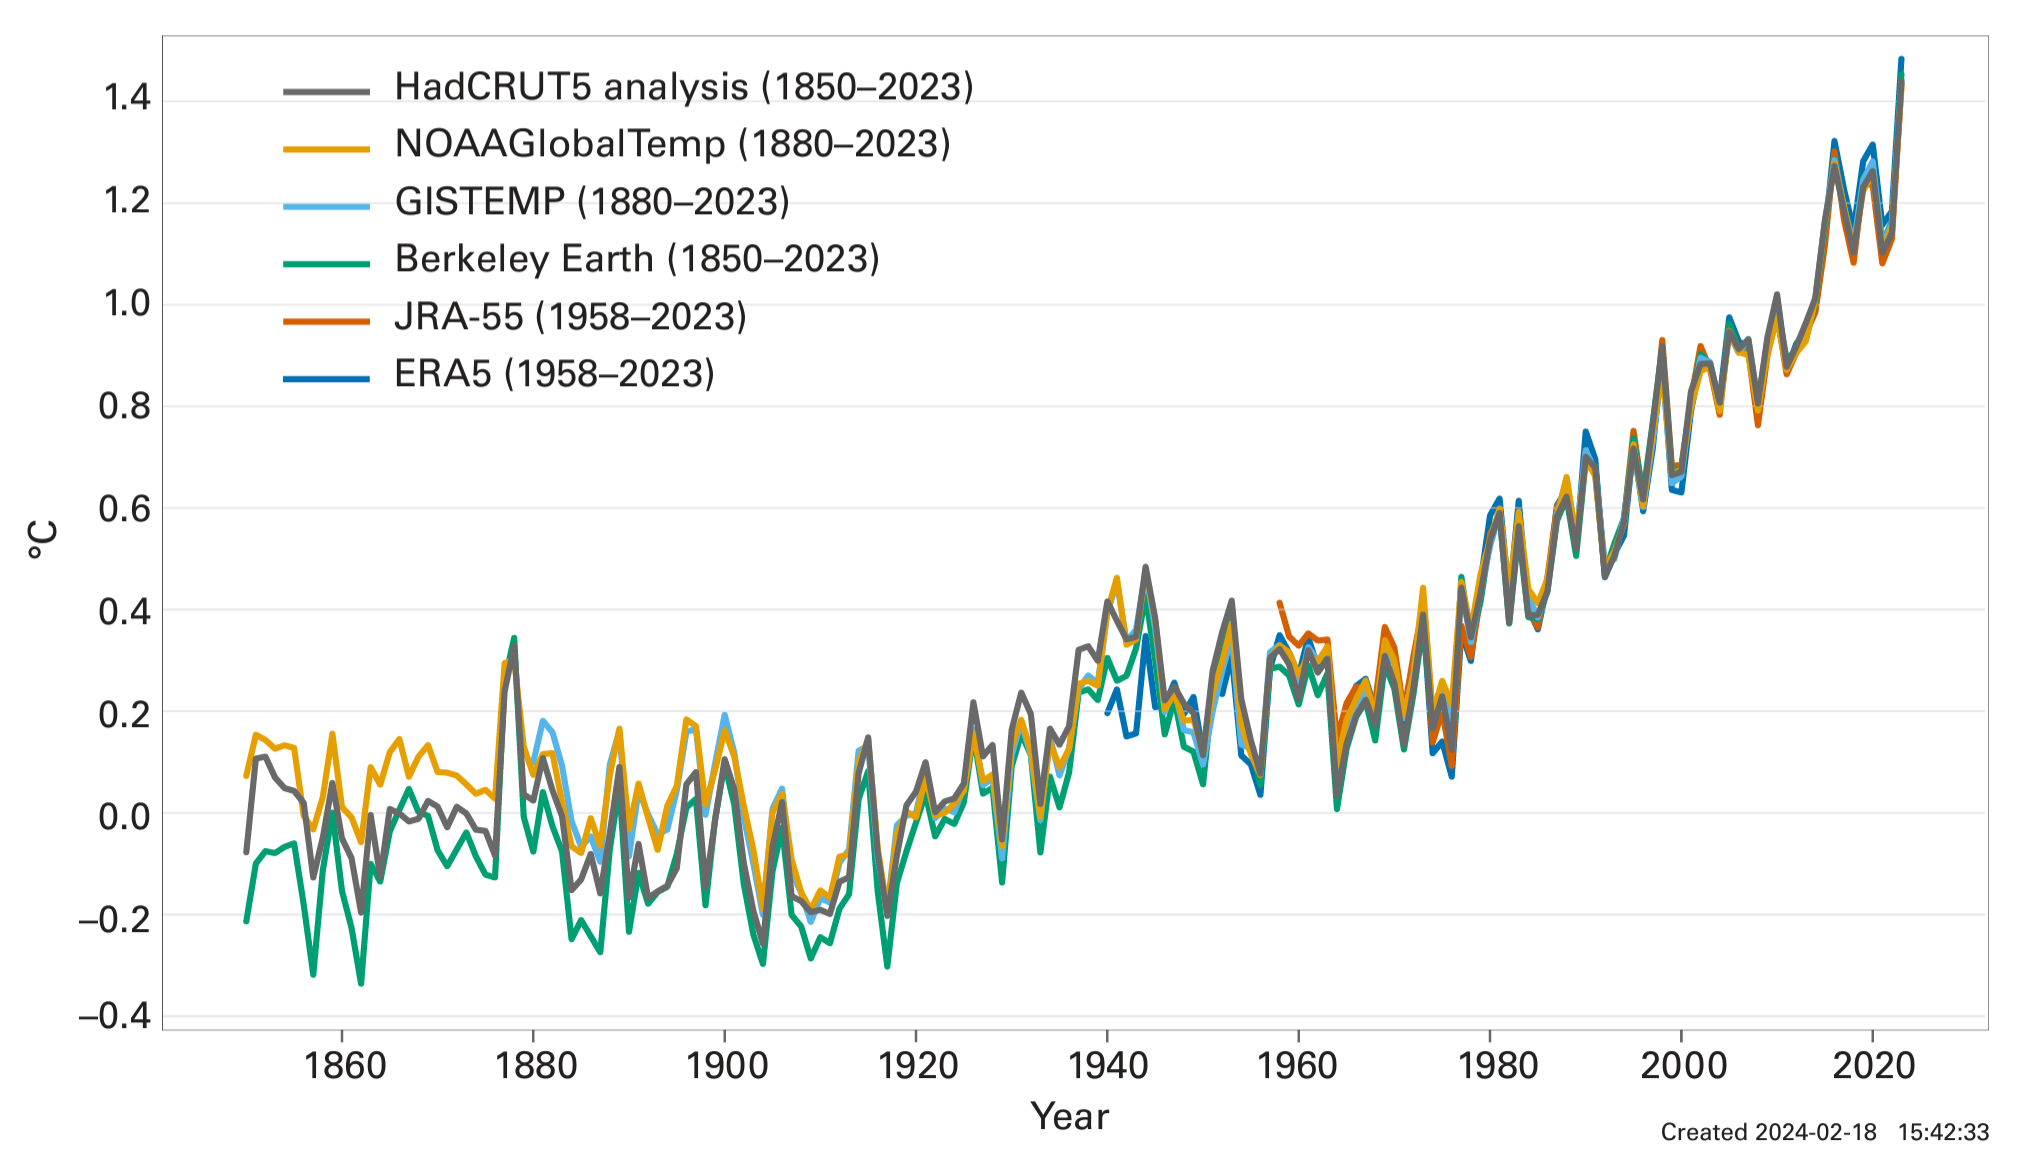
19 March 2024 (WMO) – A new report from the World Meteorological Organization (WMO) shows that records were once again broken, and in some cases smashed, for greenhouse gas levels, surface temperatures, ocean heat and acidification, sea level rise, Antarctic sea ice cover and glacier retreat. Heatwaves, floods, droughts, wildfires, and rapidly intensifying tropical cyclones […]
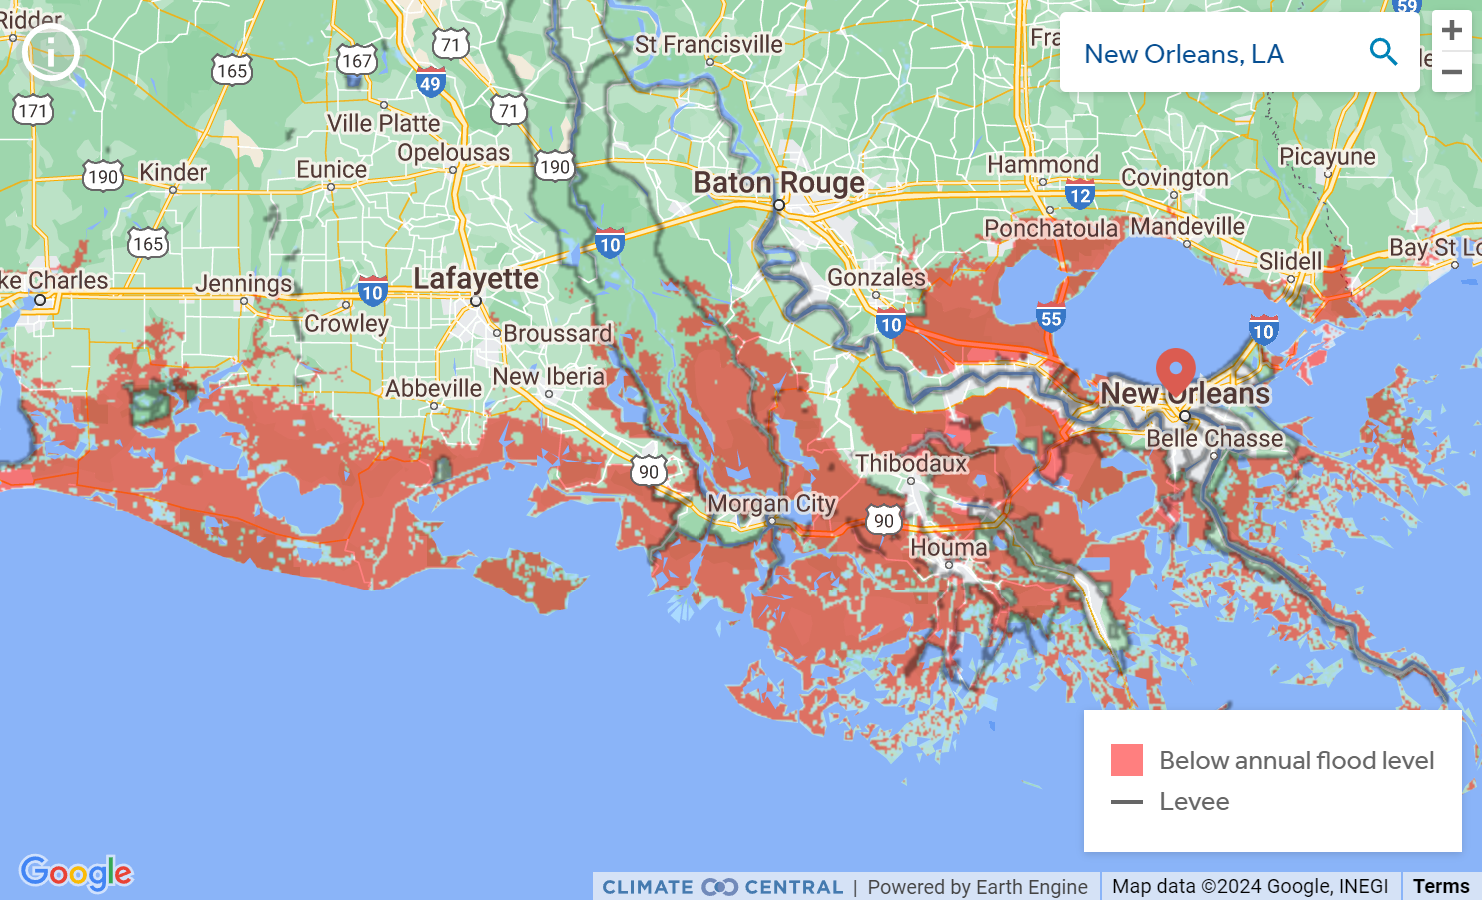
By John O’sullivan 1 January 2024 (Irish Star) – Several parts of The United States could be underwater by the year 2050, according to a frightening map produced by Climate Central. The map shows what could happen if the sea levels, driven by climate change, continue to rise at rates of 2 mm and 4 mm […]
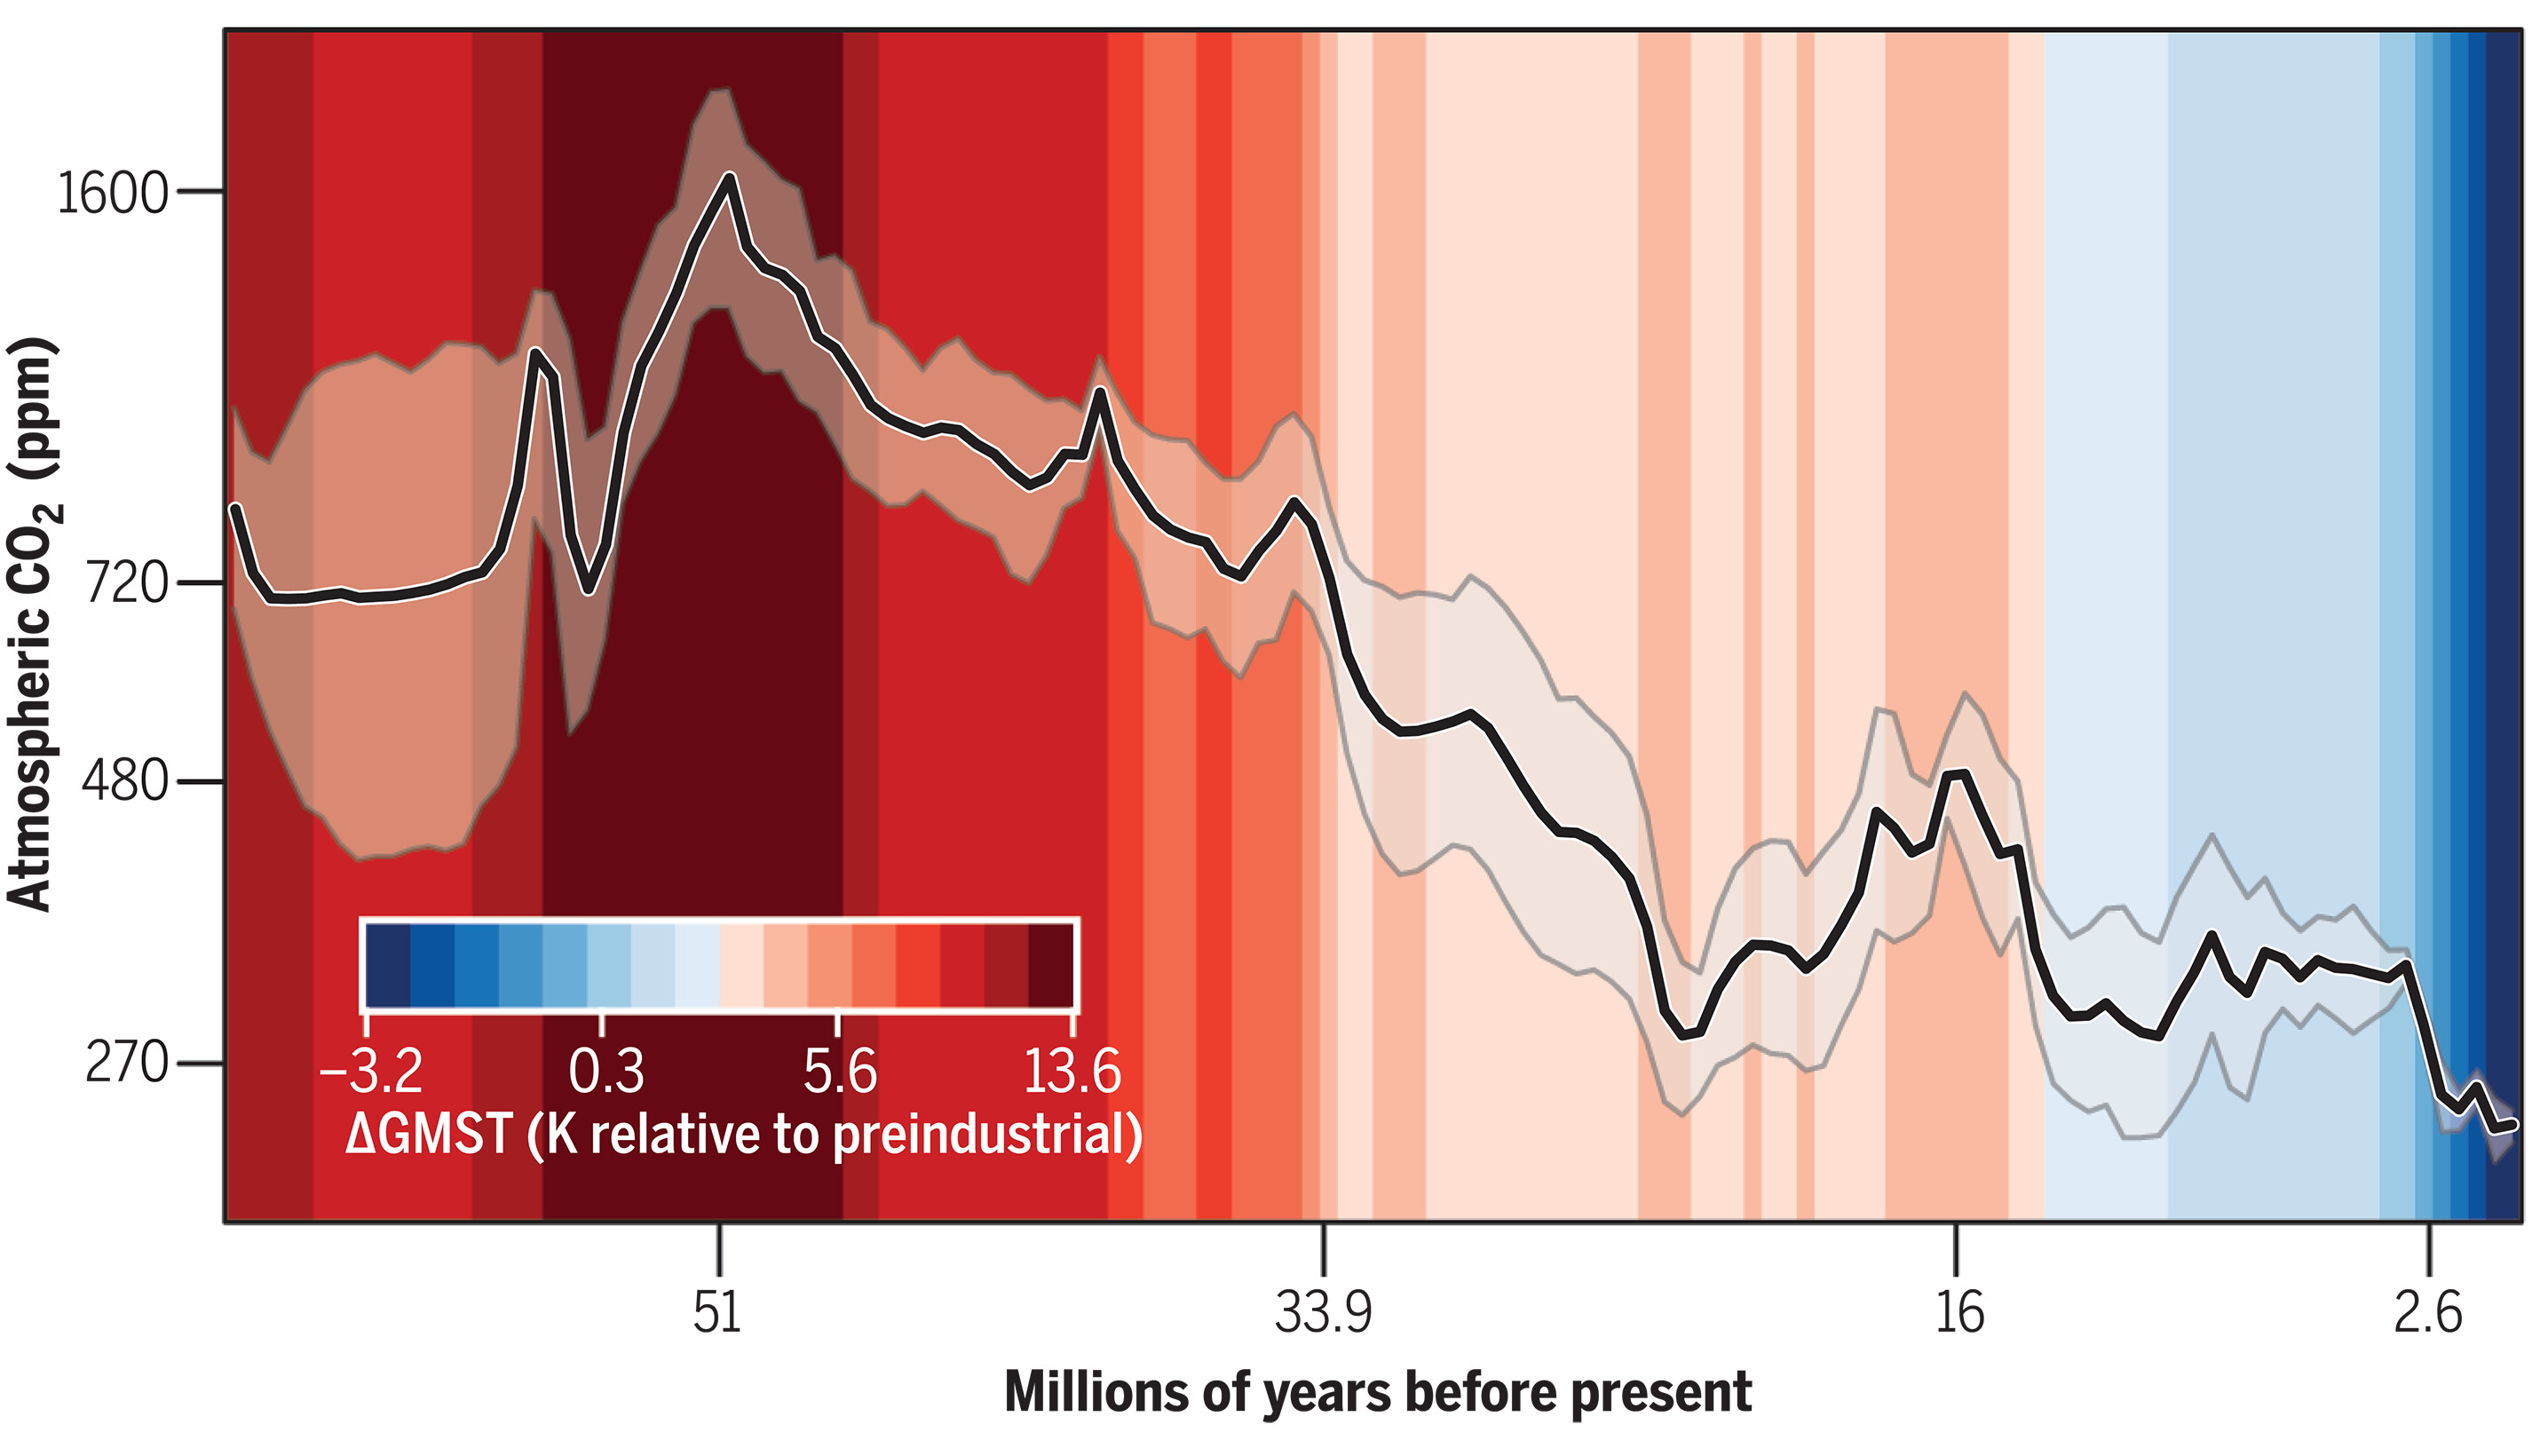
By Kevin Krajick 7 December 2023 (Columbia Climate School) – A massive new review of ancient atmospheric carbon-dioxide levels and corresponding temperatures lays out a daunting picture of where the Earth’s climate may be headed. The study covers geologic records spanning the past 66 million years, putting present-day concentrations into context with deep time. Among […]
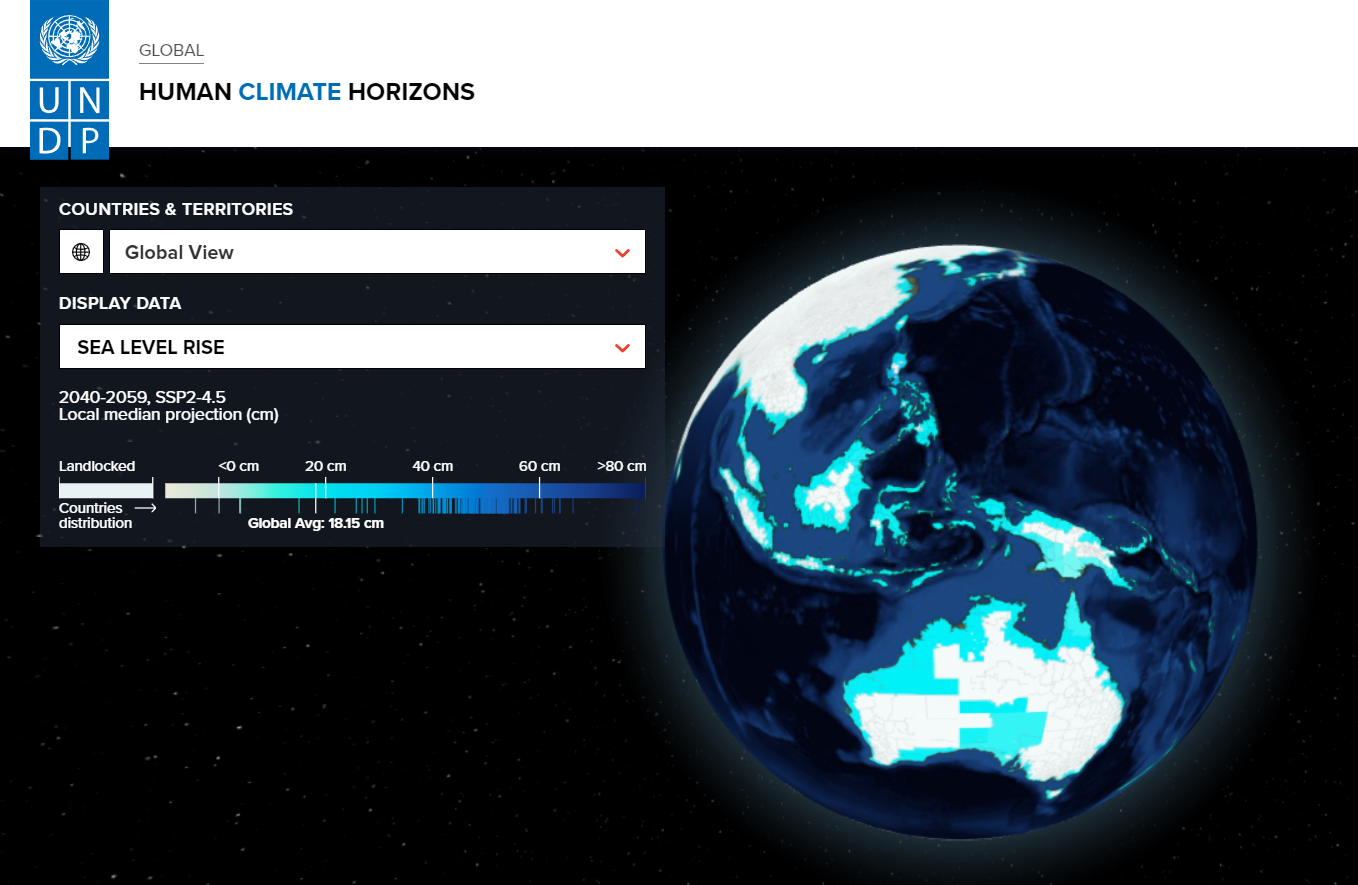
28 November 2023 (UNDP) – According to new data on the Human Climate Horizons platform, a collaboration between the Climate Impact Lab and UNDP, increased coastal flooding this century will put over 70 million people in the path of expanding floodplains. Latin America and the Caribbean, East Asia and the Pacific, and Small Island Developing […]
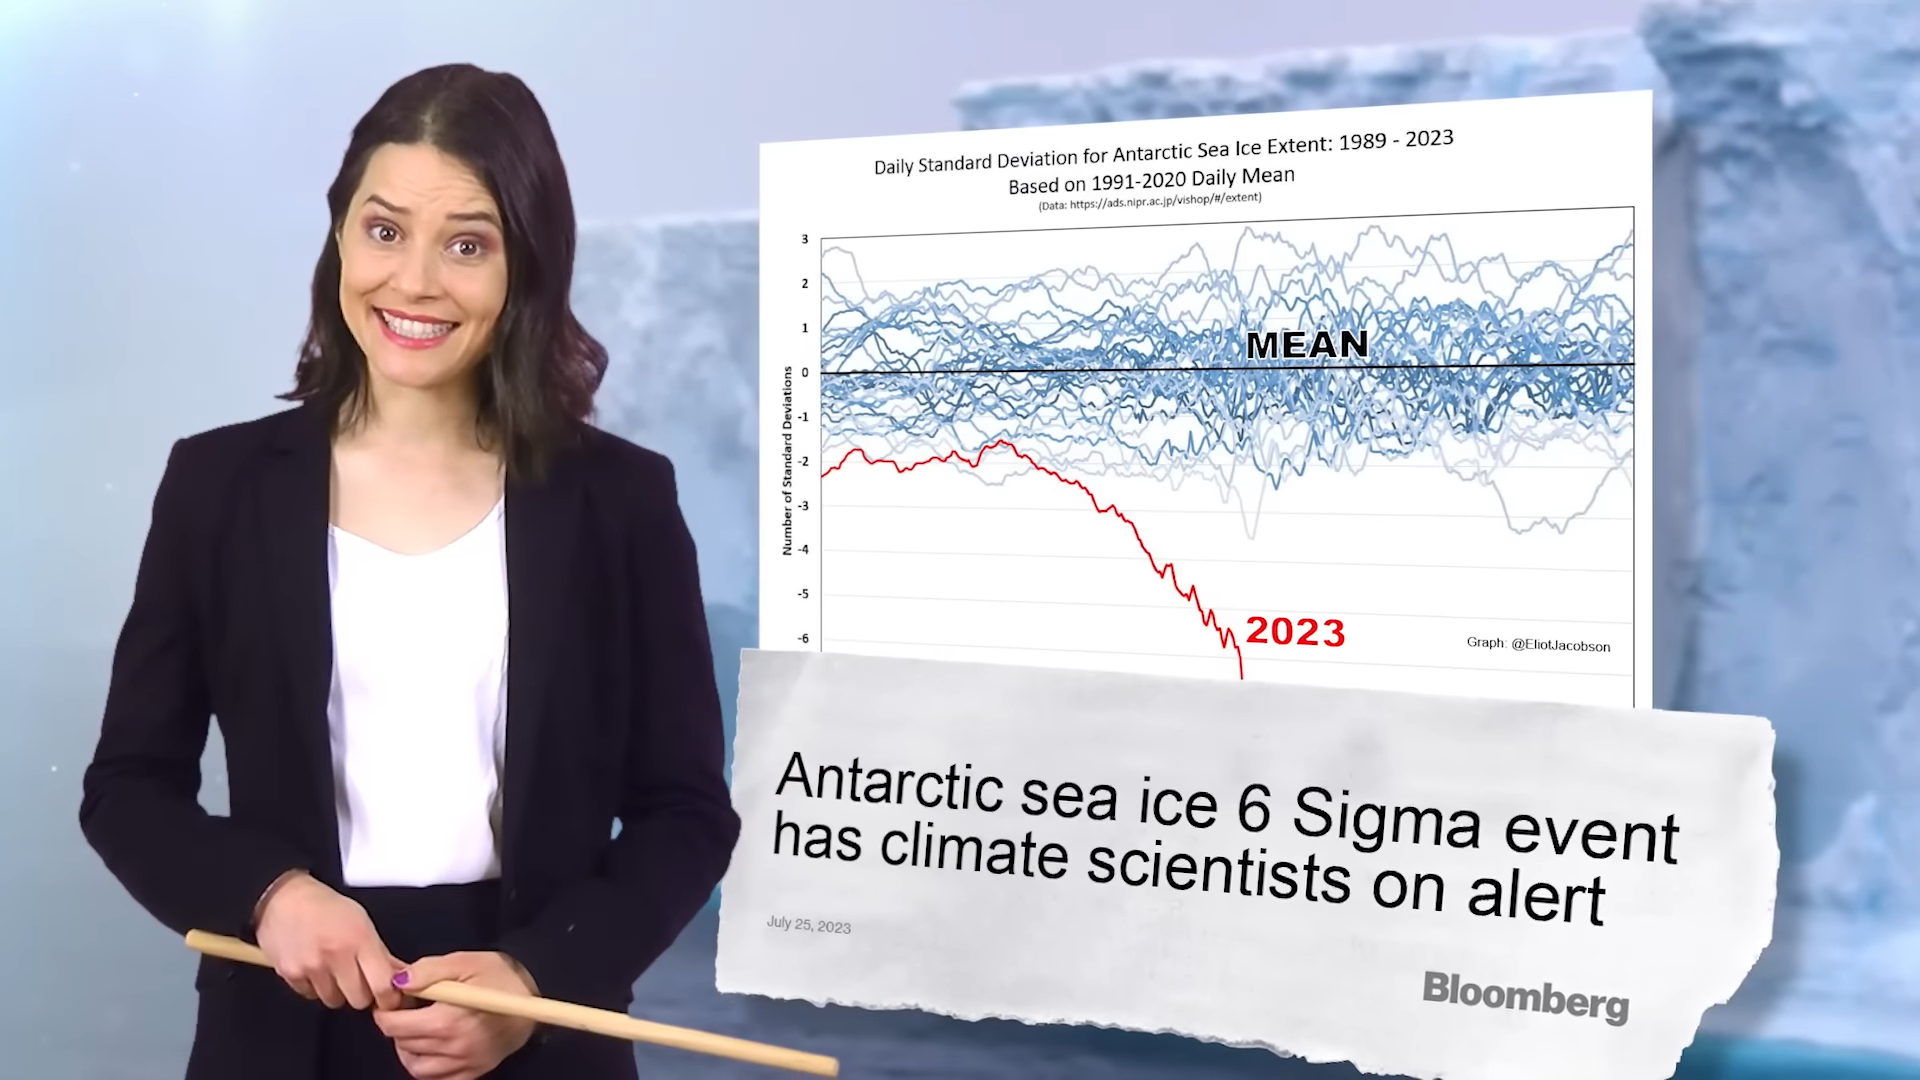
1 August 2023 (The Juice Media) – Hello. Bonjour. Ciao stronzi. Namaste. Ham maadarachod hain. I’m from the Australien Government with a message to the world. As cities bake, fires rage, reefs die, jet streams weaken, and 6-Ligma events cause climate scientists to shit their dacks, many are wondering if we’ve finally broken our favourite […]