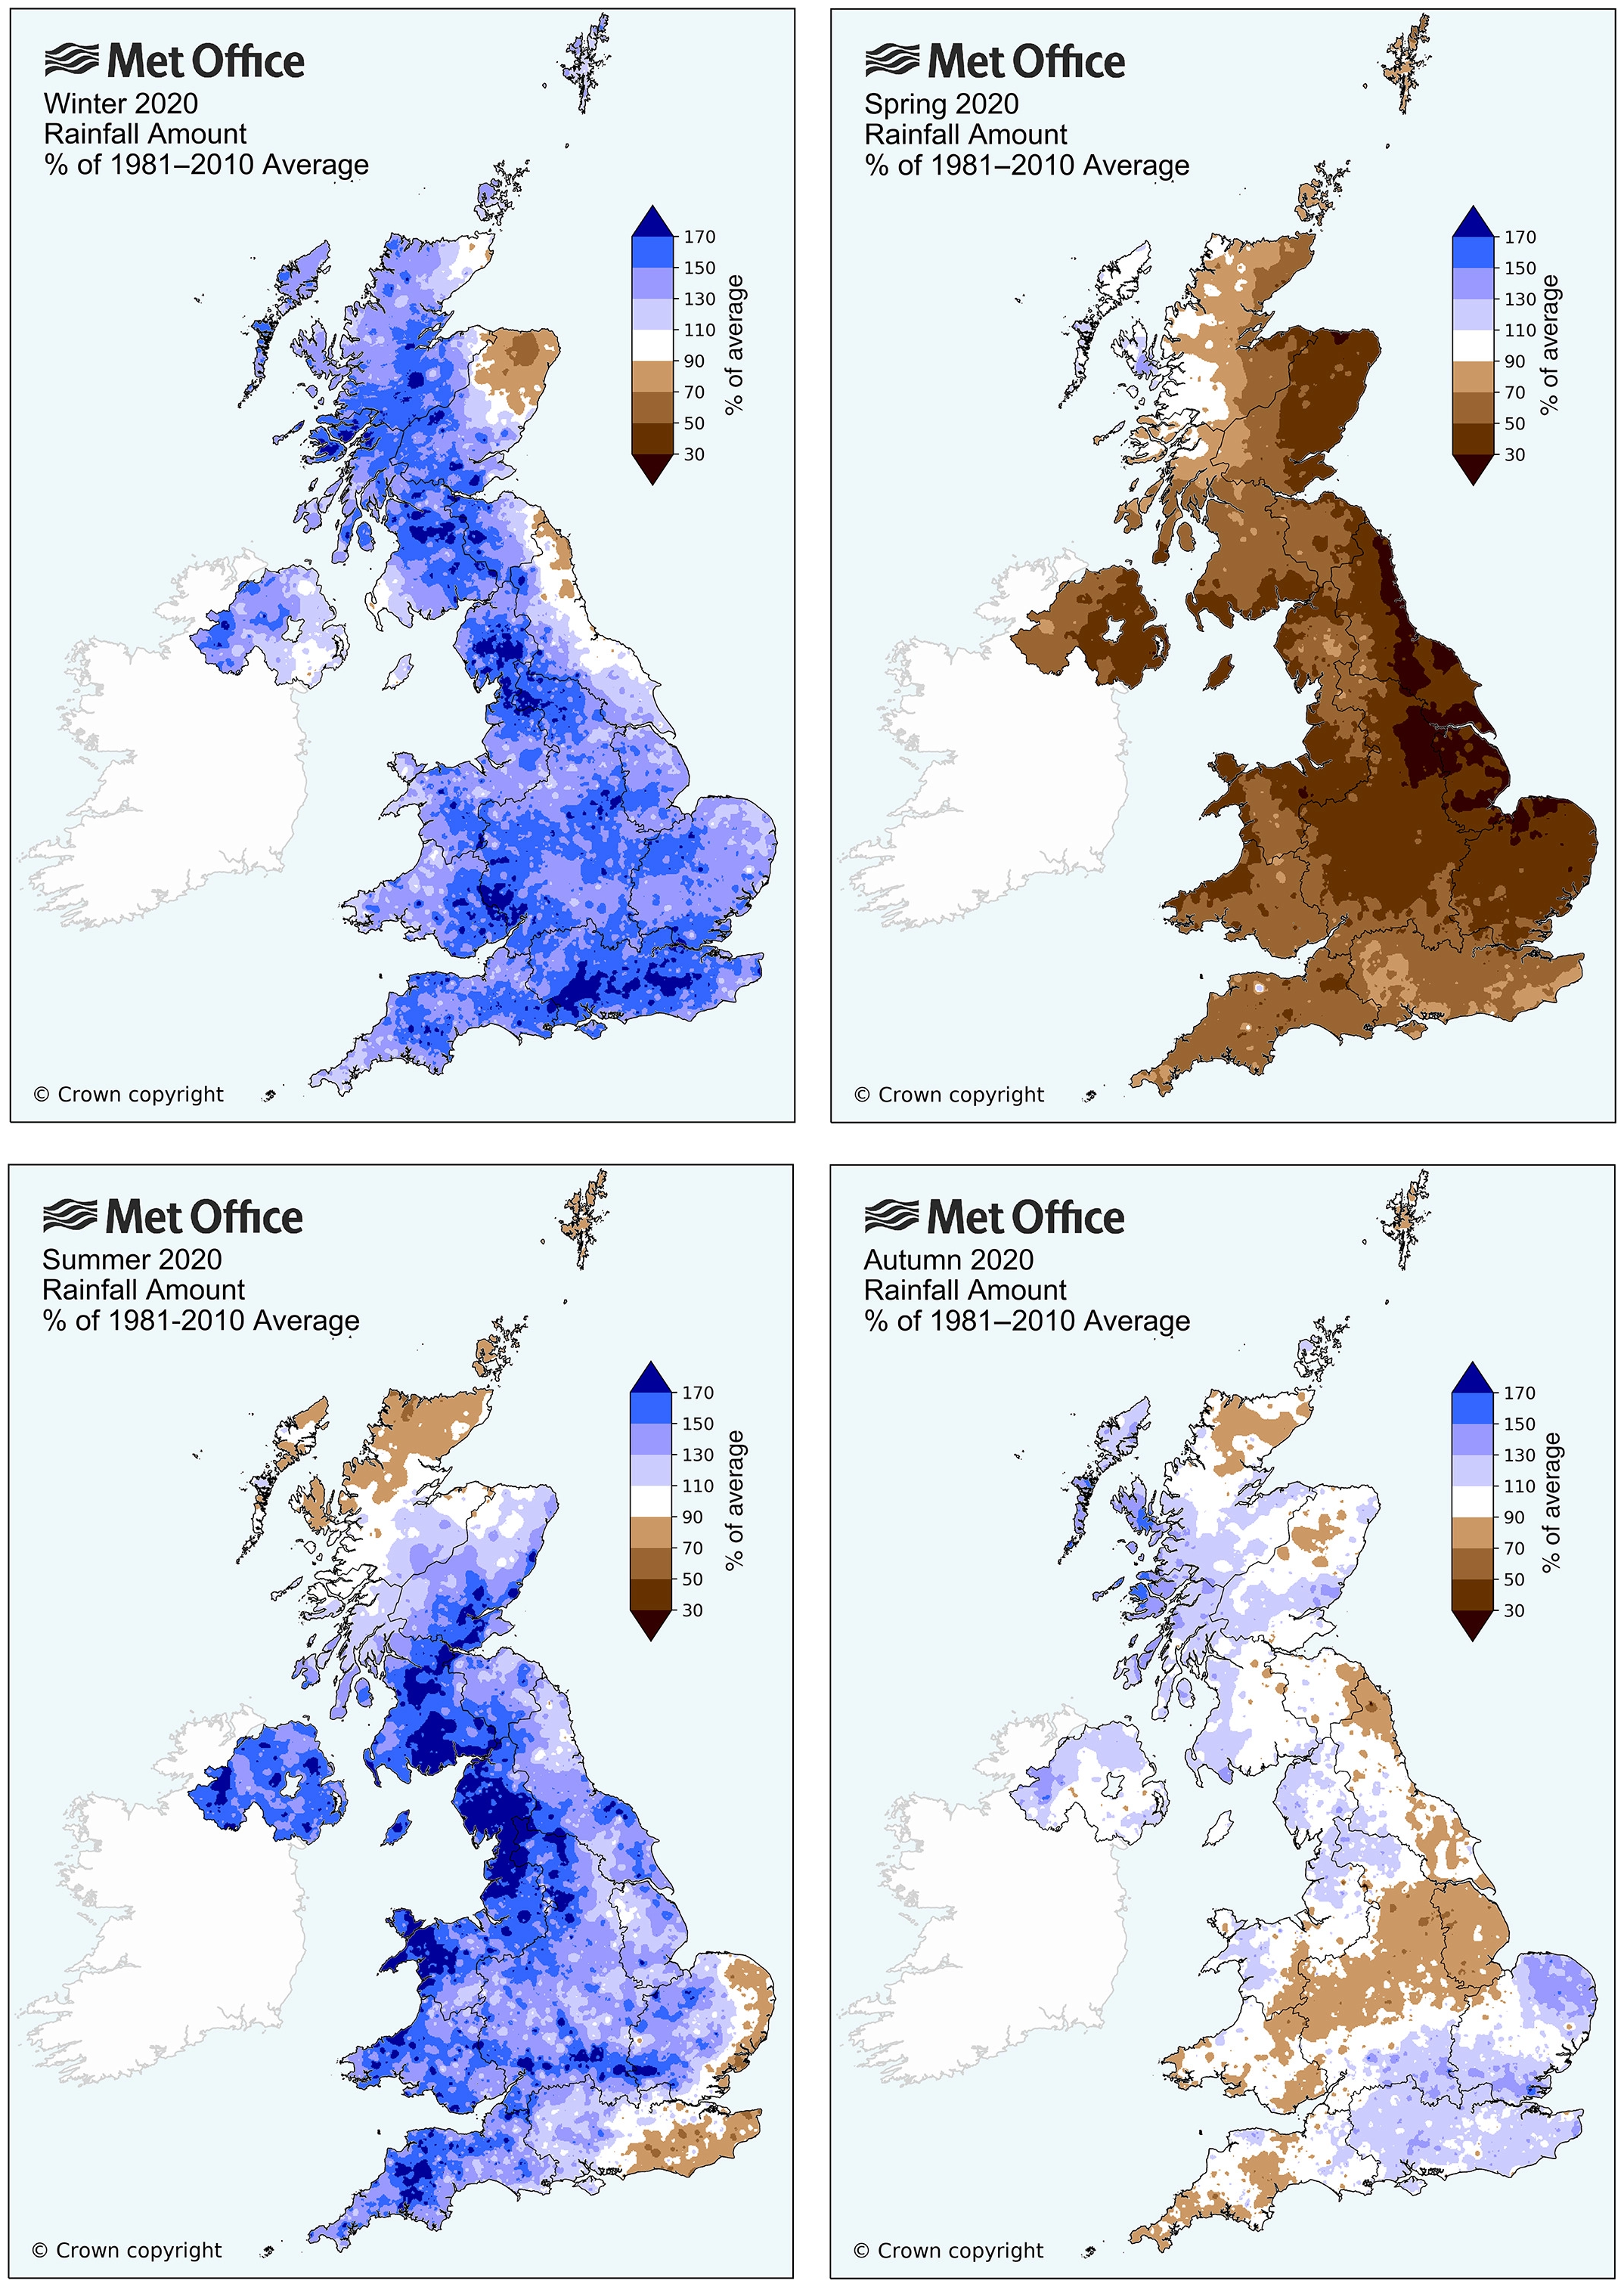
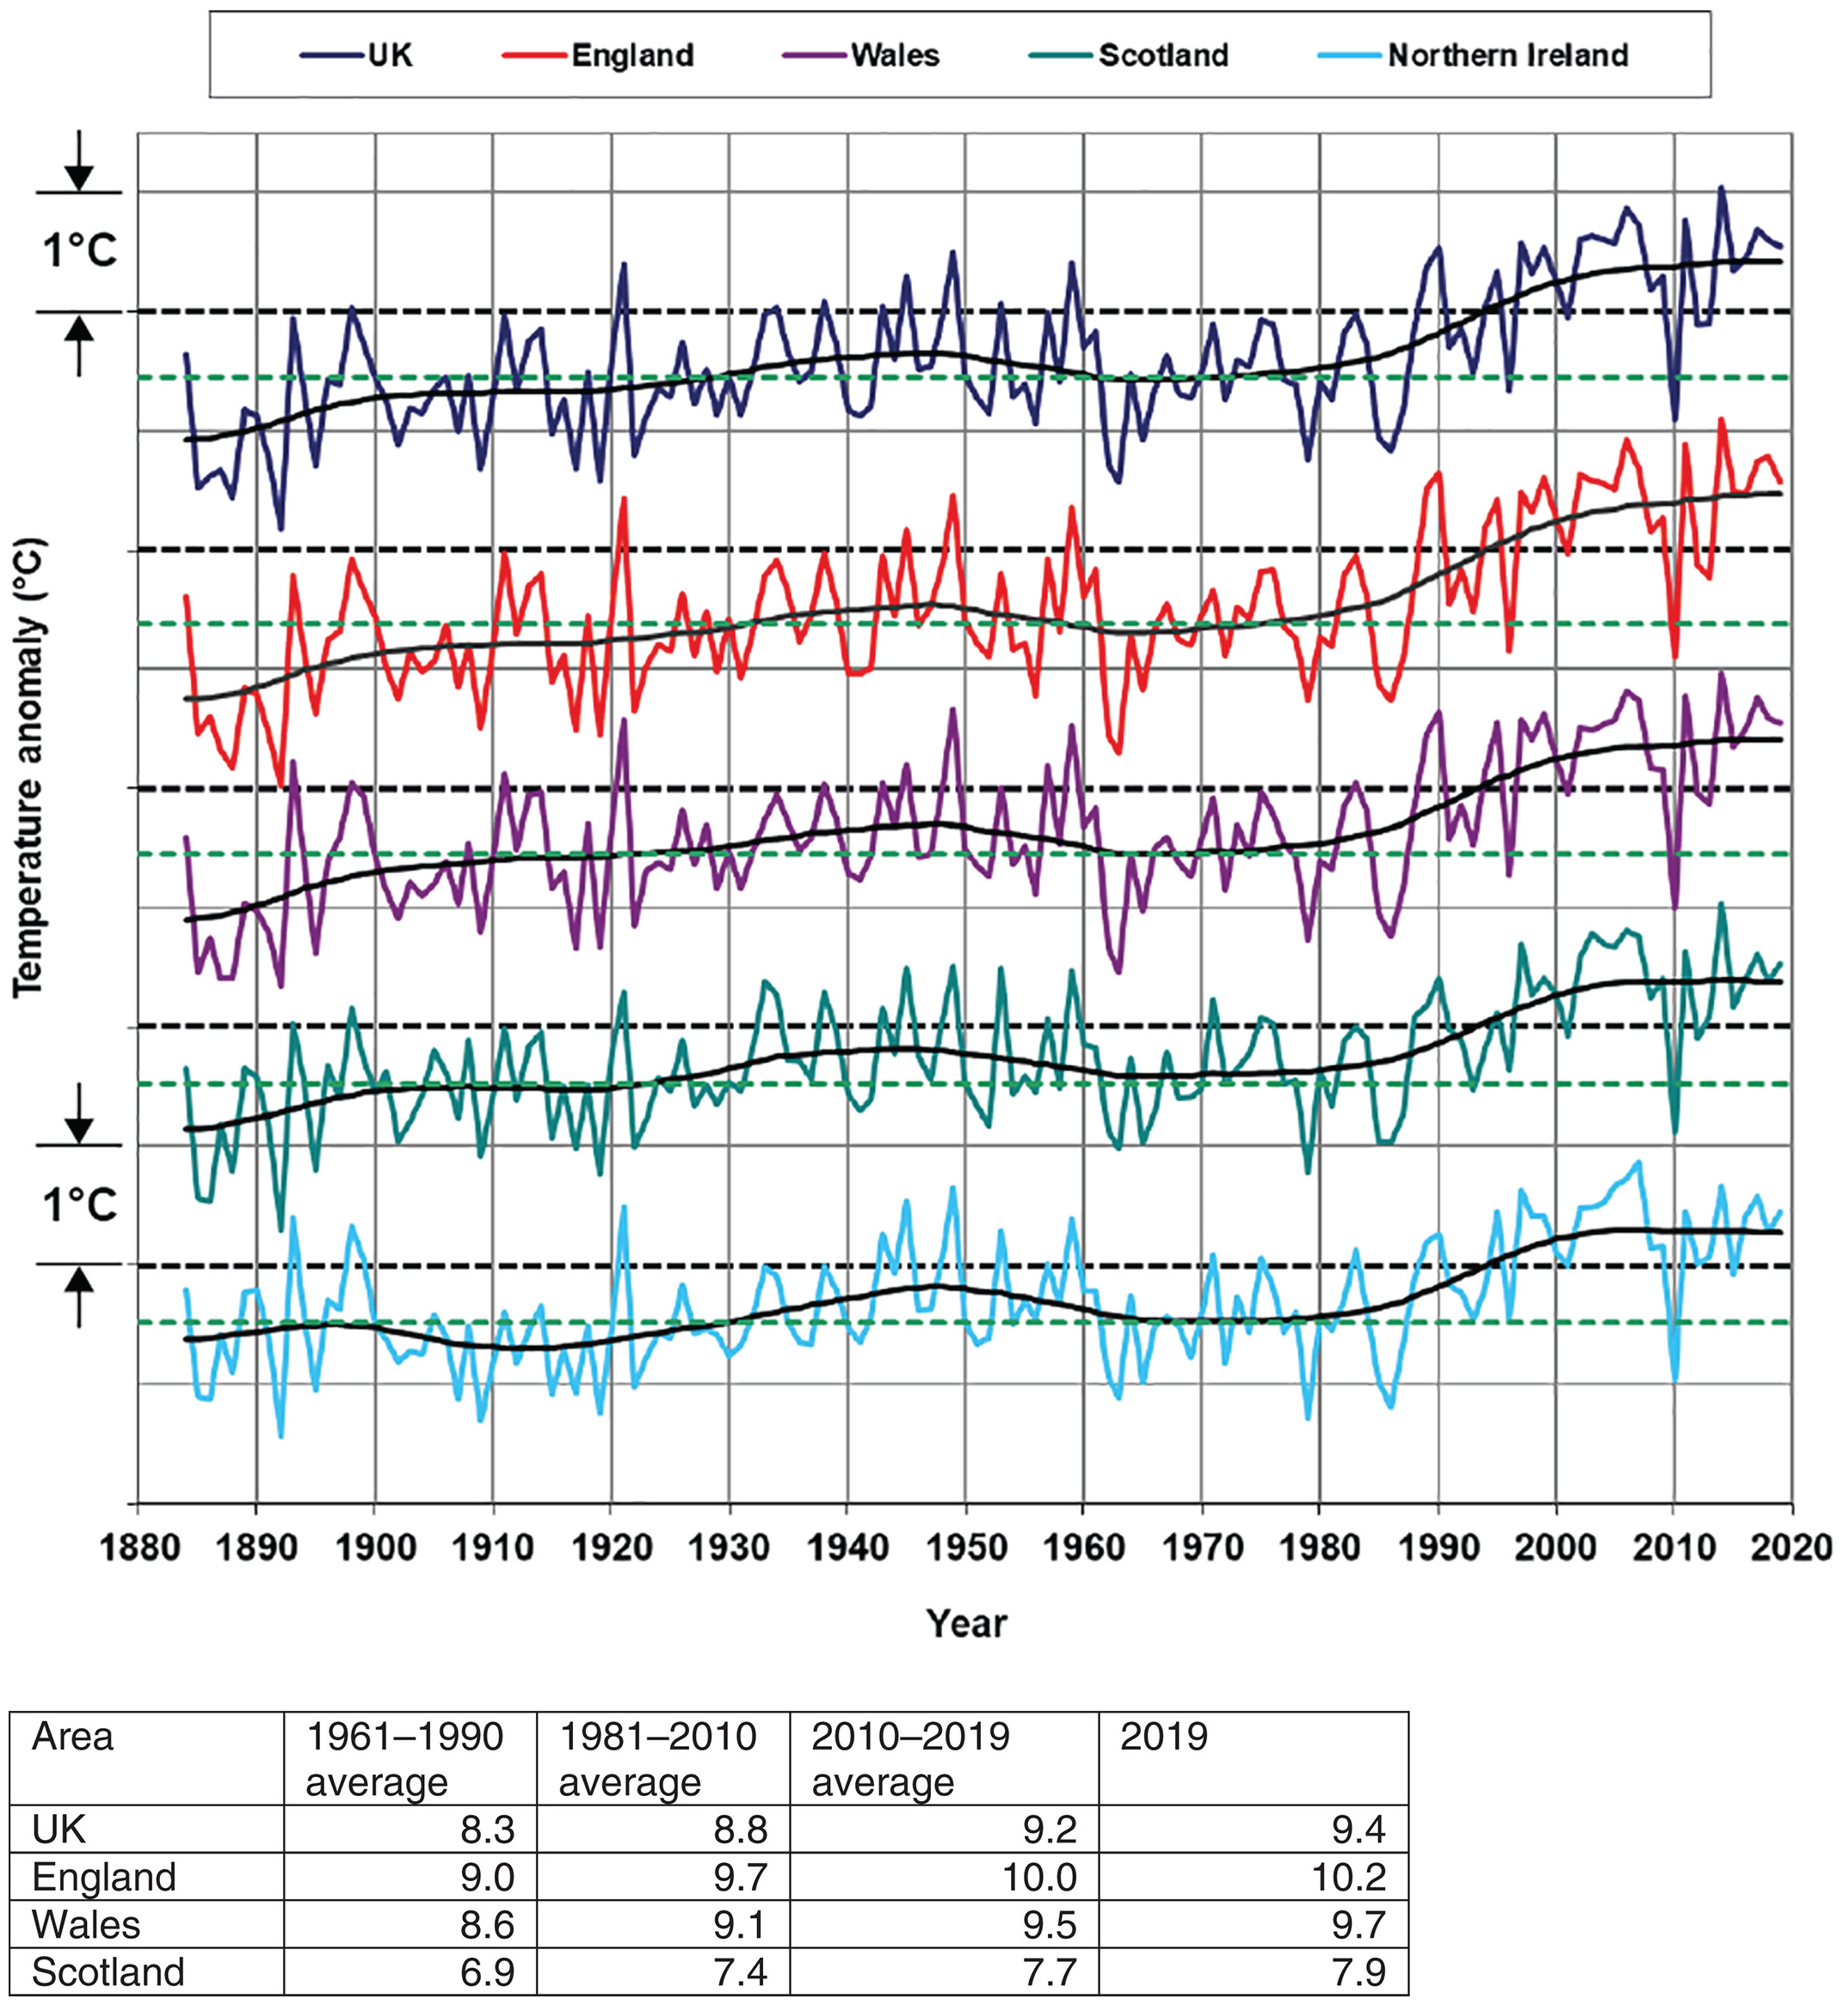
By Karen Graham 29 July 2021 (Digital Journal) – The United Kingdom’s climate has continued to warm, with the decade 2011–2020 providing a 10-year “snapshot” of the most recent of the UK’s climate events and how this compares to historical records. According to the Met Office, The Royal Meteorological Society’s latest analysis of the UK climate – […]
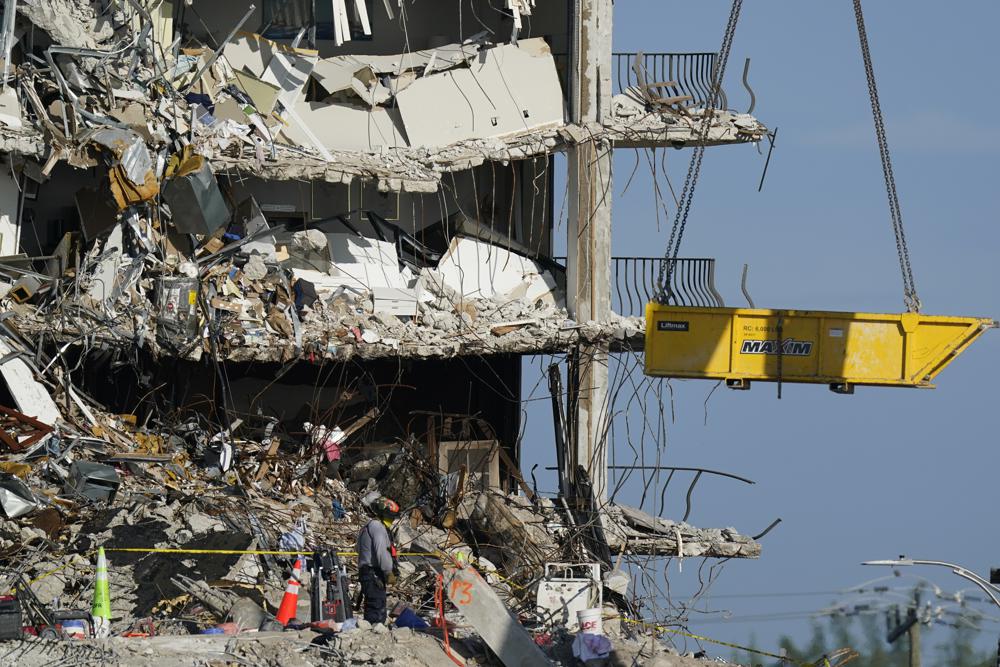
By Jeff Goodell 1 July 2021 (Rolling Stone) – Before it fell, Champlain Towers South, the 12-story Florida condo building that collapsed last week in the middle of the night, burying residents in a pile of concrete and chaos, was just another nondescript high-rise on the beach. It had been thrown up quickly during the […]
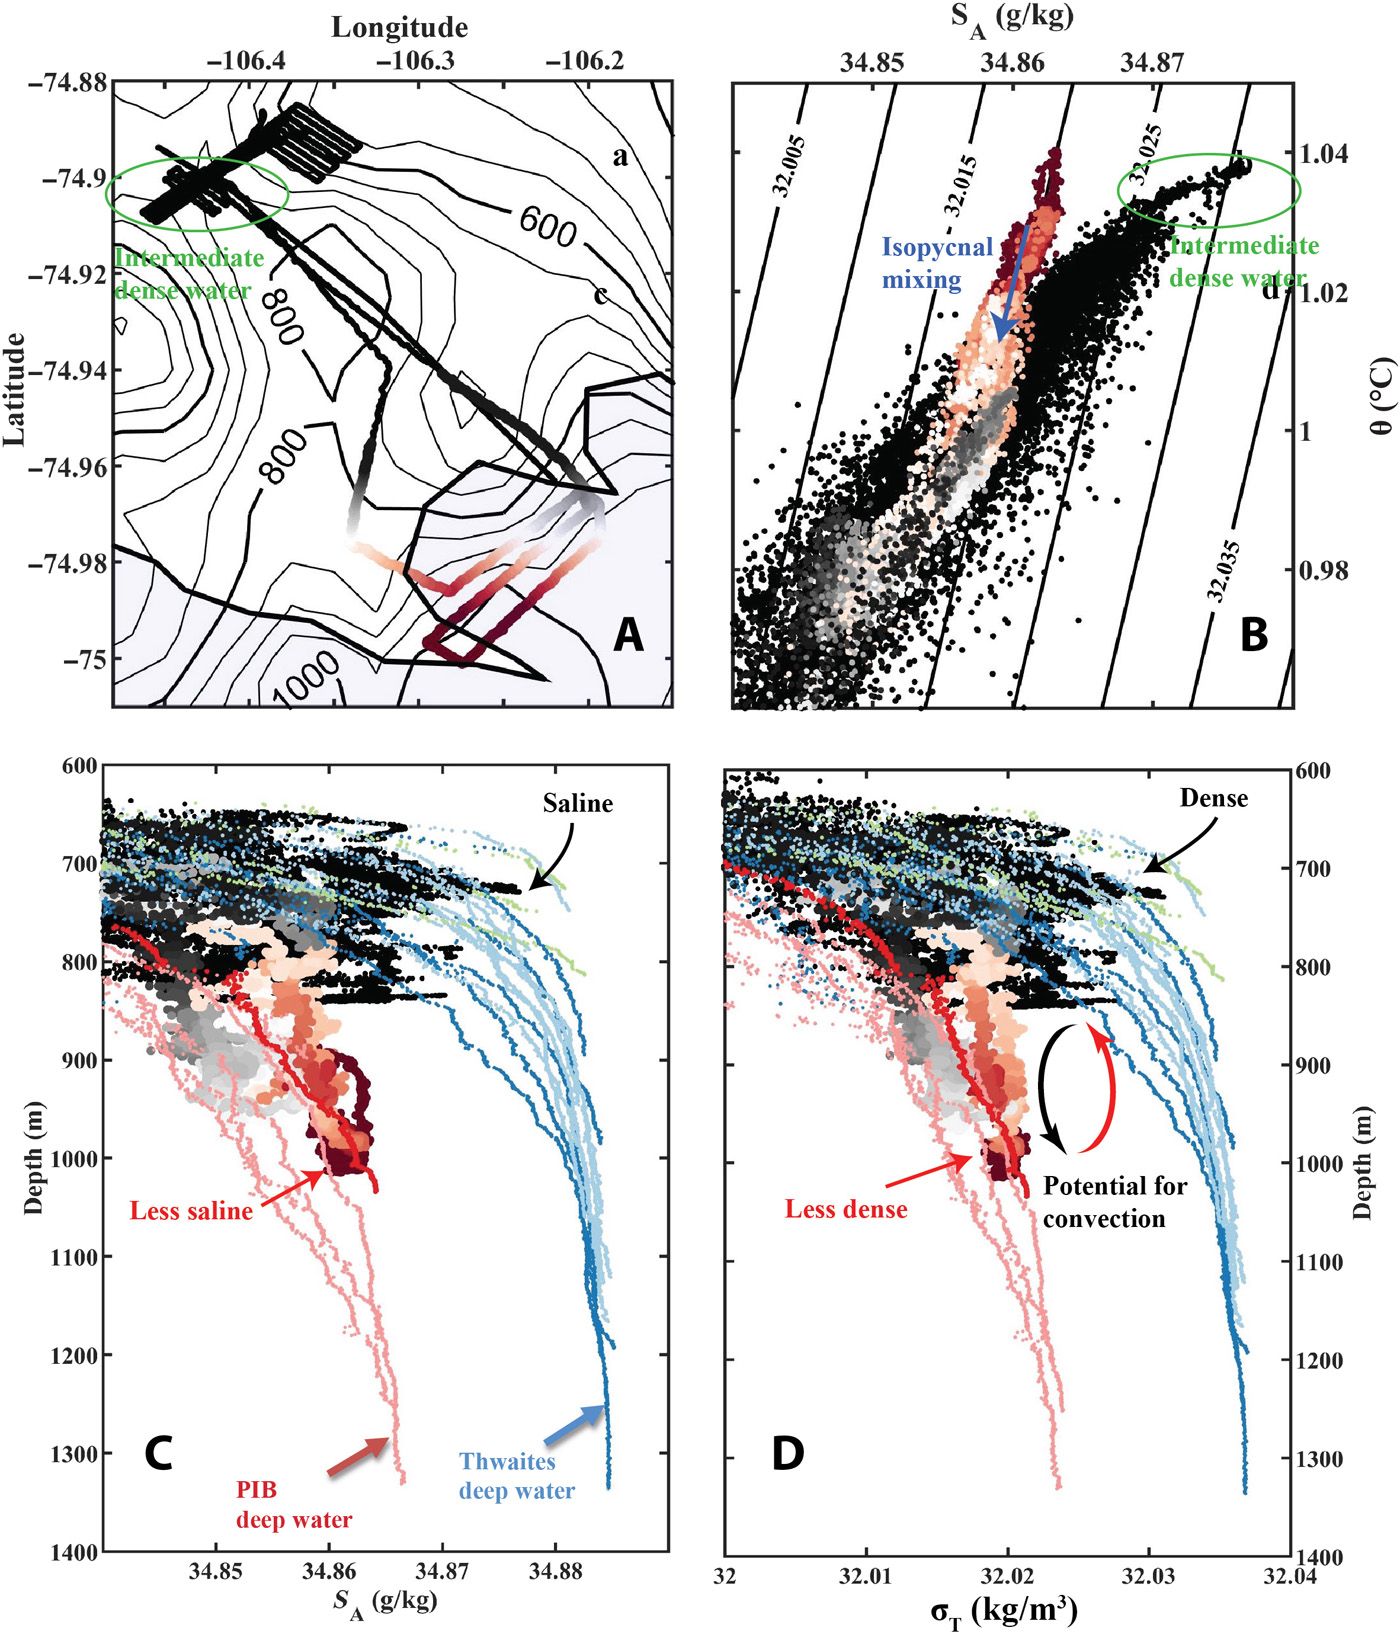
9 April 2021 (University of Gothenburg) – For the first time, researchers have been able to obtain data from underneath Thwaites Glacier, also known as the “Doomsday Glacier”. They find that the supply of warm water to the glacier is larger than previously thought, triggering concerns of faster melting and accelerating ice flow. With the […]
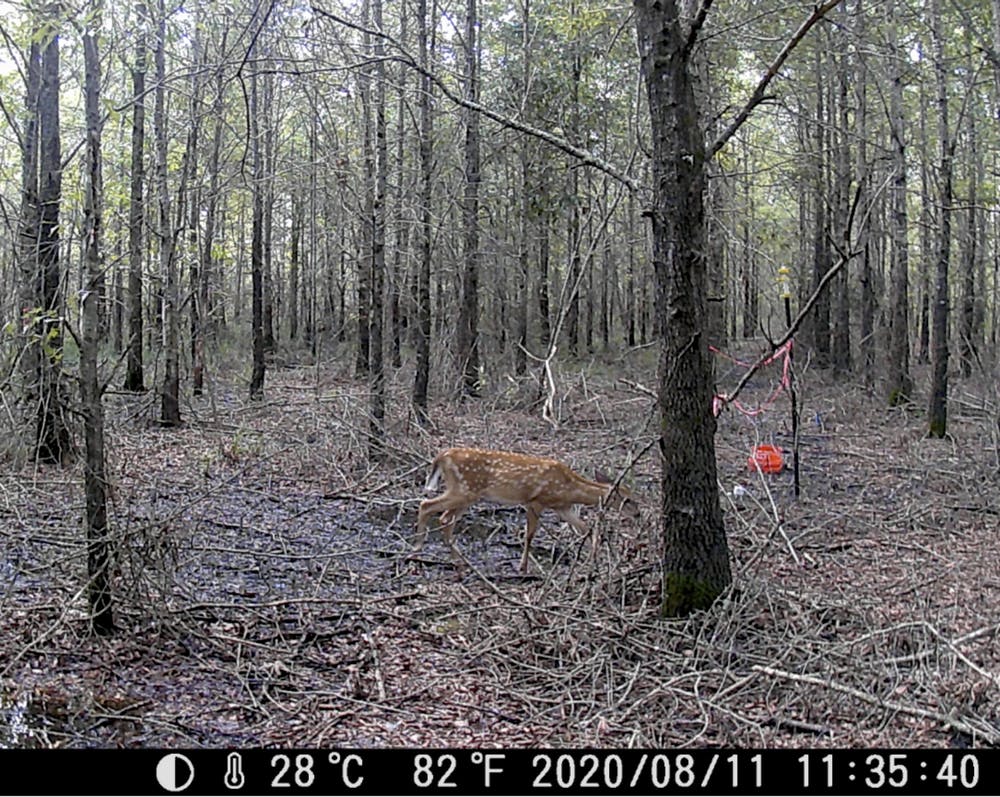
By Emily Ury 6 April 2021 (The Conversation) – Trekking out to my research sites near North Carolina’s Alligator River National Wildlife Refuge, I slog through knee-deep water on a section of trail that is completely submerged. Permanent flooding has become commonplace on this low-lying peninsula, nestled behind North Carolina’s Outer Banks. The trees growing in […]
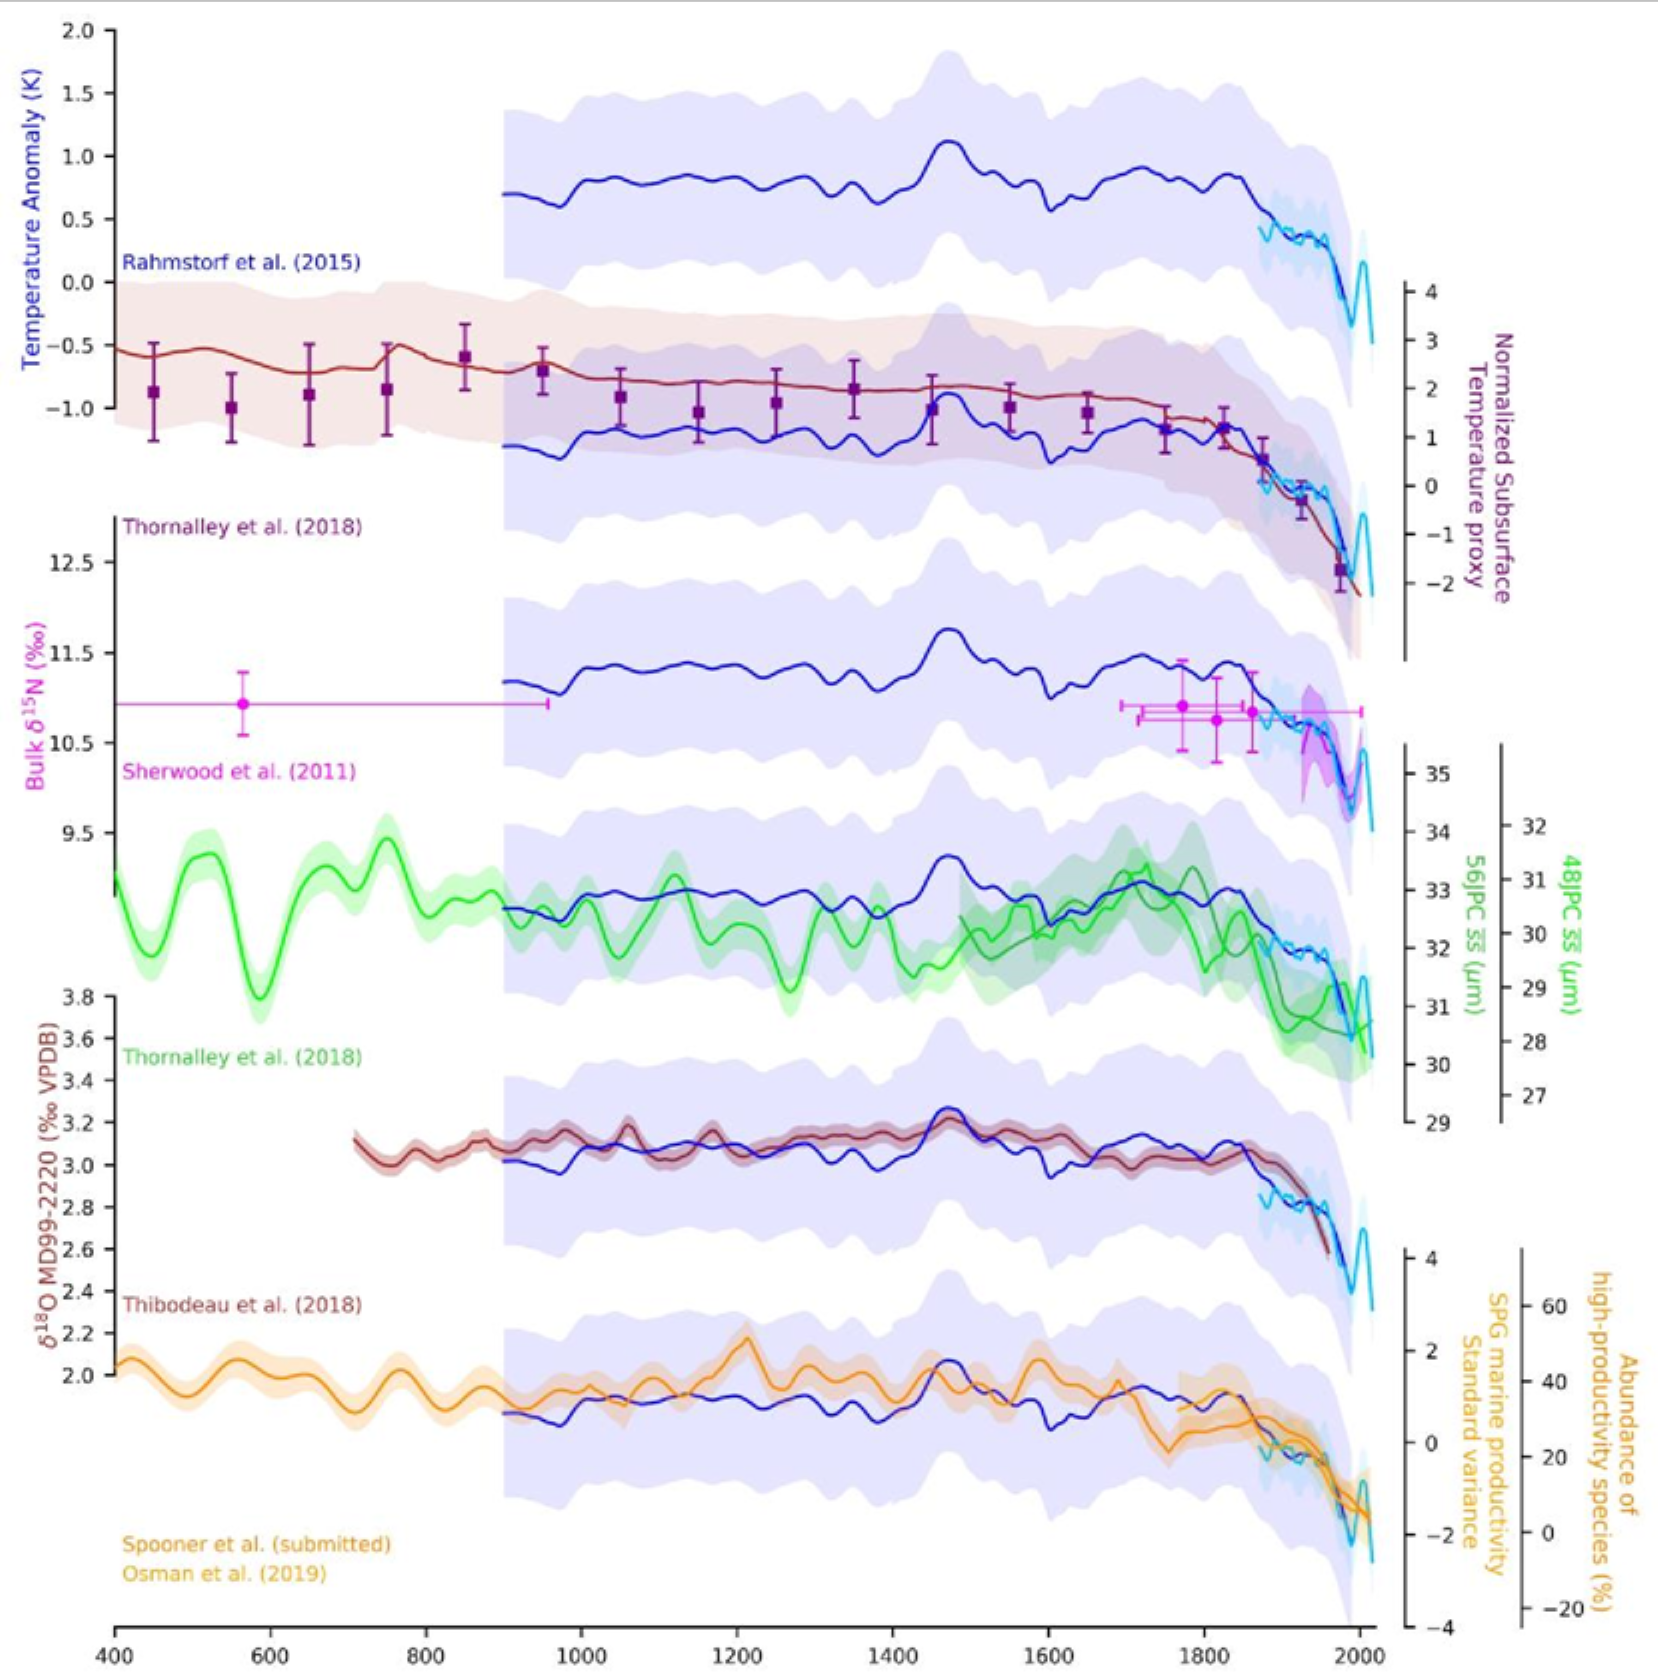
25 February 2021 (PIK) – Never before in over 1000 years the Atlantic Meridional Overturning Circulation (AMOC), also known as Gulf Stream System, has been as weak as in the last decades. This is the result of a new study by scientists from Ireland, Britain, and Germany. The researchers compiled so-called proxy data – taken […]
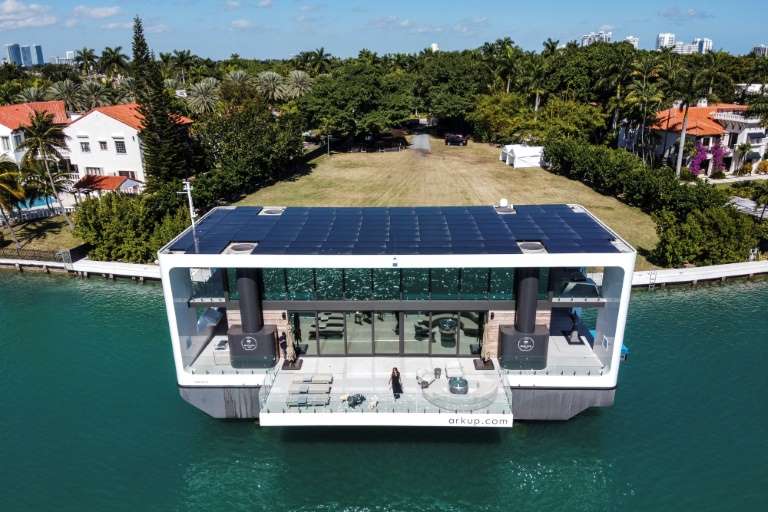
27 February 2021 (AFP) – The U.S. city of Miami is to invest billions of dollars to tackle its vulnerability to rising sea levels, a reality that already affects the daily lives of residents used to constant flooding. Miami-Dade County Mayor Daniella Levine-Cava said Friday she will protect communities hardest hit by rising sea levels, […]
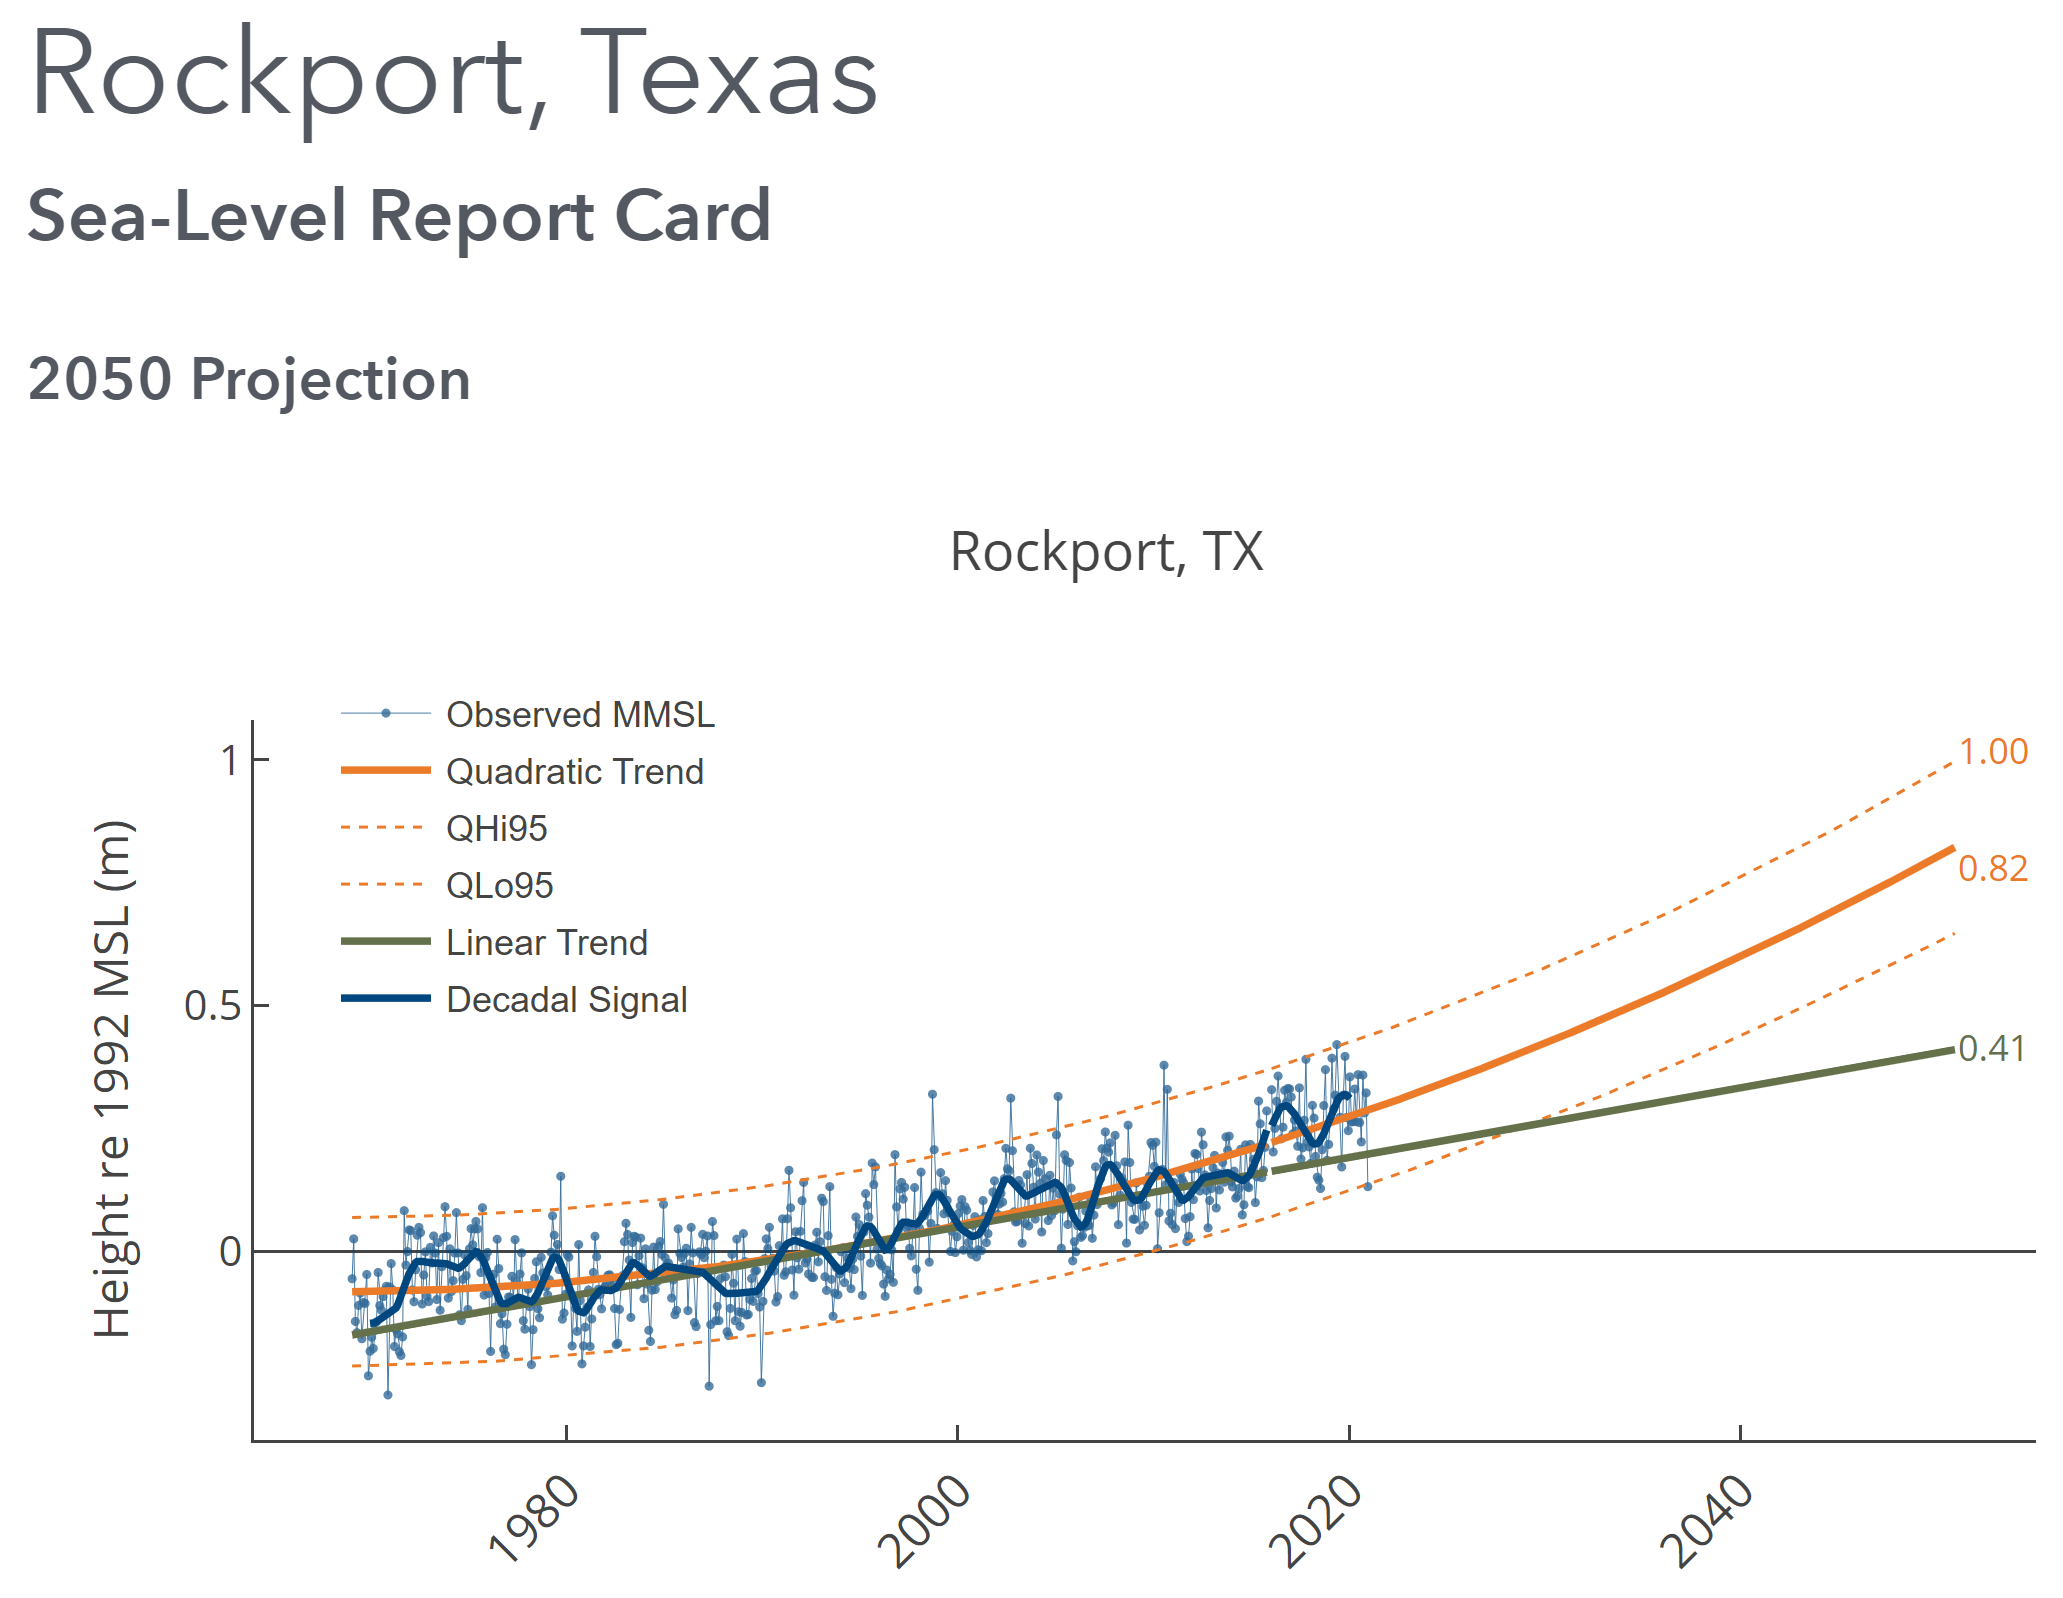
By David Malmquist 24 January 2021 (VIMS) – Sea level “report cards” issued annually by researchers at William & Mary’s Virginia Institute of Marine Science add further evidence of an accelerating rate of sea-level rise during 2020 at nearly all tidal stations along the U.S. coastline. The team’s web-based report cards project sea level to […]
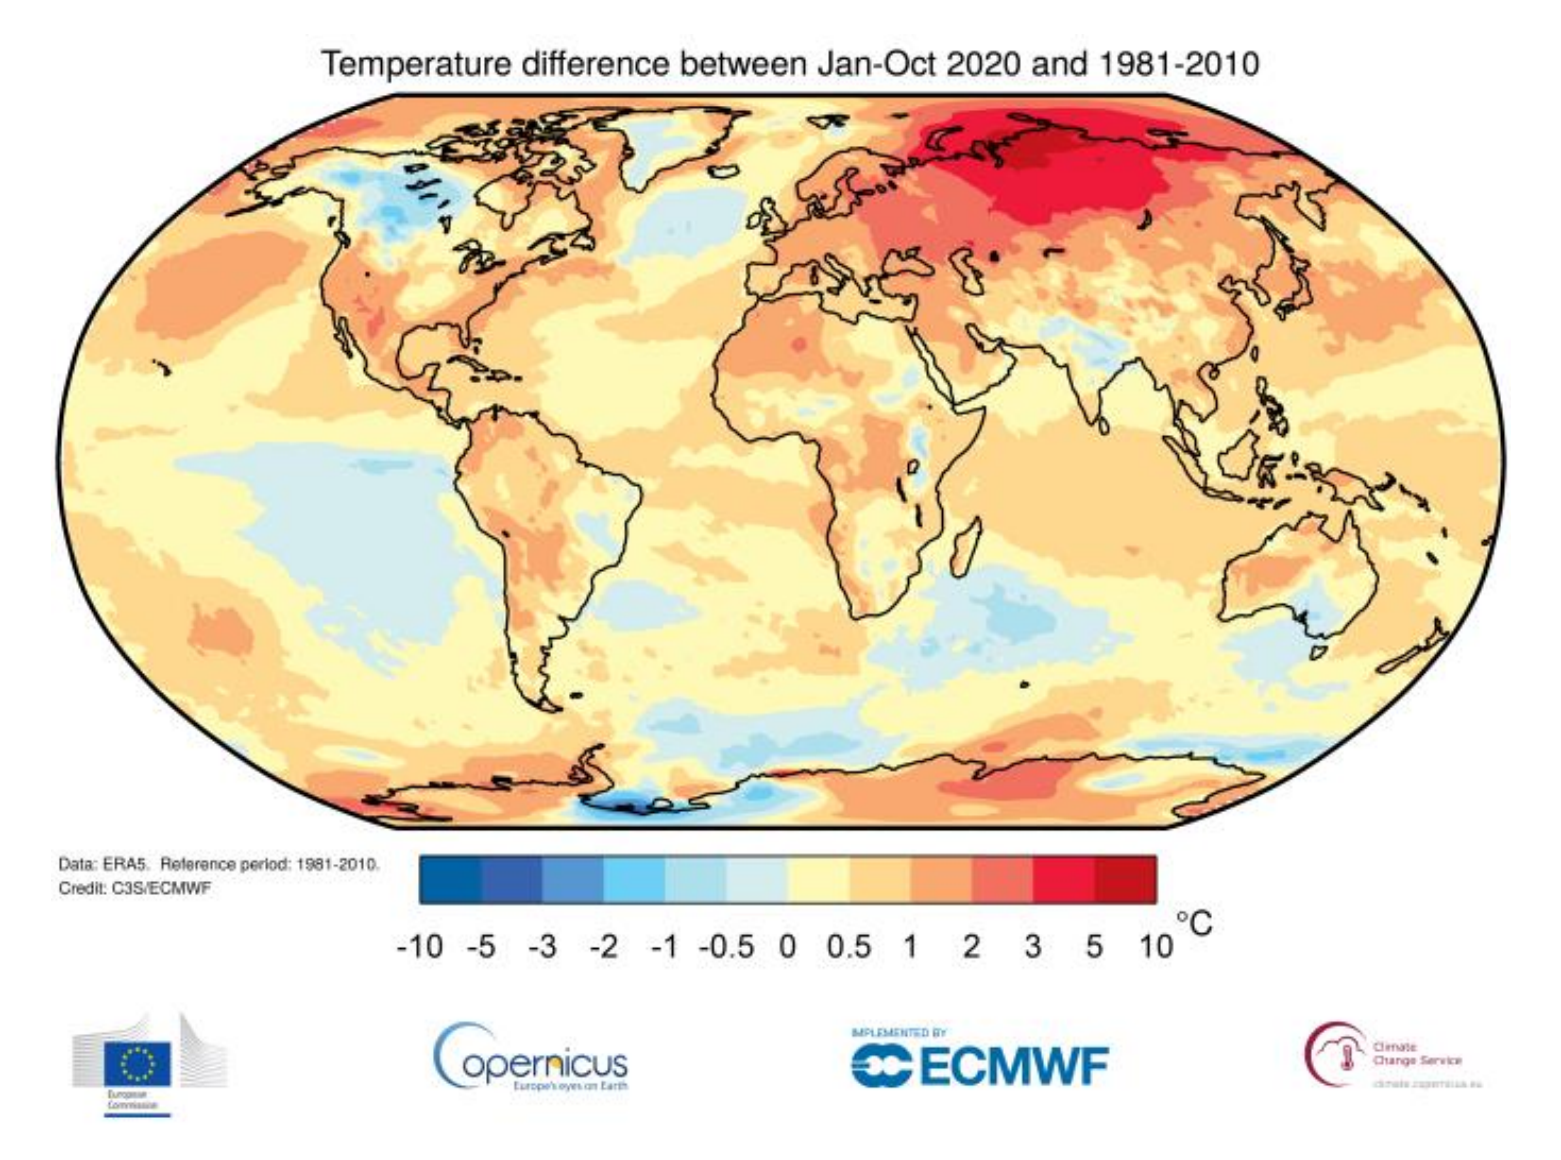
GENEVA, 2 December 2020 (WMO) – Climate change continued its relentless march in 2020, which is on track to be one of the three warmest years on record. 2011-2020 will be the warmest decade on record, with the warmest six years all being since 2015, according to the World Meteorological Organization. Ocean heat is at […]
By Thomas Frank 25 November 2020 (E&E News) – The county most at risk for coastal flooding is not in Florida, North Carolina or New Jersey, according to the Federal Emergency Management Agency. It’s not even on a coast. It’s Cowlitz County, Washington, population 102,000, about 50 miles inland from the Pacific Ocean on the […]
By Harrison Jones 31 July 2020 (Metro) – Temperature records were smashed in 2019 as the climate crisis had ‘an increasing impact’ on the UK, the Met Office has warned. The latest annual State of the UK Climate review shows the country continuing to warm, with 2019’s average temperature 1.1°C above long-term 1961-1990 levels. The […]