UK temperature records smashed in 2019 – “Our report shows climate change is exerting an increasing impact on the UK’s climate”
By Harrison Jones
31 July 2020
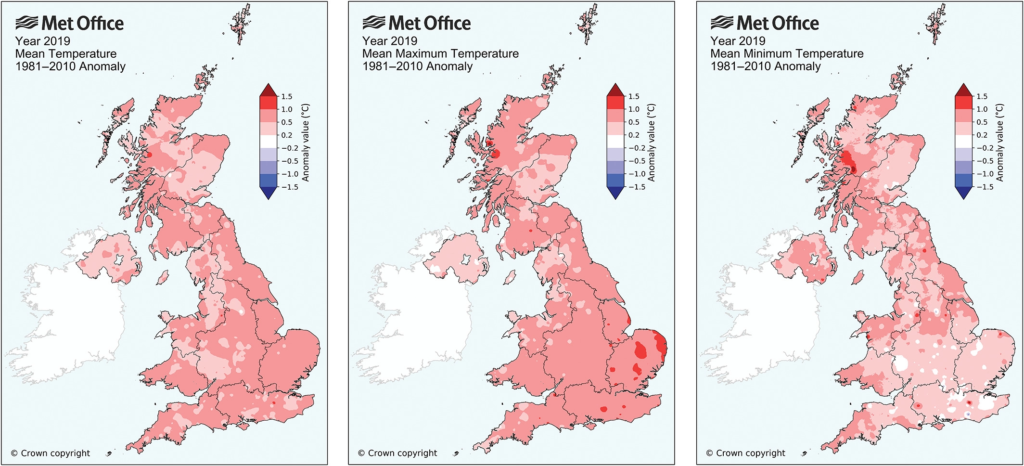
(Metro) – Temperature records were smashed in 2019 as the climate crisis had ‘an increasing impact’ on the UK, the Met Office has warned. The latest annual State of the UK Climate review shows the country continuing to warm, with 2019’s average temperature 1.1°C above long-term 1961-1990 levels.
The most recent decade has been 0.9°C warmer across the UK than the 1961-1990 average, the report added, as experts warned it represented records ‘we shouldn’t be breaking’ – with the country set to bake in the hottest day of the year yet. Last year was most notable for breaking records, with the UK recording its hottest temperature ever as the mercury soared to 38.7°C at Cambridge University Botanic Gardens on July 25.
That was not the only temperature high seen in 2019, with a new winter record of 21.2°C set on February 26, at London’s Kew Gardens, the first time 20°C has been reached in the UK in a winter month. There was also a new December record of 18.7°C on the 28th in Achfary, Sutherland. A new record for the mildest daily minimum temperature for February was set when temperatures did not dip below 13.9°C in Achnagart in the Highlands. No cold temperature records were set last year, the report added.
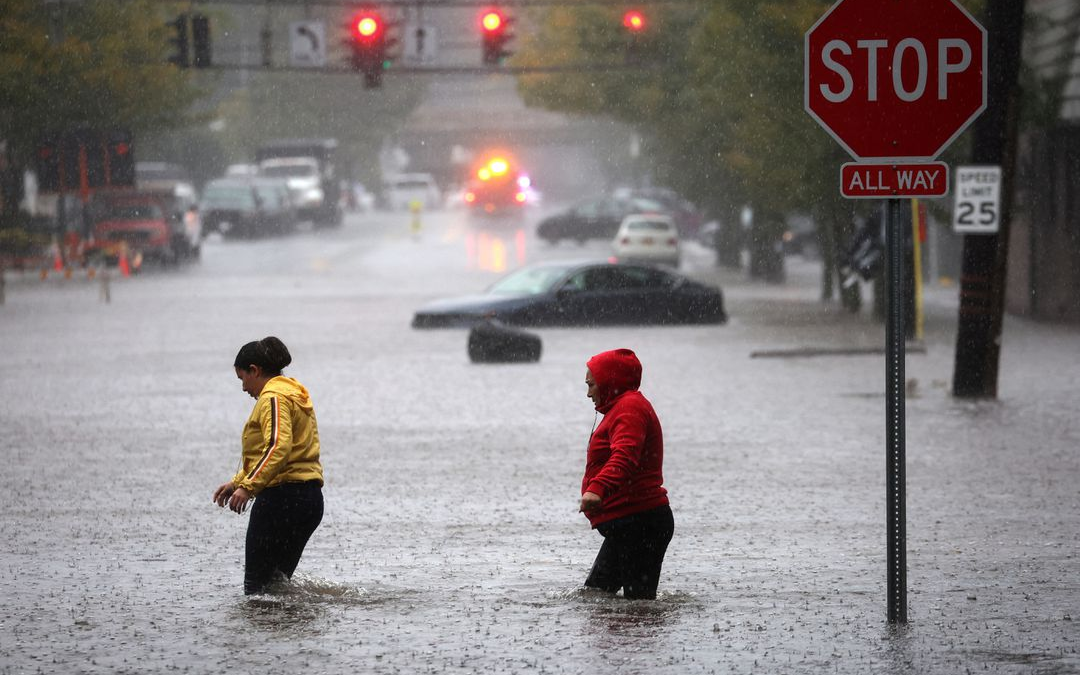
The changing climate is also bringing other extremes, with flooding hitting parts of Lincolnshire in mid-June, parts of the Pennines and northern England in late July, and South Yorkshire, Derbyshire, Nottinghamshire and Lincolnshire in November 2019.
All of the 10 warmest years in the UK in records dating back to 1884 have occurred since 2002, though 2019 was outside the top 10, in 12th place.
And the Central England Temperature series, the longest continuous temperature record in the world, which has data for an area of central England stretching back to 1659, provides evidence that the 21st century so far has overall been warmer than the previous three centuries, the Met Office said.
Met Office lead author Mike Kendon said: ‘Our report shows climate change is exerting an increasing impact on the UK’s climate.
‘This year was warmer than any other year in the UK between 1884 and 1990, and since 2002 we have seen the warmest 10 years in the series.
‘By contrast, to find a year in the coldest 10 we have to go back to 1963 – over 50 years ago.’ [more]
UK temperature records smashed in 2019, damning climate change report warns
State of the UK Climate 2019
EXECUTIVE SUMMARY
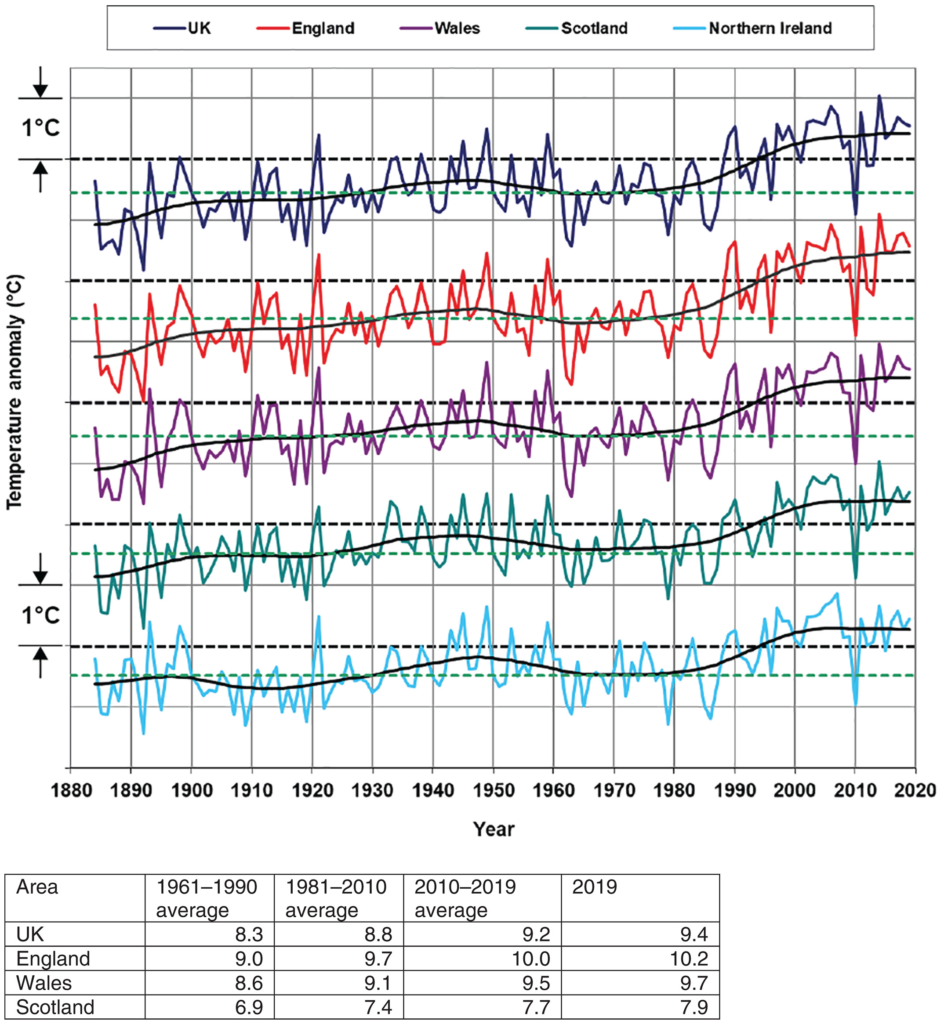
Land temperature
- 2019 was the 12th warmest year for the UK in a series from 1884, and 24th warmest for Central England in a series from 1659.
- Four national UK high temperature records were set in 2019: a new all‐time record (38.7°C), a new winter record (21.2°C), a new December record (18.7°C) and a new February minimum temperature record (13.9°C). No national low temperature records were set.
- February 2019 was the second warmest February in the series from 1884 and the warmest February for daily maximum temperature.
- All the top 10 warmest years for the UK in the series from 1884 have occurred since 2002.
- The most recent decade (2010–2019) has been on average 0.3°C warmer than the 1981–2010 average and 0.9°C warmer than 1961–1990.
- The Central England Temperature (CET) series provides evidence that the 21st century so far has overall been warmer than the previous three centuries.
Air and ground frost
- 2019 was the sixth consecutive year where the number of air and ground frosts was below average. The number of ground frosts was 10th lowest in a series from 1961.
- The most recent decade (2010–2019) has had 6% fewer days of air frost and 10% fewer days of ground frost compared to the 1981–2010 average, and both 16% fewer compared to 1961–1990.
Near‐coast SST
- 2019 was the fourth warmest year for UK near‐coastal SST in a series from 1870.
- The most recent decade (2010–2019) has been on average 0.3°C warmer than the 1981–2010 average and 0.6°C warmer than 1961–1990.
- Nine of the 10 warmest years for near‐coast SST for the UK have occurred since 2002.
Precipitation
- 2019 rainfall for the UK overall was 107% of the 1981–2010 average and 112% of the 1961–1990 average.
- England and Wales had its fifth wettest autumn in a series from 1766, although much less wet overall than autumn 2000 (the wettest autumn in the series).
- Six of the 10 wettest years for the UK in a series from 1862 have occurred since 1998.
- The most recent decade (2010–2019) has been on average 1% wetter than 1981–2010 and 5% wetter than 1961–1990 for the UK overall.
- For the most recent decade (2010–2019) UK summers have been on average 11% wetter than 1981–2010 and 13% wetter than 1961–1990. UK winters have been 4% wetter than 1981–2010 and 12% wetter than 1961–1990.
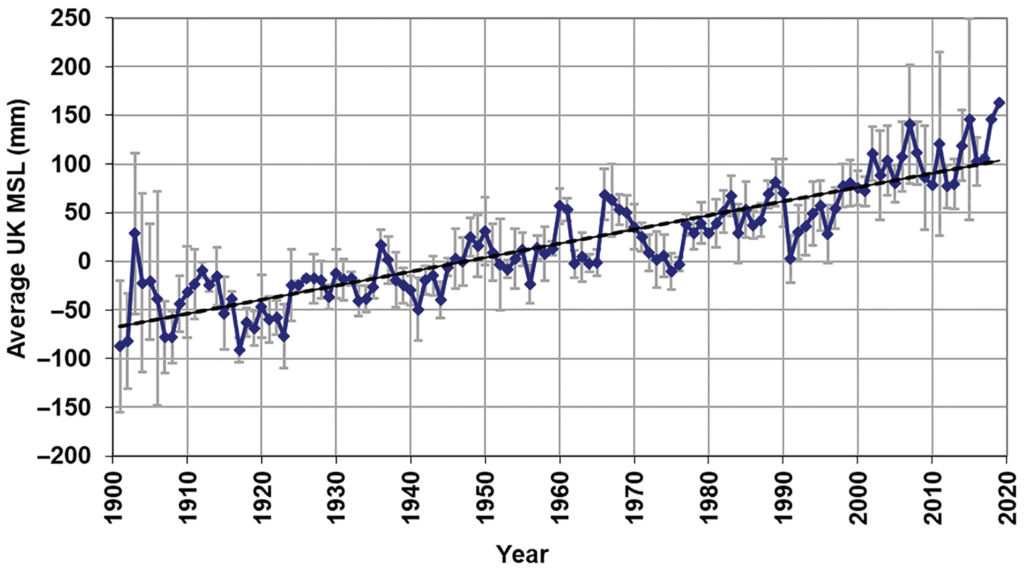
Sea‐level rise
- The UK mean sea level index for 2019 was the highest in the series from 1901, although uncertainties in the series mean caution is needed when comparing individual years.
- Mean sea level around the UK has risen by approximately 1.4 mm/yr from the start of the 20th century, when excluding the effect of vertical land movement.
- The 99th percentile water level (exceeded 1% of the time) at Newlyn, Cornwall for year 2019 was the third highest in the series from 1916, behind years 2014 and 2018.
Significant weather
- In late February, a new UK winter temperature record of 21.2°C was set during a record‐breaking warm spell, breaking the previous winter record by a wide margin.
- In late July, a new UK all‐time record of 38.7°C was set during a brief but exceptional heatwave.
- Flooding from persistent heavy rain affected parts of Lincolnshire in mid‐June, and flash‐flooding affected parts of the Pennines and northern England in late July.
- South Yorkshire, Derbyshire, Nottinghamshire and Lincolnshire experienced severe flooding in November 2019; at the time this event was the most severe flooding event in the UK since December 2015.
Phenology
- First leaf dates in 2019 were particularly early (on average 9.7 days earlier than the 1999–2018 baseline) for a range of common shrub/tree species. This was associated with relatively warm conditions in winter and early spring 2019.
- End of season bare tree dates in 2019 were slightly later (on average 2.4 days later than the baseline) for the same species.
- Overall, the 2019 leaf‐on season was extended by 12.2 days on average compared with the baseline.