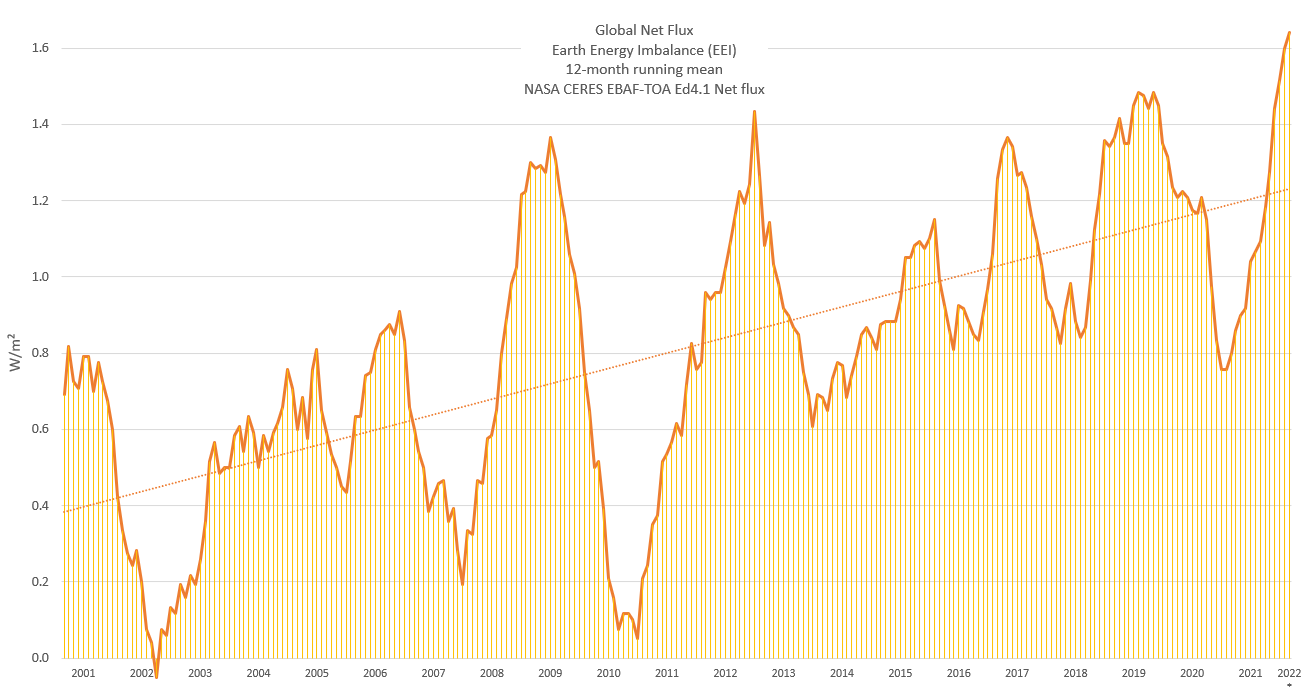
By Leon Simons 5 May 2022 (Twitter) – NASA data shows our Earth is heating at unprecedented speed: 1.64 W/m2. CERES radiative flux data for 2021 has come available. The annual Earth’s Energy Imbalance was +1.52 W/m2, the energy equivalent to 1 million Hiroshima sized atomic bombs every day. Another 12-month EEI record (from Mar […]
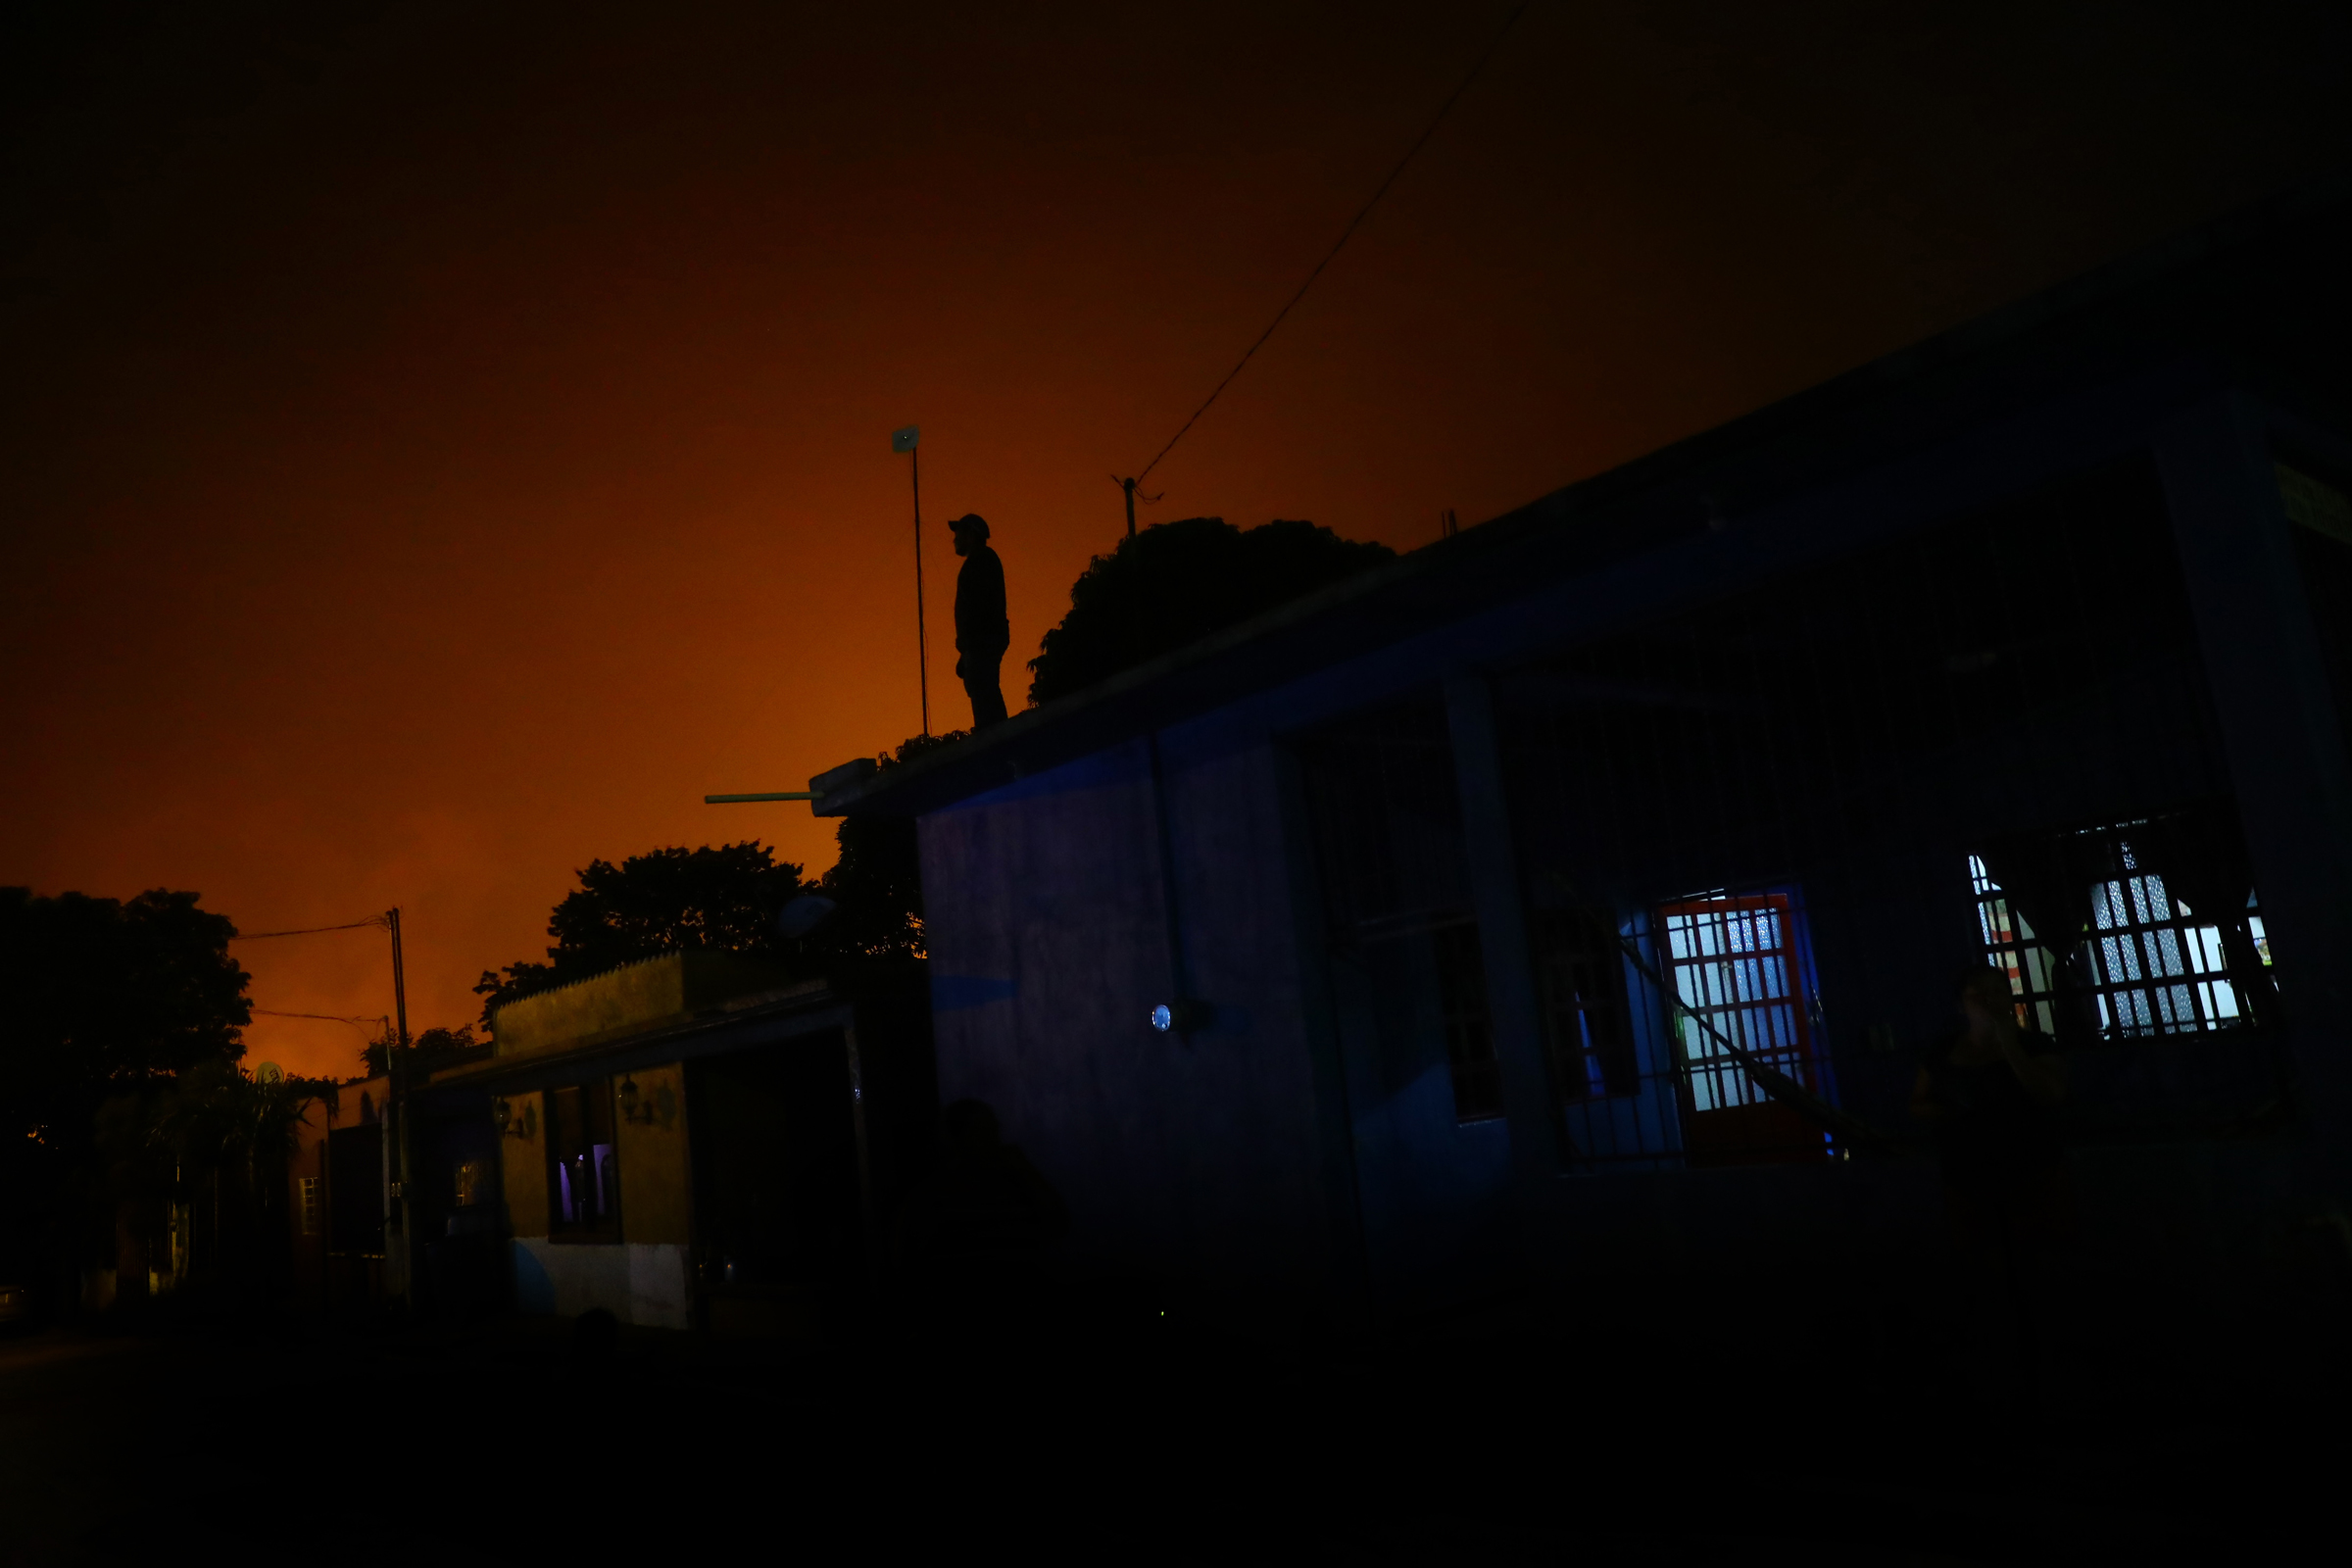
By Stefanie Eschenbacher 23 February 2022 (Reuters) – It never gets completely dark in Colonia El Carmen, home to Mexico’s largest natural gas processing center, in the poor southern state of Chiapas. After sunset, a red glare emanates from flares dotted around the Cactus gas processing center, run by state oil company Petroleos Mexicanos (Pemex). […]
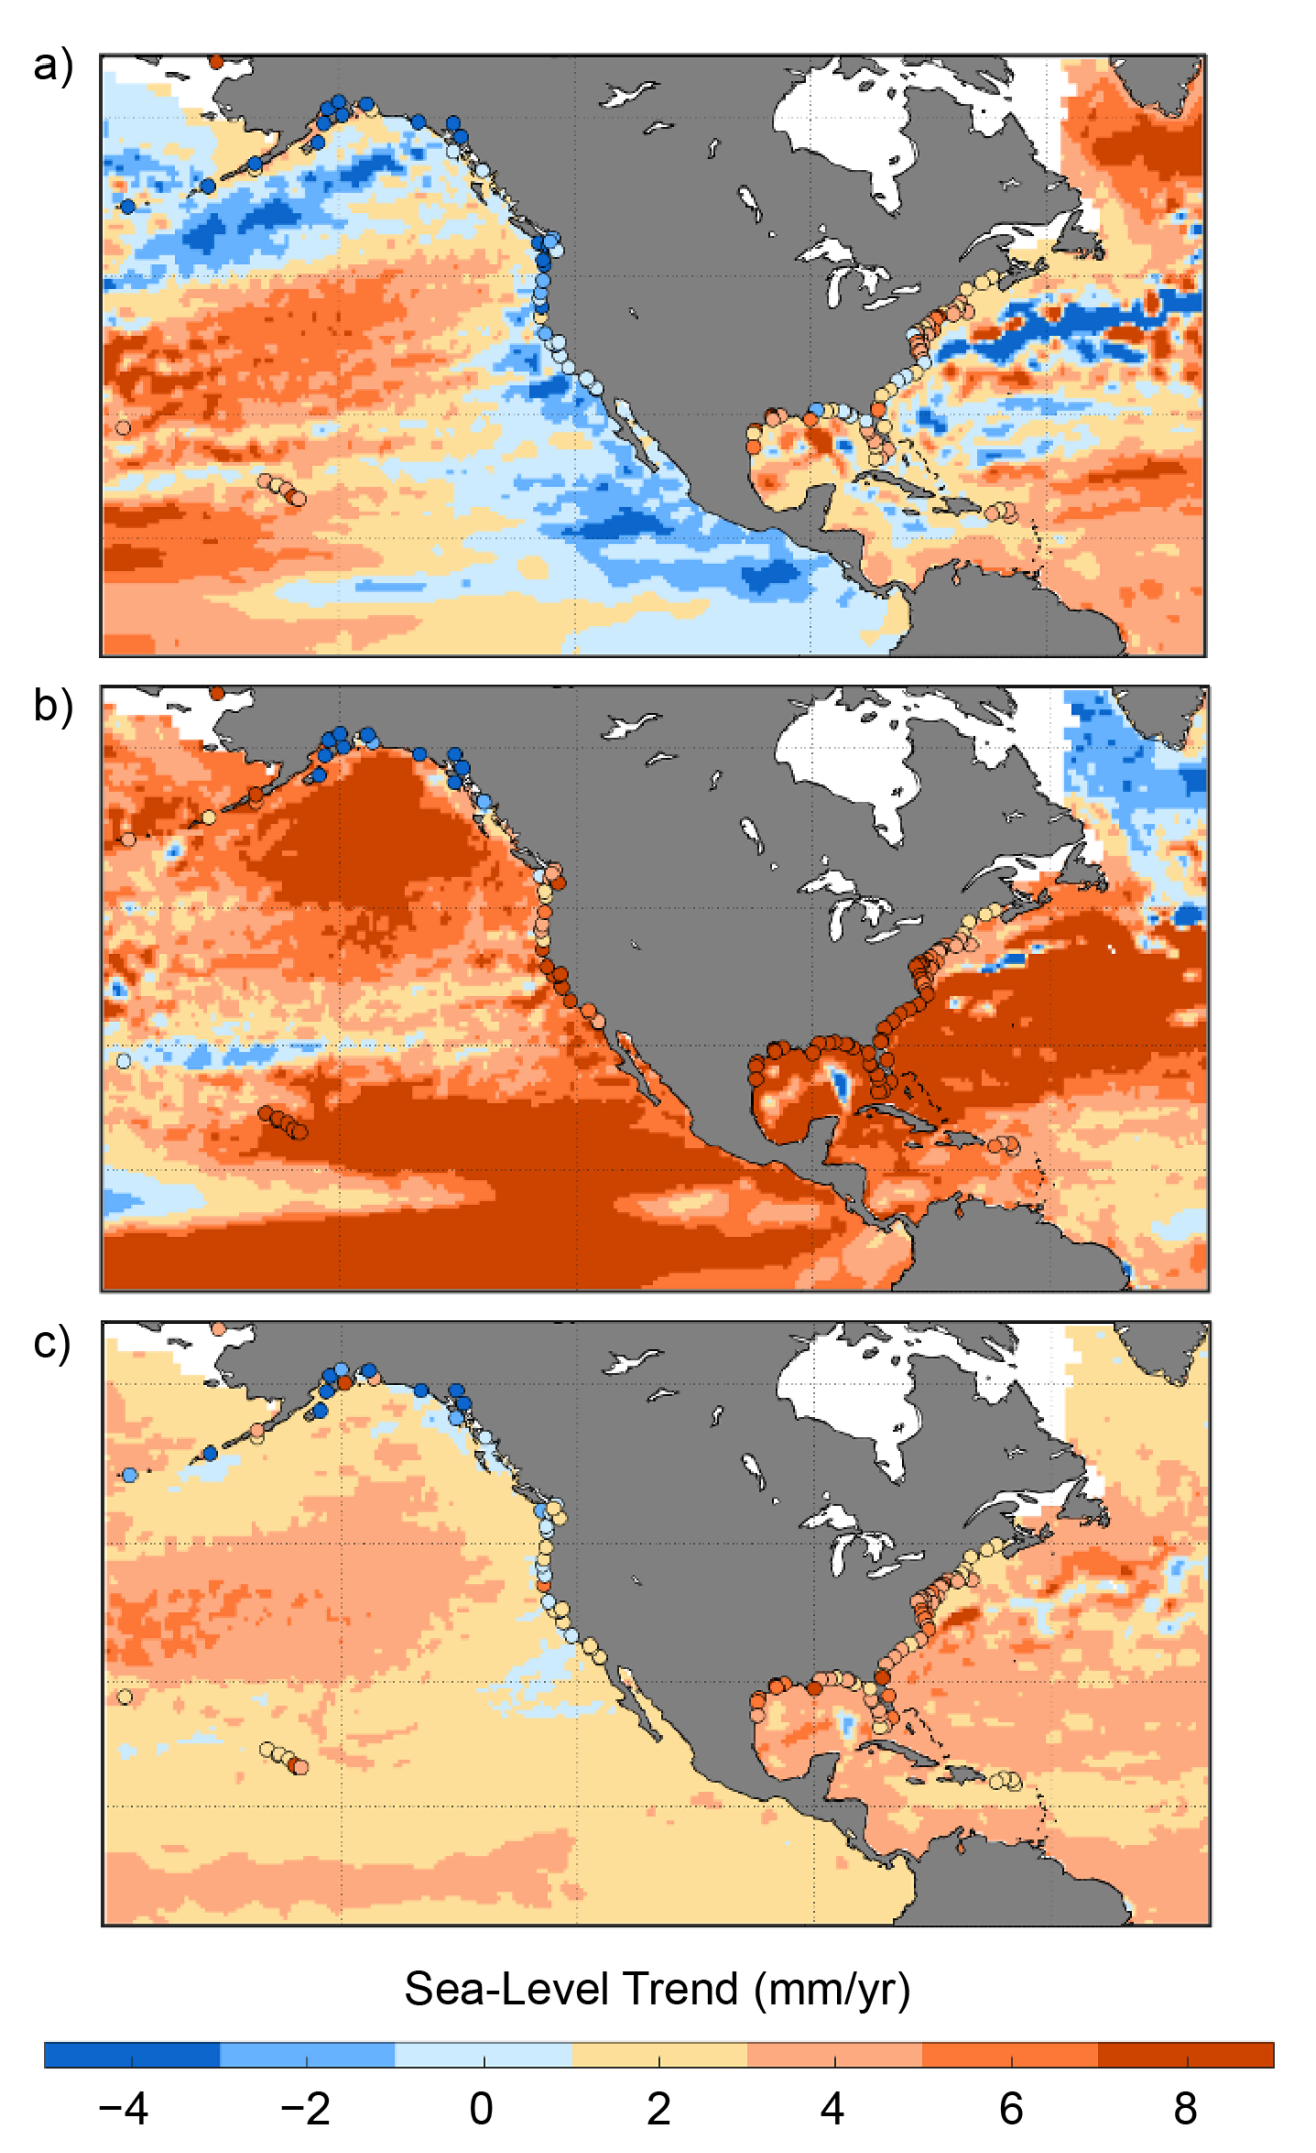
15 February 2022 (NOAA) – The United States is expected to experience as much sea level rise by the year 2050 as it witnessed in the previous hundred years. That’s according to a NOAA-led report updating sea level rise decision-support information for the U.S. released today in partnership with half a dozen other federal agencies. […]
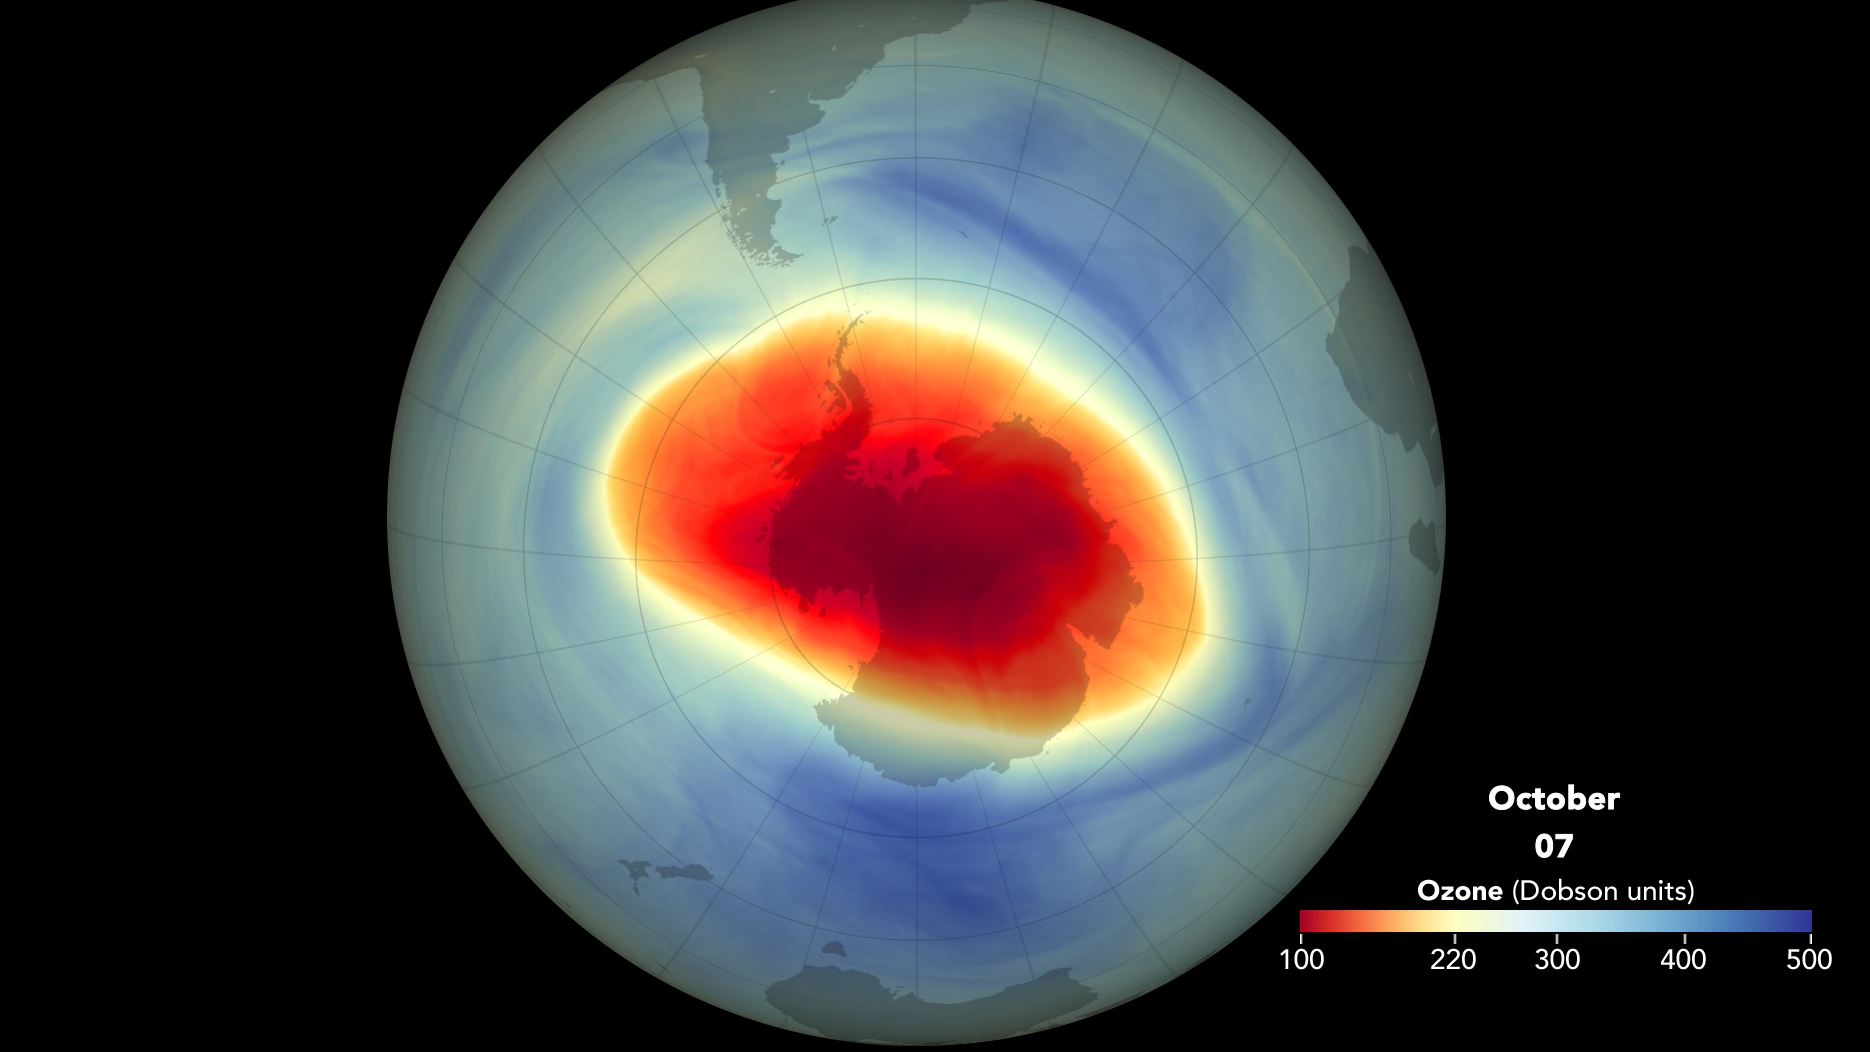
By Elizabeth Howell 5 November 2021 (Space.com) – A new NASA video highlights the giant ozone hole that opened over Antarctica this year. A cold Southern Hemisphere winter, and possible effects of global warming, have caused the hole to grow to its 13th-largest extent since 1979. The ozone depletion you see in the NASA video is monitored by three […]
By Adam Voiland 23 July 2021 (NASA) – While plumes of wildfire smoke from western North America have passed over the northeastern U.S. and Canada multiple times each summer in recent years, they often go unnoticed. That is because smoke that spreads far from its source typically moves at a fairly high altitude—between 5 and 10 kilometers—as […]
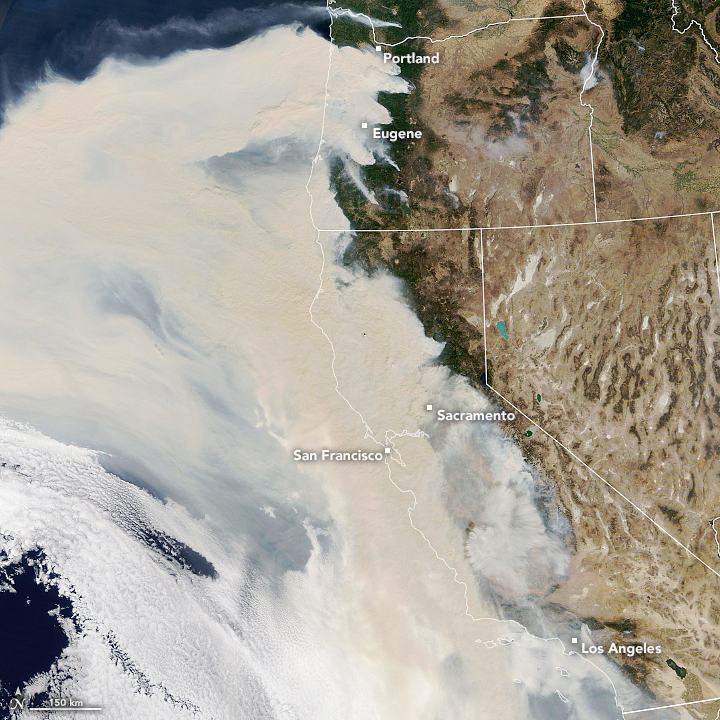
By Matthew Cappucci 12 September 2020 (The Washington Post) – More than 3.1 million acres have burned in California this year, part of a record fire season that still has four months to go. A suffocating cloud of smoke has veiled the West Coast for days, extending more than a thousand miles above the Pacific. And the […]
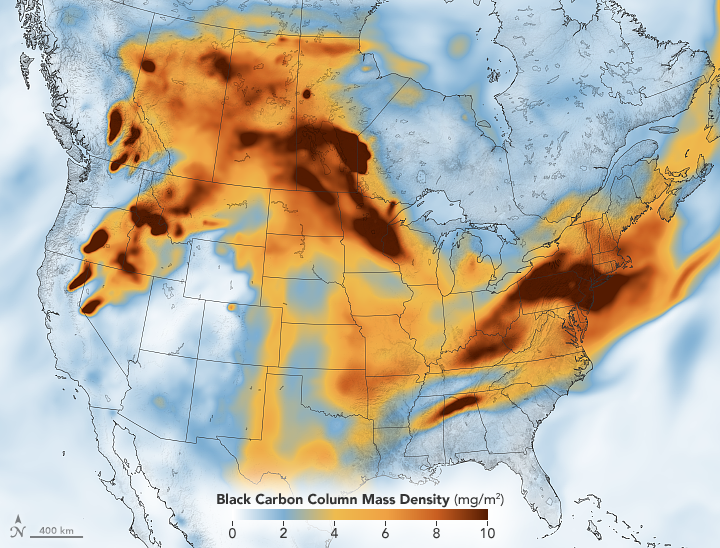
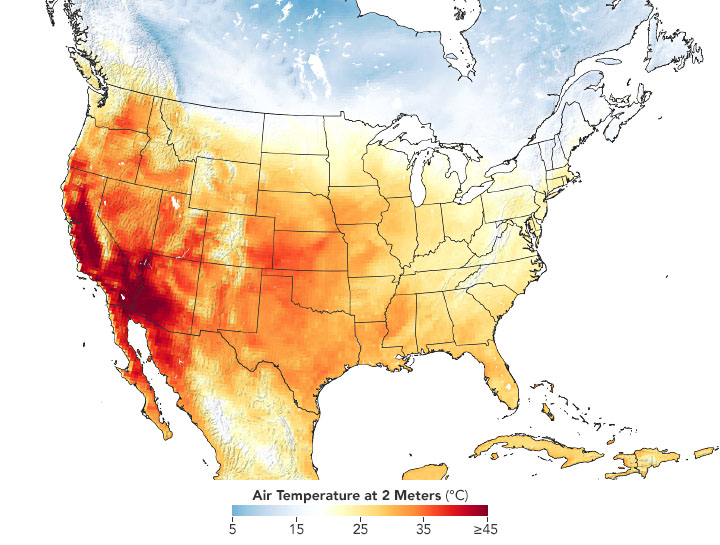
By Kasha Patel 11 September 2020 (NASA) – In early September 2020, an intense heatwave broke temperature records in several locations in Southern California. The dry, hot conditions helped fuel new and existing fires, which have consumed tens of thousands of acres of land. According to recently published research, these extremes fit a long-term trend toward longer and more […]
By Bob Henson 8 September 2020 (Yale Climate Connections) – Temperatures reached ghastly levels in southern California and wildfire carved a path close to two of the state’s iconic national parks as a historic heat dome gripped the western United States during the traditional end-of-summer Labor Day weekend. The heat had eased somewhat by Tuesday, […]
By Bob Henson 13 March 2020 (Weather Underground) – Research groups across the world concur that this past northern winter (December-February) was the second-warmest on record globally, in records going back more than a century. The latest group to confirm this finding is NOAA, in its monthly State of the Climate report issued Friday. The winter result […]
By Kasha Patel 28 February 2020 (NASA) – NASA and European Space Agency (ESA) pollution monitoring satellites have detected significant decreases in nitrogen dioxide (NO2) over China. There is evidence that the change is at least partly related to the economic slowdown following the outbreak of coronavirus. At the end of 2019, medical professionals in […]