California heatwaves are becoming more frequent and lasting longer – “This has serious consequences for the fire season in Southern California”
By Kasha Patel
11 September 2020
(NASA) – In early September 2020, an intense heatwave broke temperature records in several locations in Southern California. The dry, hot conditions helped fuel new and existing fires, which have consumed tens of thousands of acres of land. According to recently published research, these extremes fit a long-term trend toward longer and more intense heatwaves in Southern California.
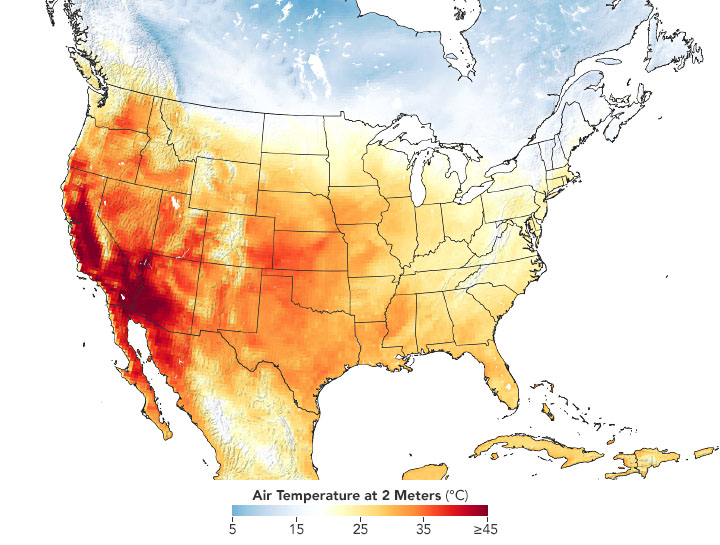
The map above shows air temperatures across the United States on 6 September 2020, when much of the Southwest roasted in a dramatic heatwave. The map was derived from the Goddard Earth Observing System (GEOS) model and represents temperatures at 2 meters (about 6.5 feet) above the ground. The darkest red areas are where the model shows temperatures surpassing 113°F (45°C).
On 6 September 2020, around 1:30 p.m., Los Angeles County recorded its highest temperature ever at 121°F (49°C) at Woodland Hills. Several other cities, like Paso Robles and Palmdale, also hit record highs.
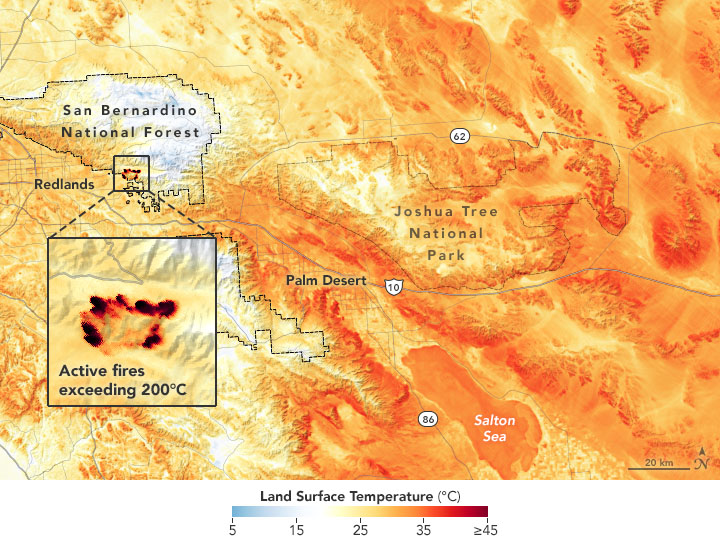
The map below shows land surface temperatures (LSTs) on September 6 near San Bernardino National Forest. The data come from NASA’s ECOsystem Spaceborne Thermal Radiometer Experiment on Space Station (ECOSTRESS), which uses a scanning radiometer to measure thermal infrared energy emitted from Earth’s surface. Note that LSTs are not the same as air temperatures: They reflect how hot the surface of the Earth would feel to the touch and can sometimes be significantly hotter or cooler than air temperatures. (The map also captures the El Dorado fire, which had burned more than 11,000 acres and was 19 percent contained as of September 9.)
The extreme heat comes only weeks after another record-breaking heatwave in California. In August 2020, Death Valley reached 130 degrees Fahrenheit—possibly the highest temperature ever reliably recorded on Earth. The widespread extreme conditions tapped into subtropical moisture that spurred thunderstorms, hundreds of thousands of lightning bolts, and hundreds of wildfires across the state.
These recent heatwaves are “not surprising at all” to Glynn Hulley, a climate researcher at NASA’s Jet Propulsion Laboratory. A heatwave is defined as a period when temperatures in a region are outside of their historical average for usually two or more days. “Heatwaves are becoming more frequent, lasting longer, and increasing in nighttime temperature and humidity, particularly in urban regions such as the Los Angeles basin.”
Hulley and colleagues published a study in July 2020 showing how heatwaves became more frequent, intense, and longer-lasting in Southern California from 1950 to 2020. Using ground-based data from the National Oceanic and Atmospheric Administration, the team examined temperatures over inland urban, rural, and coastal urban areas. Heatwave activity showed the largest change in inland urban areas such as Los Angeles County, which Hulley said is most likely because they are farther away from coastal breezes and because urban areas act as heat islands—consisting of less cooling vegetation and more heat-absorbing surfaces (roads, buildings) that re-radiate heat stored during the daytime.
The graphs below show the number of heatwaves per year, the duration, and the intensity for inland urban areas from 1950 to 2020. The dotted line represents the average value of three heatwave definitions currently accepted by the research community. The shaded areas show the standard deviation. Intensity is calculated as the maximum temperature during a heatwave minus the average heatwave temperature.
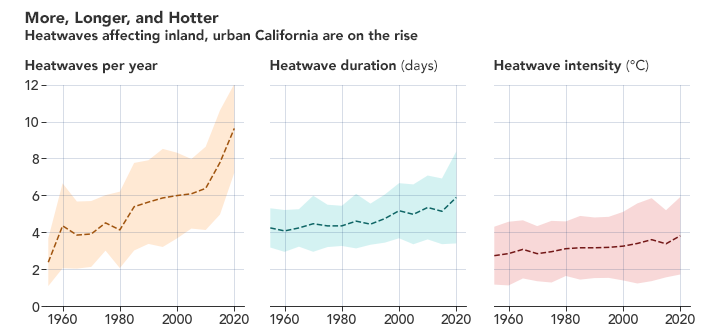
Hulley and colleagues found statistically significant spikes in heatwave activity during severe droughts, particularly the record 2012-2016 California drought. During extreme droughts, heatwaves increased from about four times per year to six times. They also increased in length from five to six days on average.
A major reason for increased heatwaves is warmer nighttime temperatures in Southern California, which increased approximately 0.41°C per decade. This trend more than doubles when humidity (i.e., heat index) is taken into account.
“The heatwaves that end up killing a lot of people are really warm, humid nighttime heatwaves, and they are going to become more common,” said Brian Kahn, a co-author on the study and researcher at NASA’s Jet Propulsion Laboratory. “Nighttime is normally your chance to cool off, but now there’s less relief from the heatwave.”
Hulley said the September 2020 heatwave may not be the last one of the year. The study found that heatwaves in Southern California are occurring earlier and persisting later in the year, resulting in a longer heatwave season. In the mid-20th century, the first heatwaves typically began in May and ended in late August. Today, they start in March and end as late as September or October.
“This has serious consequences for the fire season in Southern California, which peaks during the fall season when strong desert Santa Ana winds further enhance aridity and the drying out of vegetation,” said Hulley.
California Heatwave Fits a Trend
Rising Trends in Heatwave Metrics Across Southern California
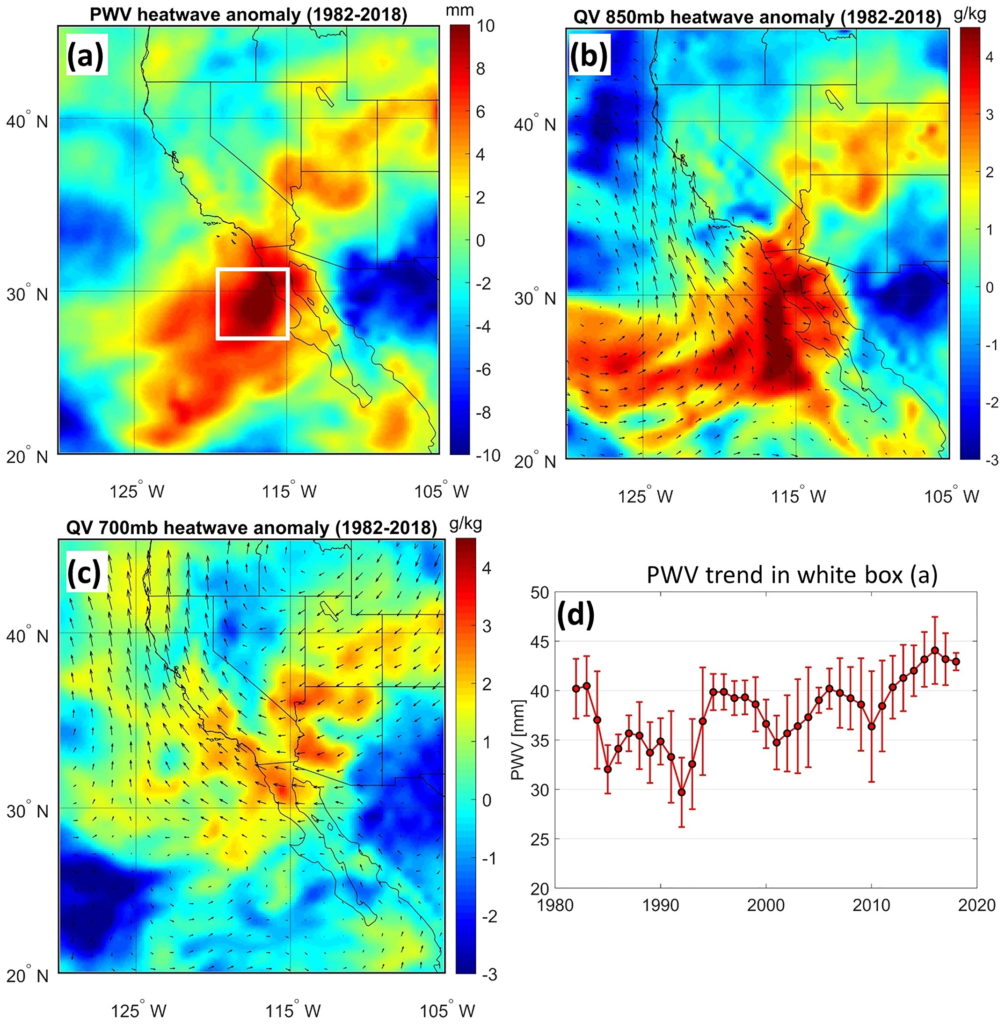
ABSTRACT: Research on heatwaves has gained significant impetus over the past decade due to a warming planet and rapid 21st century urbanization. This study examines driving factors influencing heatwave trends and interannual variability across Southern California (SoCal) from 1950–2020. Inland urban areas of Los Angeles county are the most susceptible to heatwaves with strong increasing trends in frequency, duration, and intensity that are closely tied to nighttime warming. Coastal and rural areas are less impacted but show a significant increase in heatwave frequency over the past two decades. Heatwave nighttime temperatures combined with high humidity have been increasing at a rapid rate of ~1°C/decade since the 1980s—elevating heat stress and mortality risk to vulnerable urban communities. The increased nighttime humidity is associated with an anomalous moisture source off the coast of Baja California that has intensified over the past decade and is linked to ocean warming trends and changes in the California current system. Heatwaves are starting earlier and ending later in the year for urban regions. This augments public health risks and sets the stage for more intense fall wildfires by enhancing the drying of fuels. Droughts and heatwaves are strongly linked, particularly in inland urban and rural areas that have a high statistical probability of heatwaves increasing in frequency (42%), duration (26%), and daily mean temperature (2.2%) during severe drought conditions. Better understanding of heatwave climate drivers and underlying physical processes could help with prediction skill, in addition to providing effective data‐driven recommendations for mitigation efforts in SoCal’s vulnerable urban regions.
Rising Trends in Heatwave Metrics Across Southern California