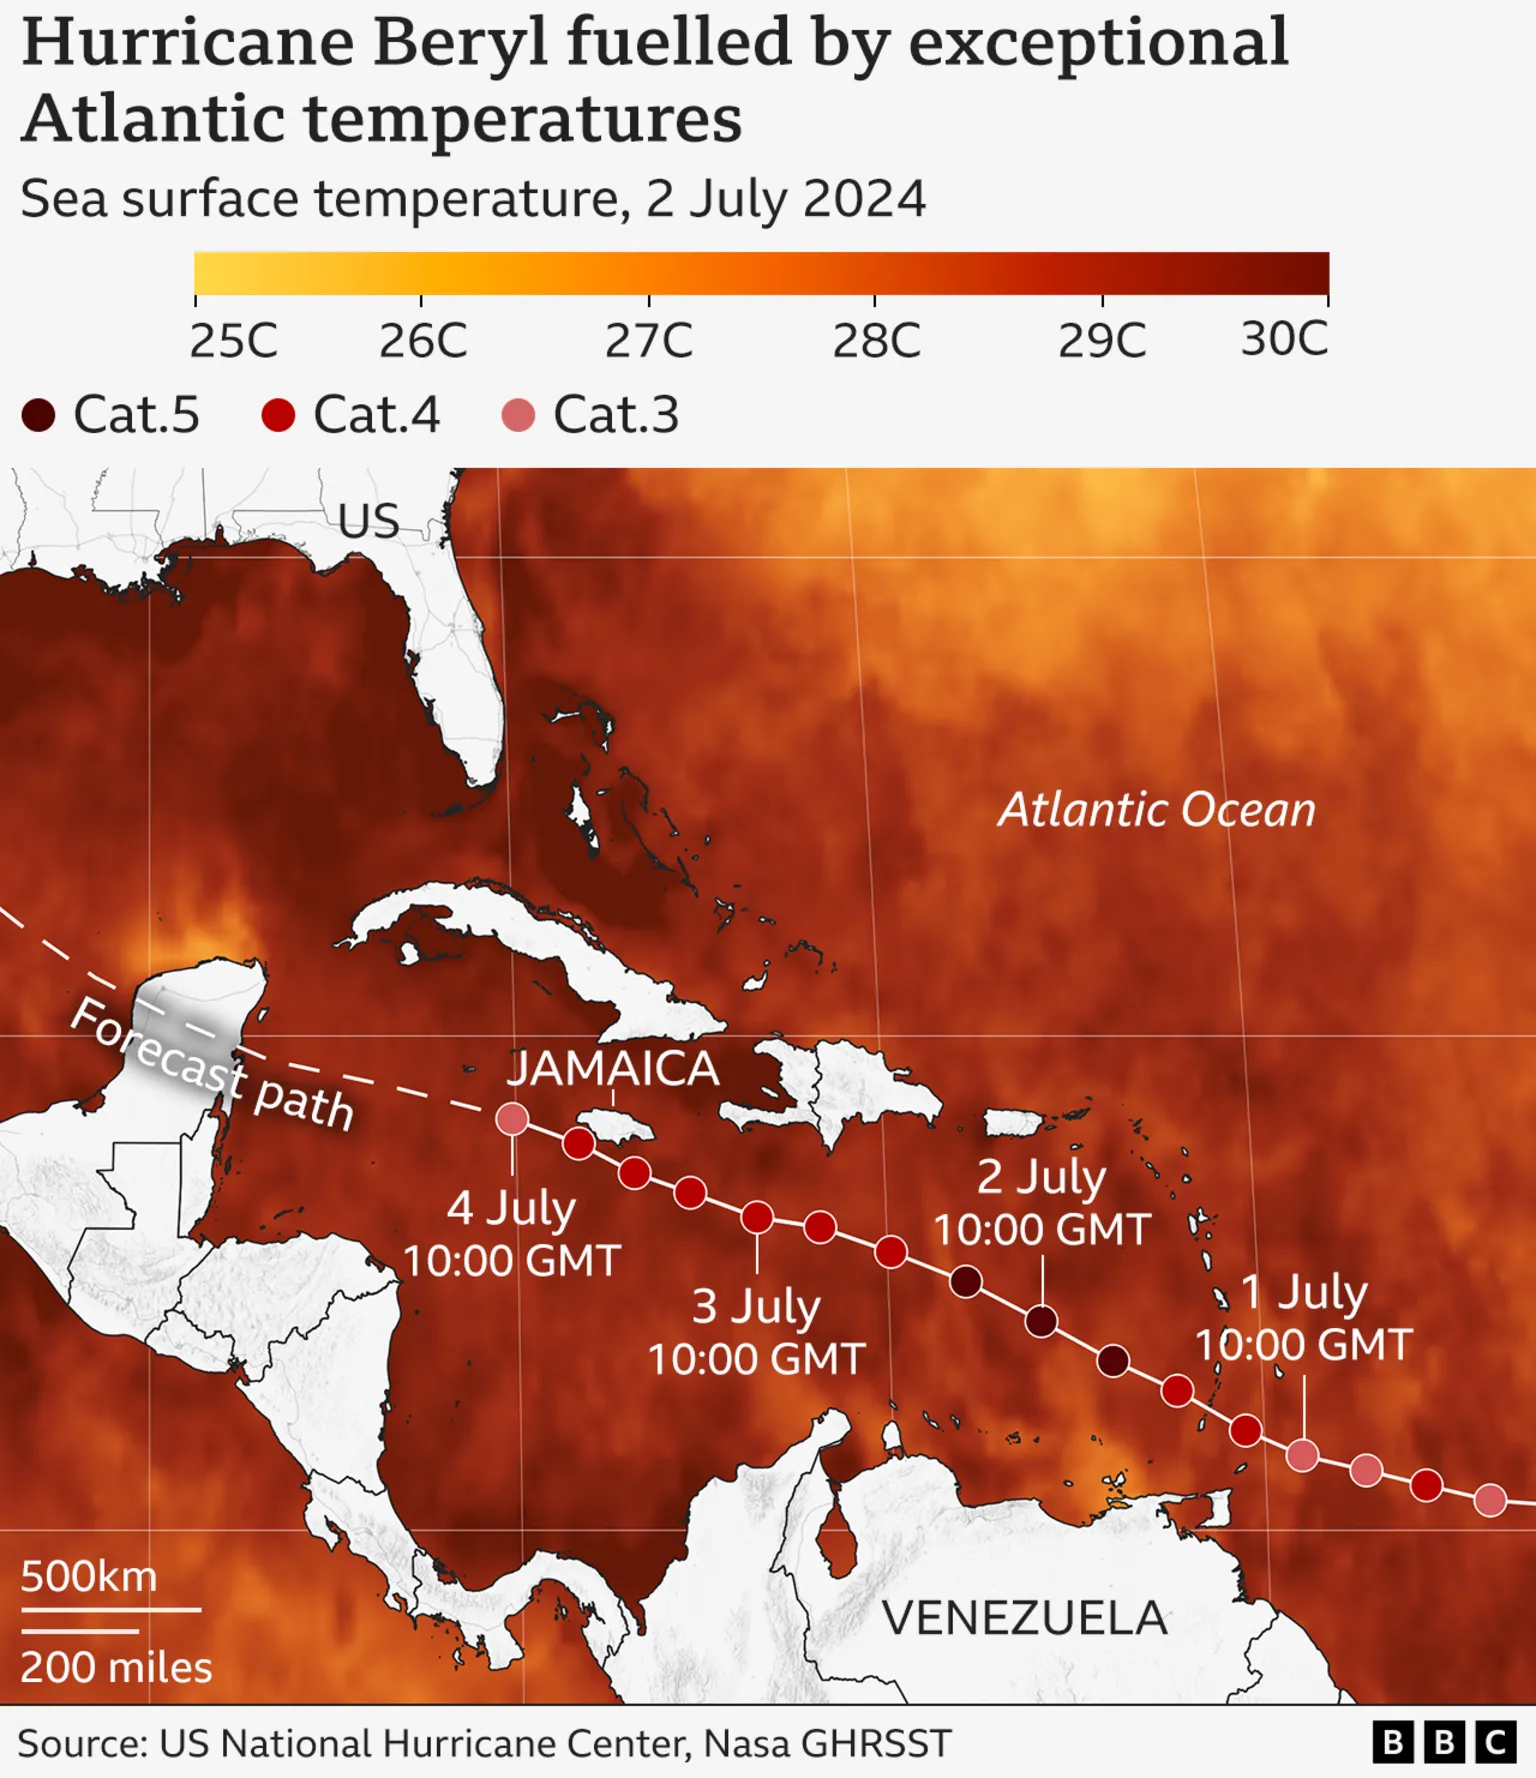
By Mark Poynting 4 July 2024 (BBC News) – Hurricane Beryl is wreaking havoc in parts of the Caribbean – and putting the role of climate change under the spotlight. With maximum sustained wind speeds of more than 160mph (257km/h), it became the earliest category five Atlantic hurricane in records going back around 100 years. […]
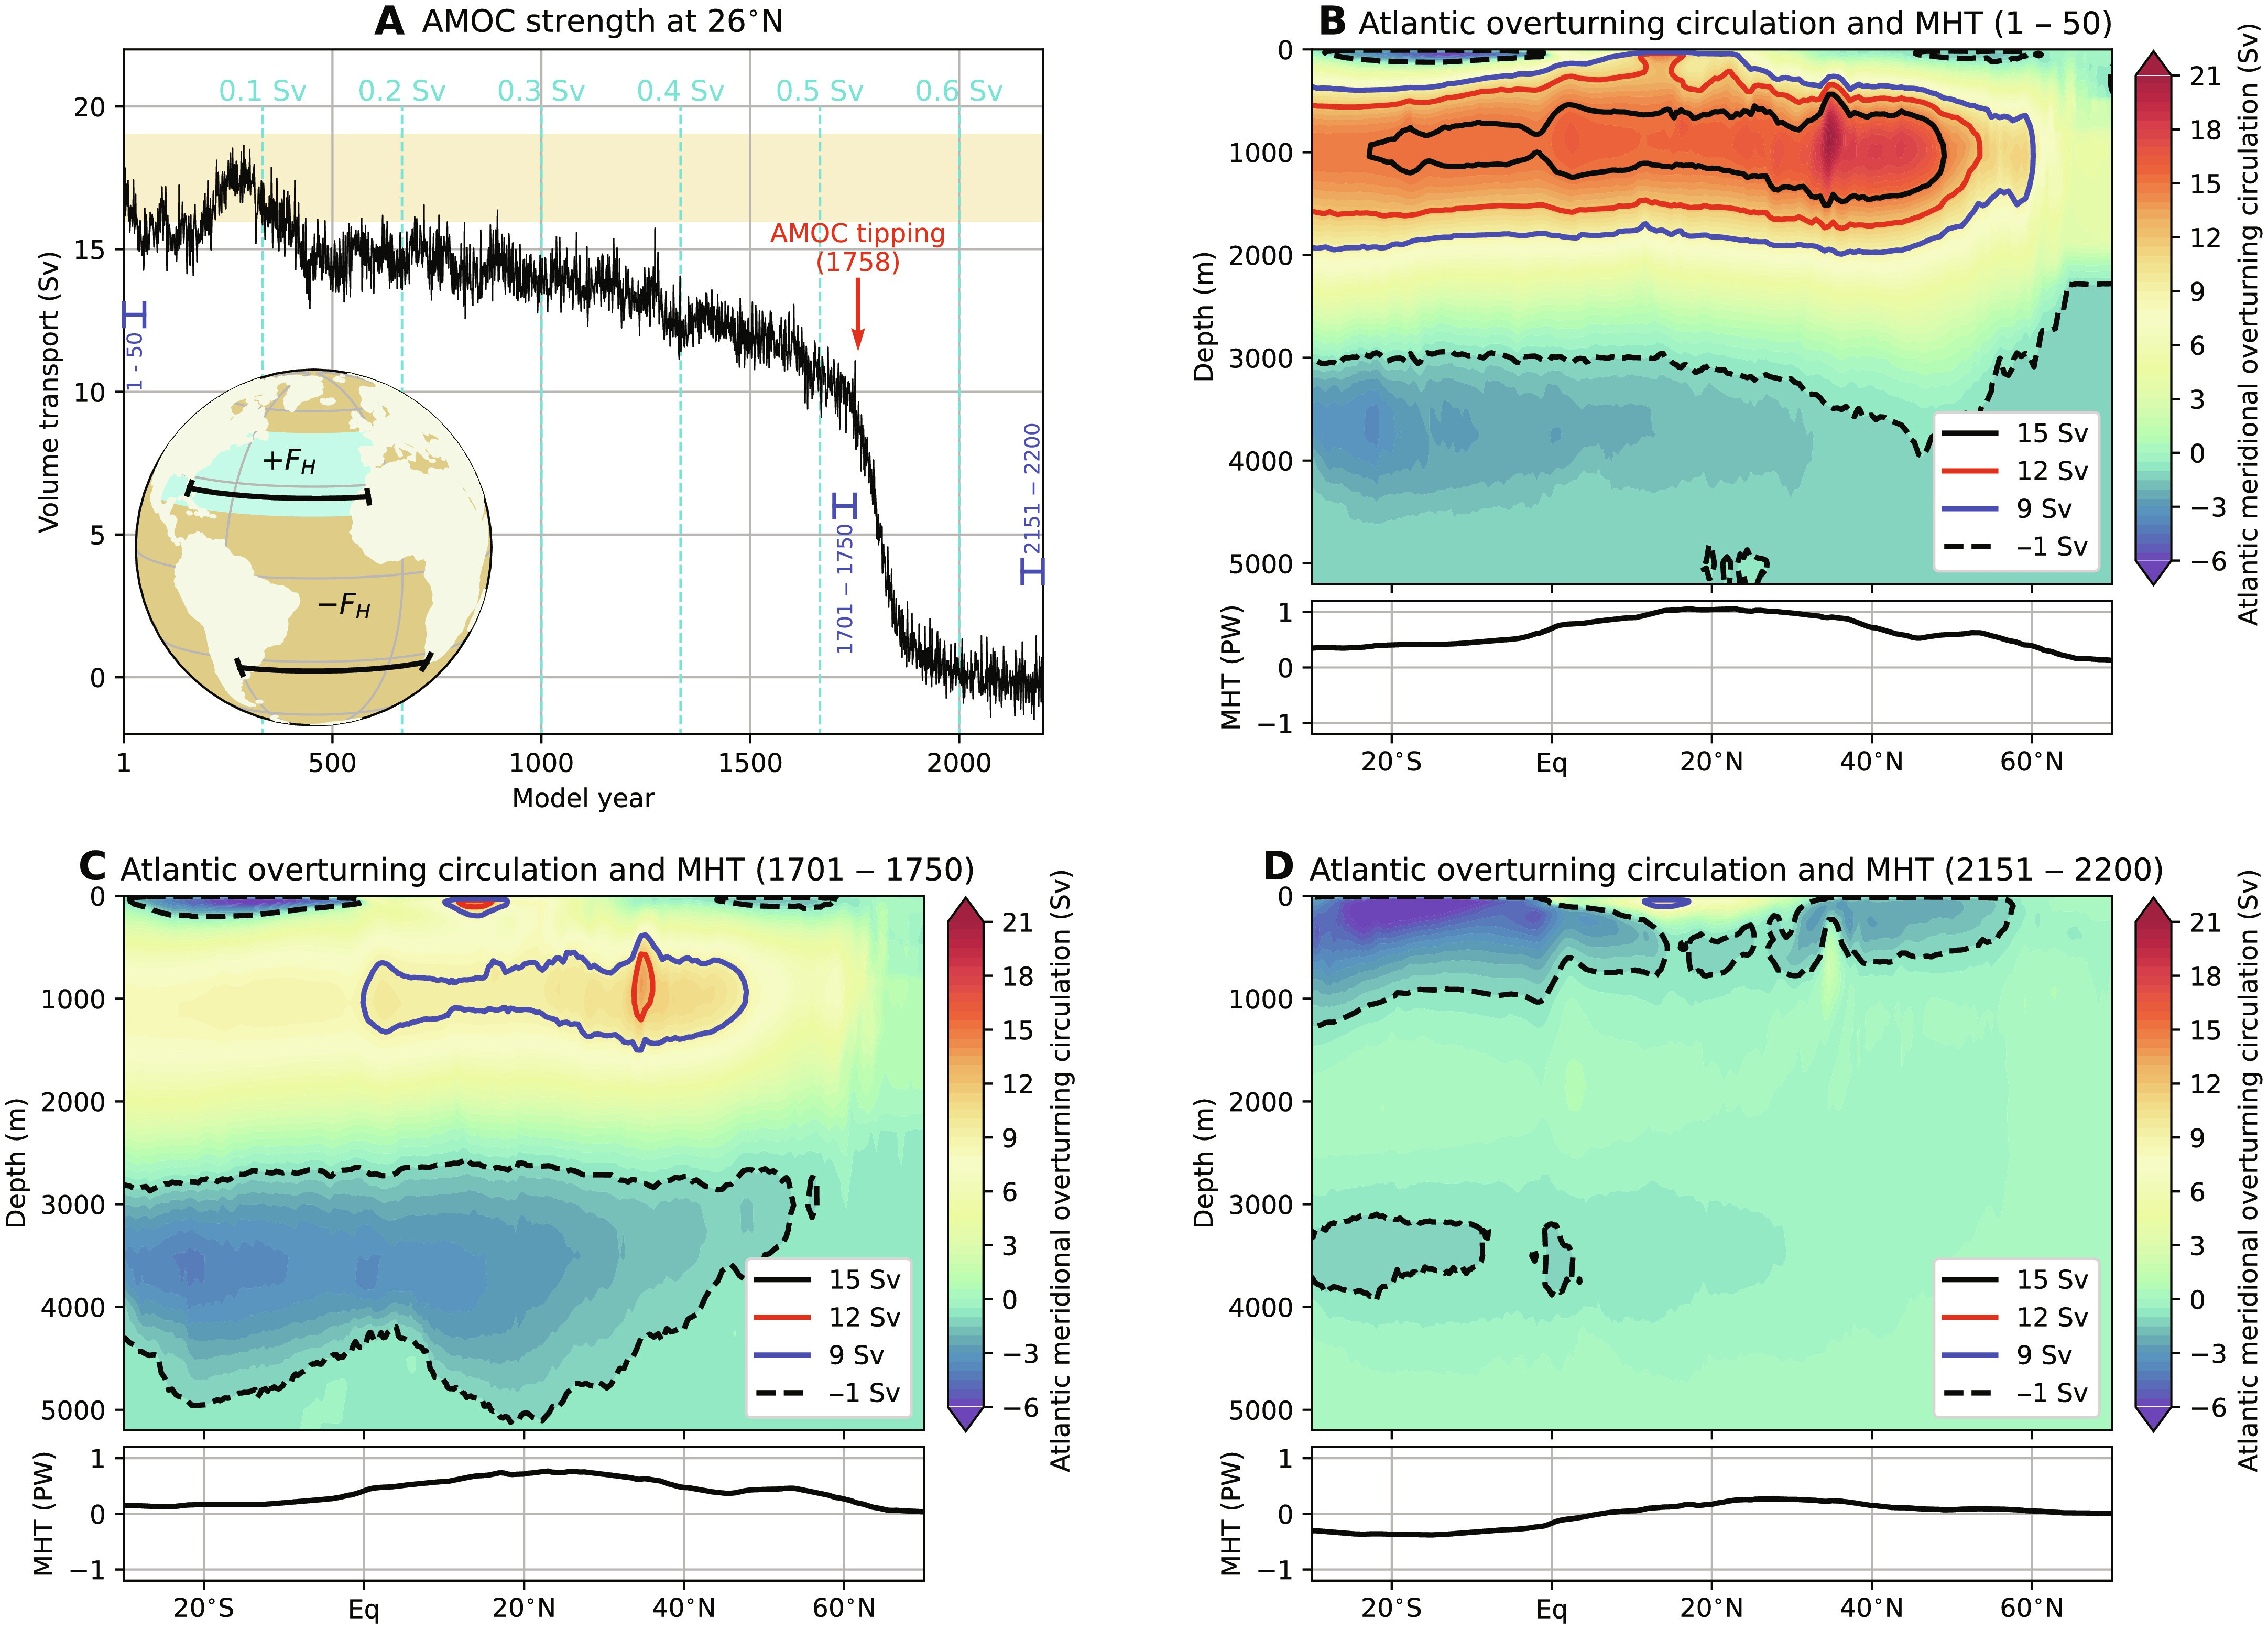
By Stephanie Pappas 9 February 2024 (Live Science) – Scientists have discovered a key warning sign before a crucial Atlantic current collapses and plunges the Northern Hemisphere into climate chaos. The Atlantic Meridional Overturning Circulation (AMOC) carries warm water north from the Southern Hemisphere, where it releases heat and freezes. The freezing process concentrates salt […]
By Rosanna Xia 6 May 2024 (Los Angeles Times) – For several years now, one question has held the key to understanding just how much we should worry about the hundreds of tons of DDT that had been dumped off the coast of Los Angeles: How, exactly, has this decades-old pesticide — a toxic chemical spread across […]
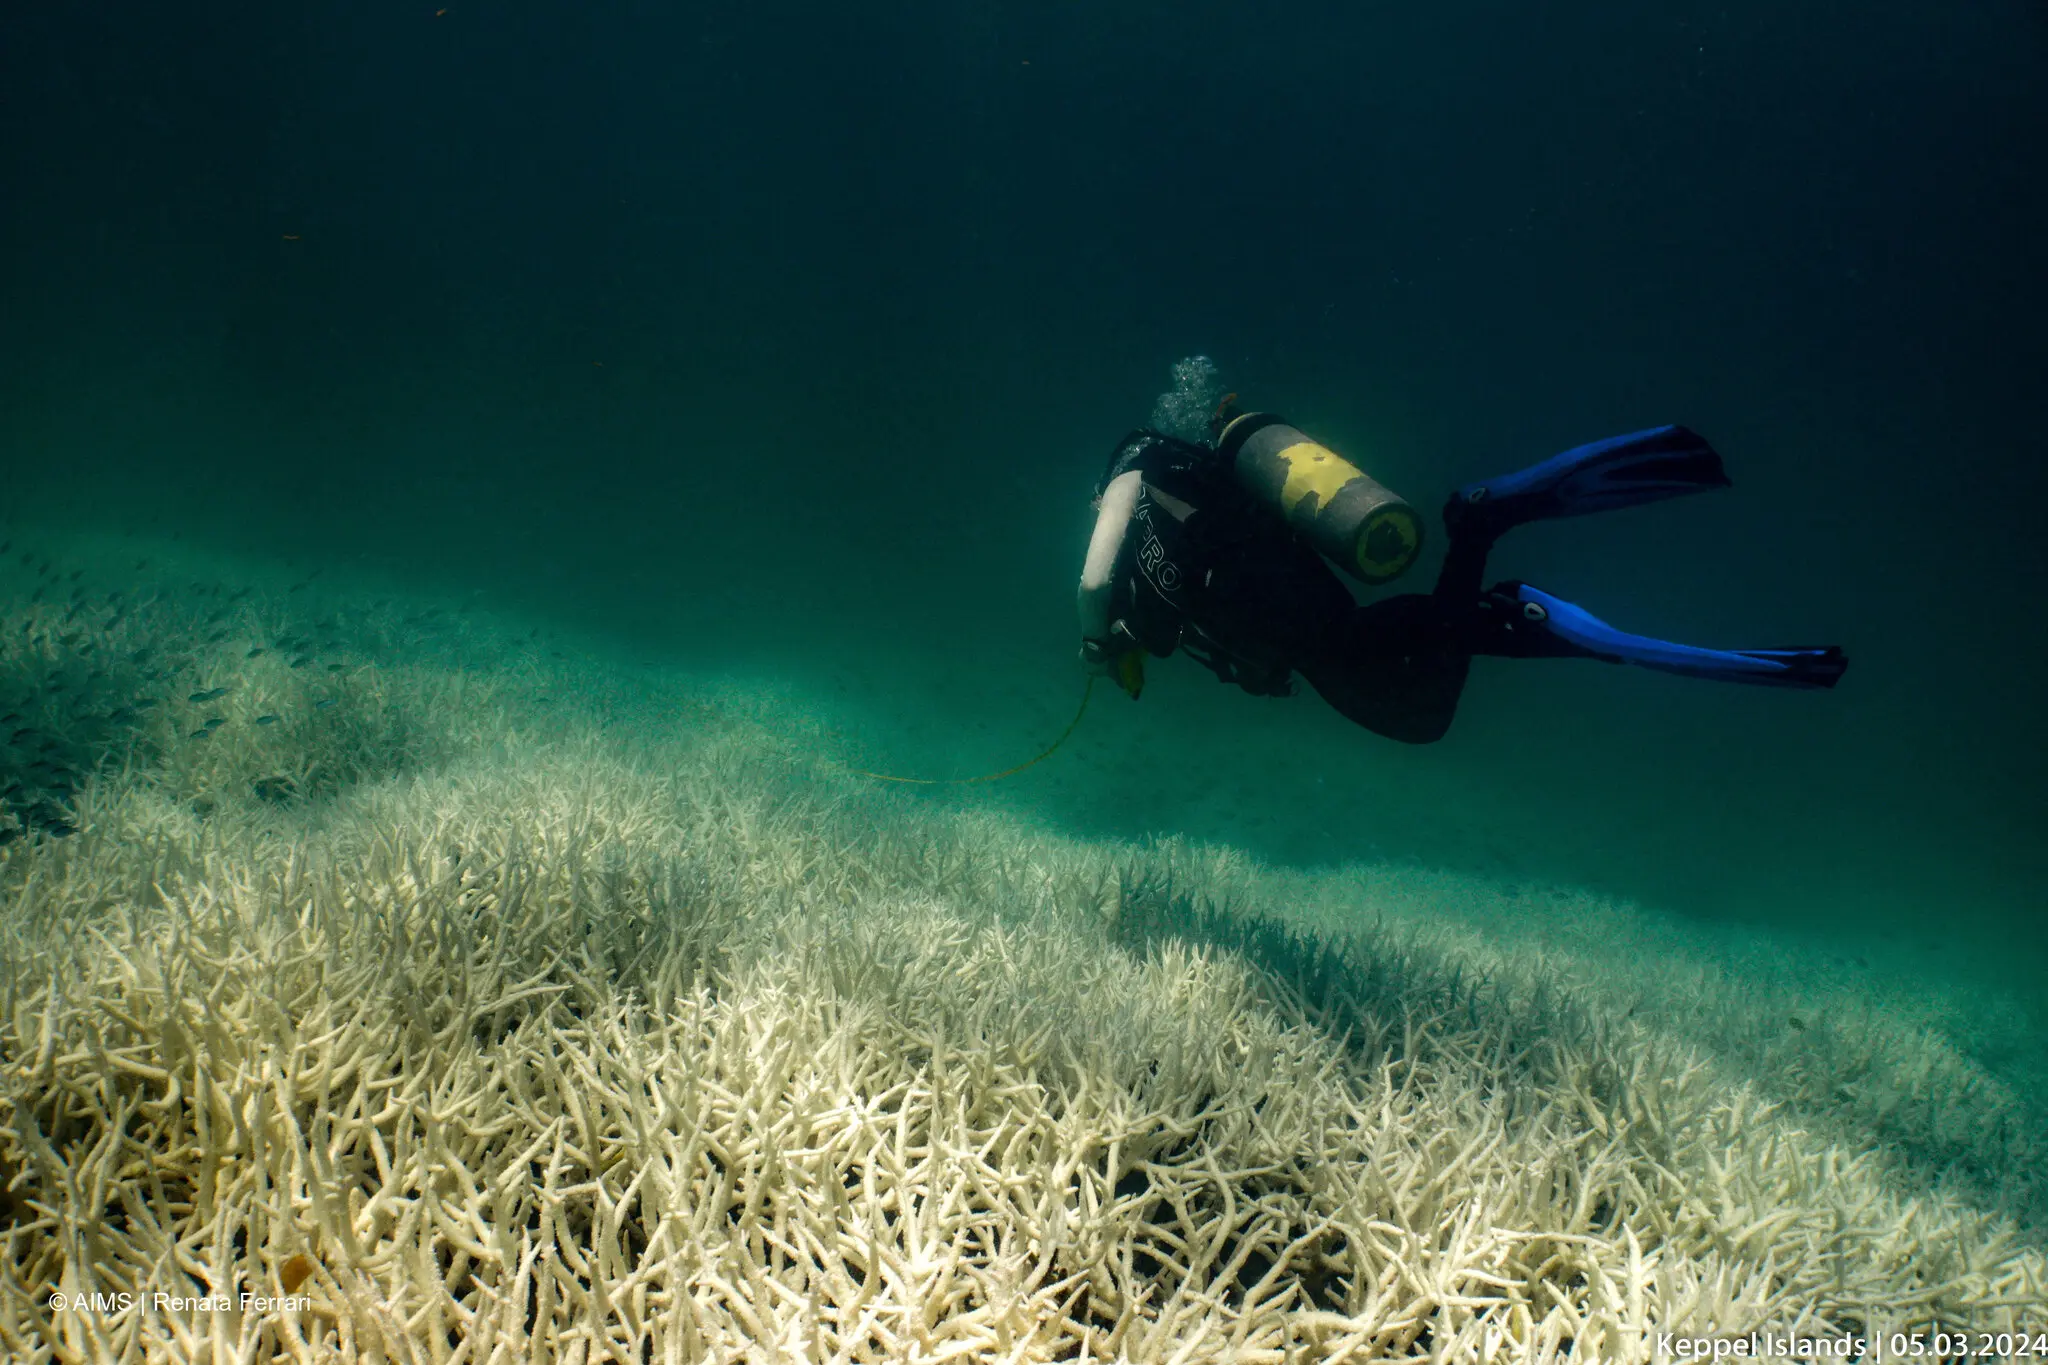
By Catrin Einhorn 15 April 2024 (The New York Times) – The world’s coral reefs are in the throes of a global bleaching event caused by extraordinary ocean temperatures, the National Oceanic and Atmospheric Administration and international partners announced Monday. It is the fourth such global event on record and is expected to affect more […]
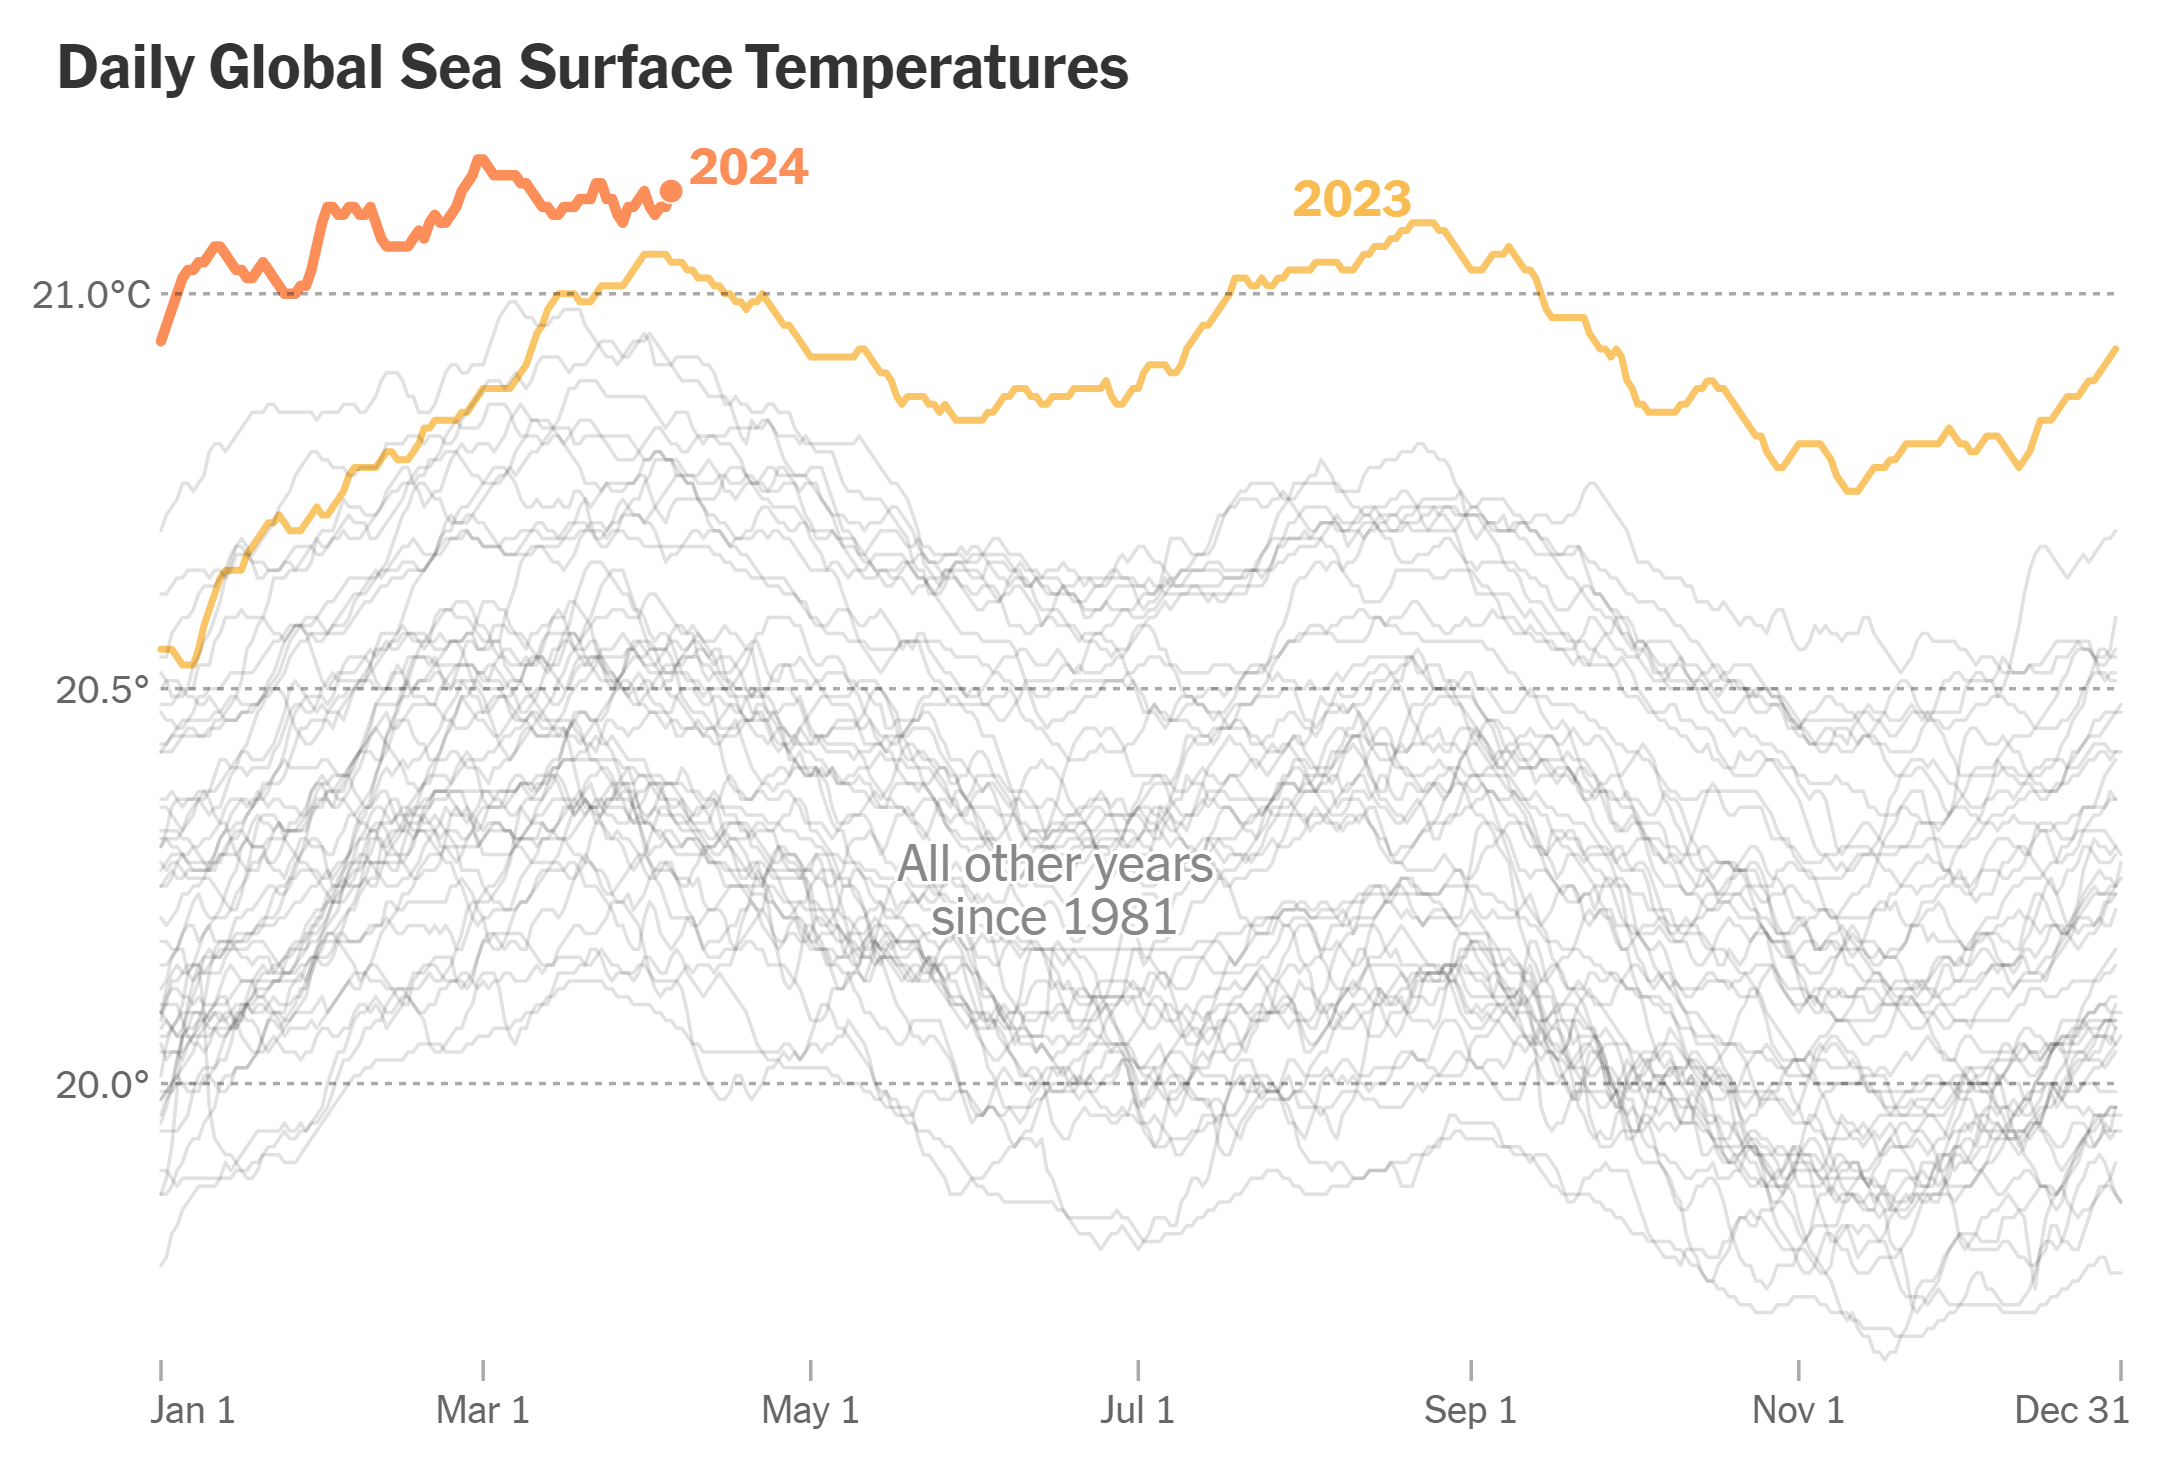
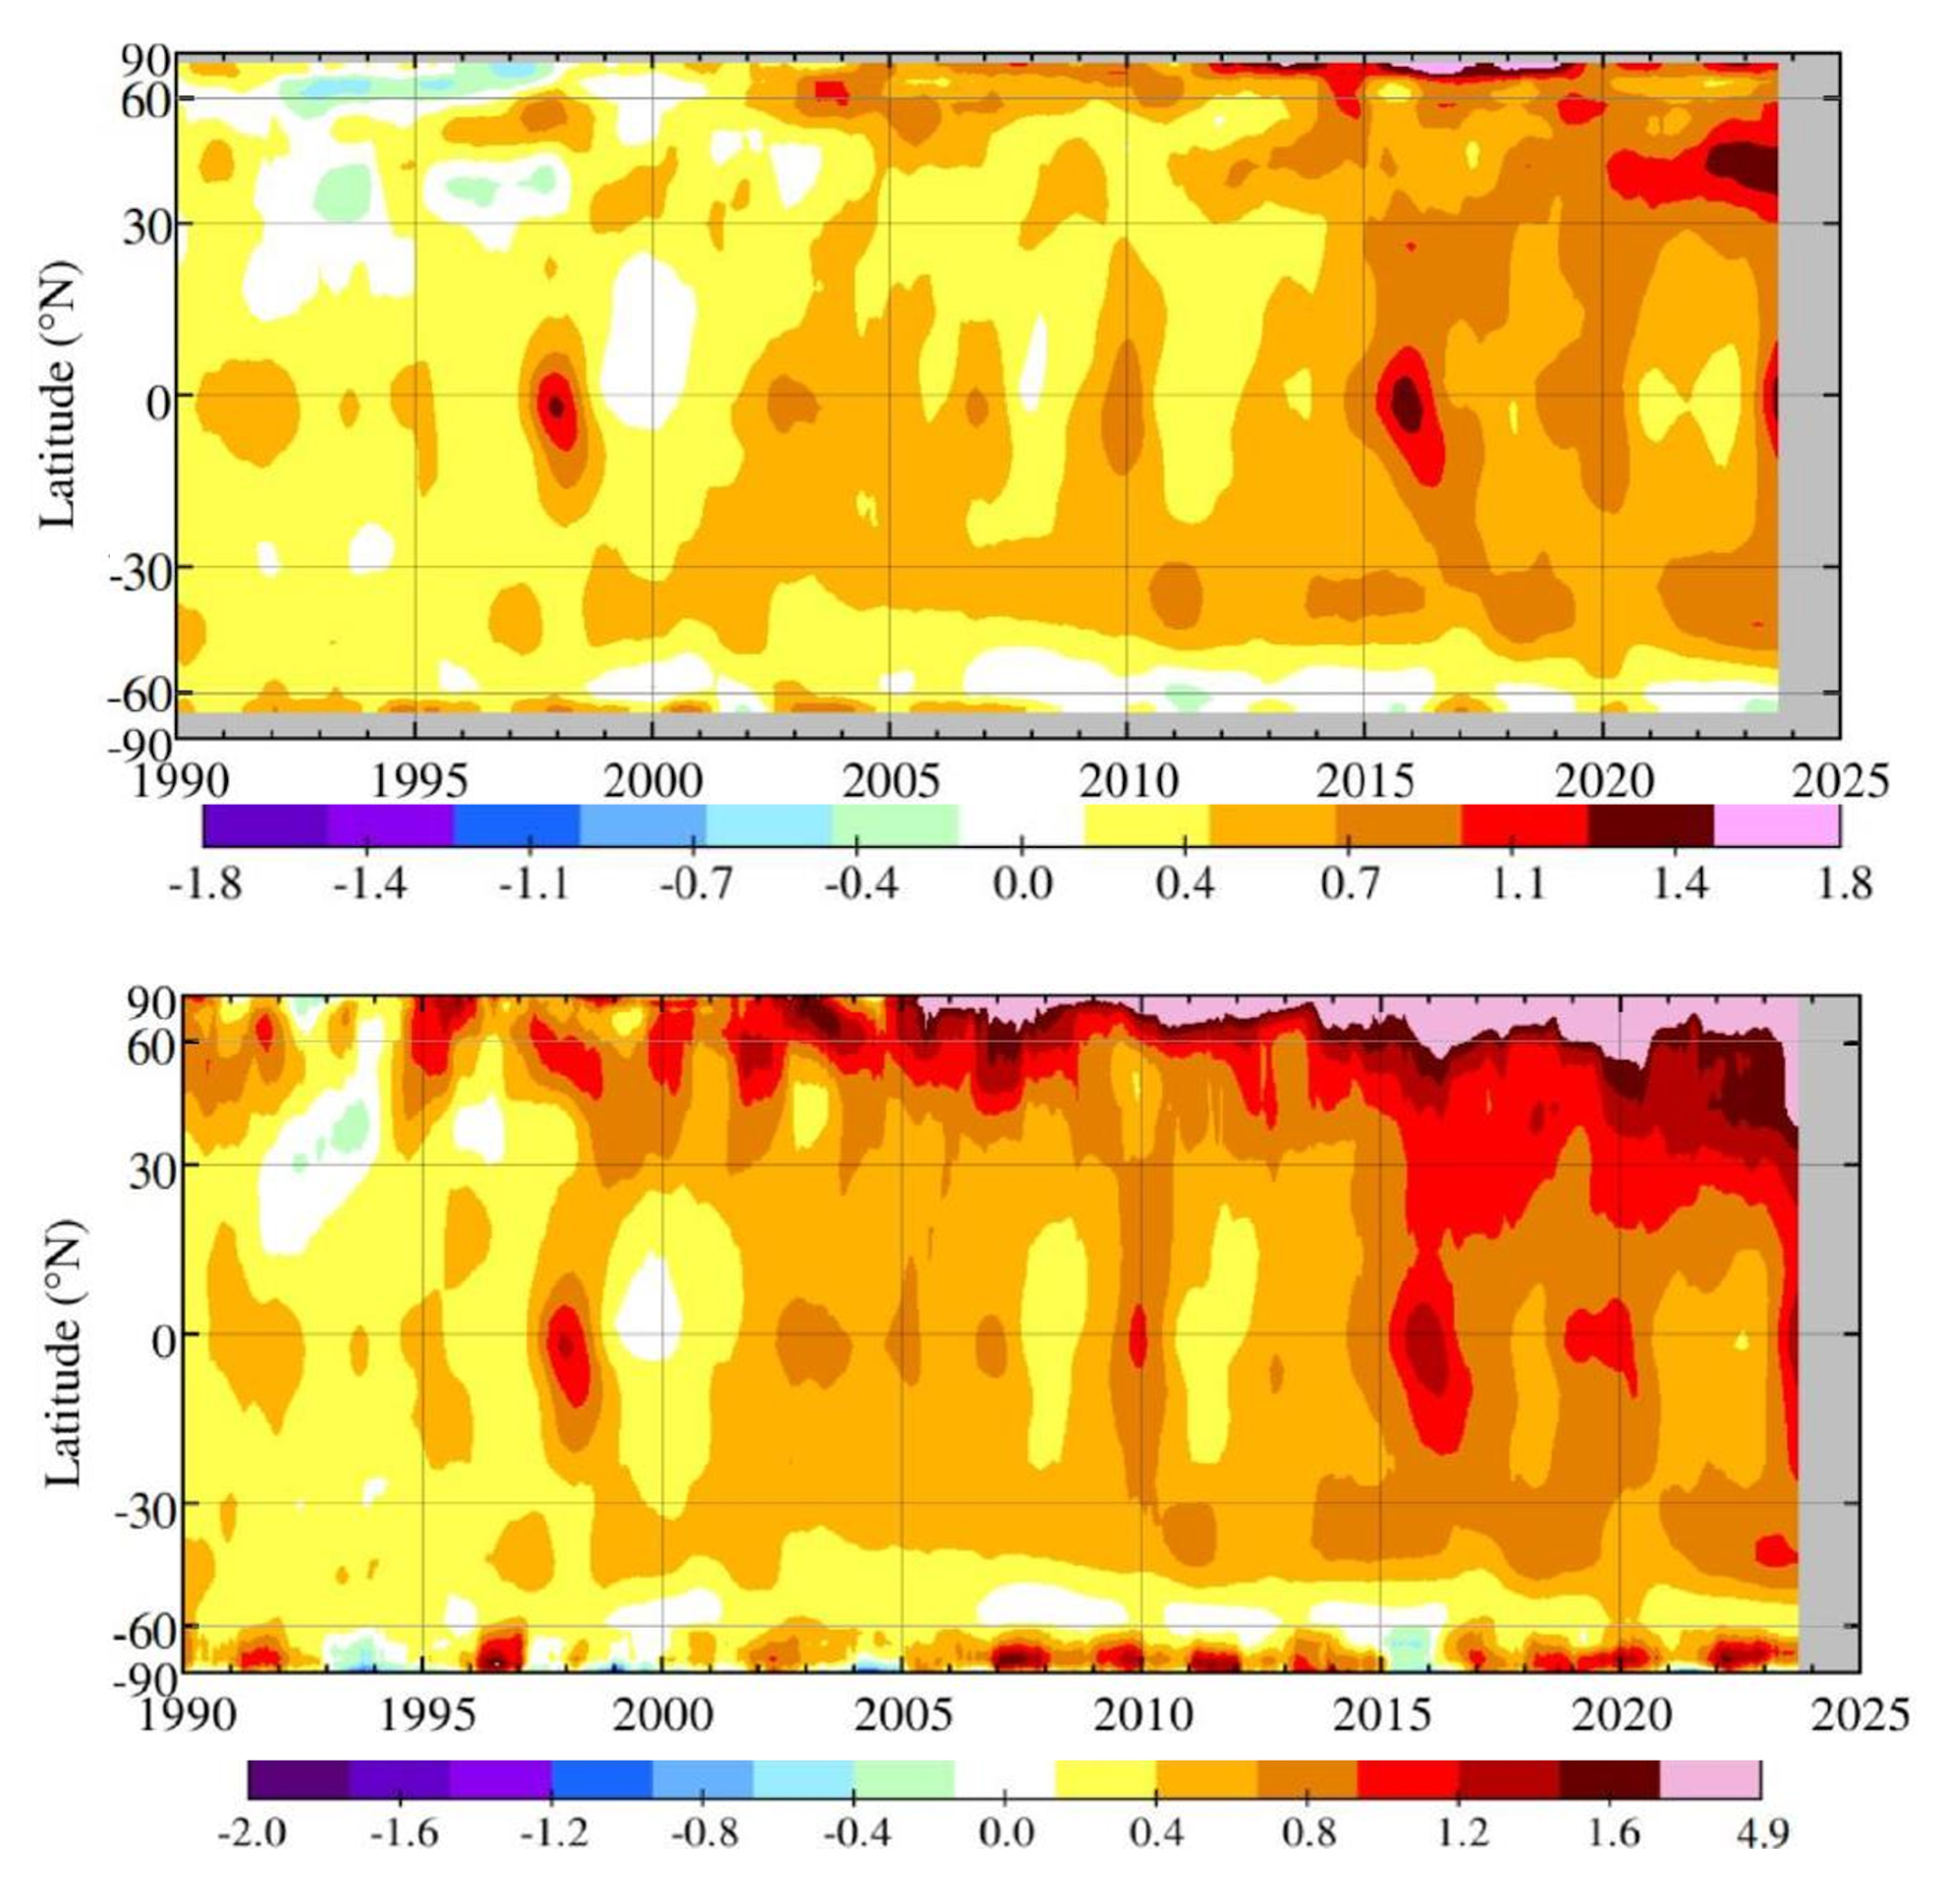
By Delger Erdenesanaa 10 April 2024 (The New York Times) – The ocean has now broken temperature records every day for more than a year. And so far, 2024 has continued 2023’s trend of beating previous records by wide margins. In fact, the whole planet has been hot for months, according to many different data […]
By James Hansen, Makiko Sato, and Pushker Kharecha 29 March 2024 (Columbia University) – Accumulating evidence supports the interpretation in our Pipeline paper: decreasing human-made aerosols increased Earth’s energy imbalance and accelerated global warming in the past decade. Climate sensitivity and aerosol forcing, physically independent quantities, were tied together by United Nations IPCC climate assessments that rely […]
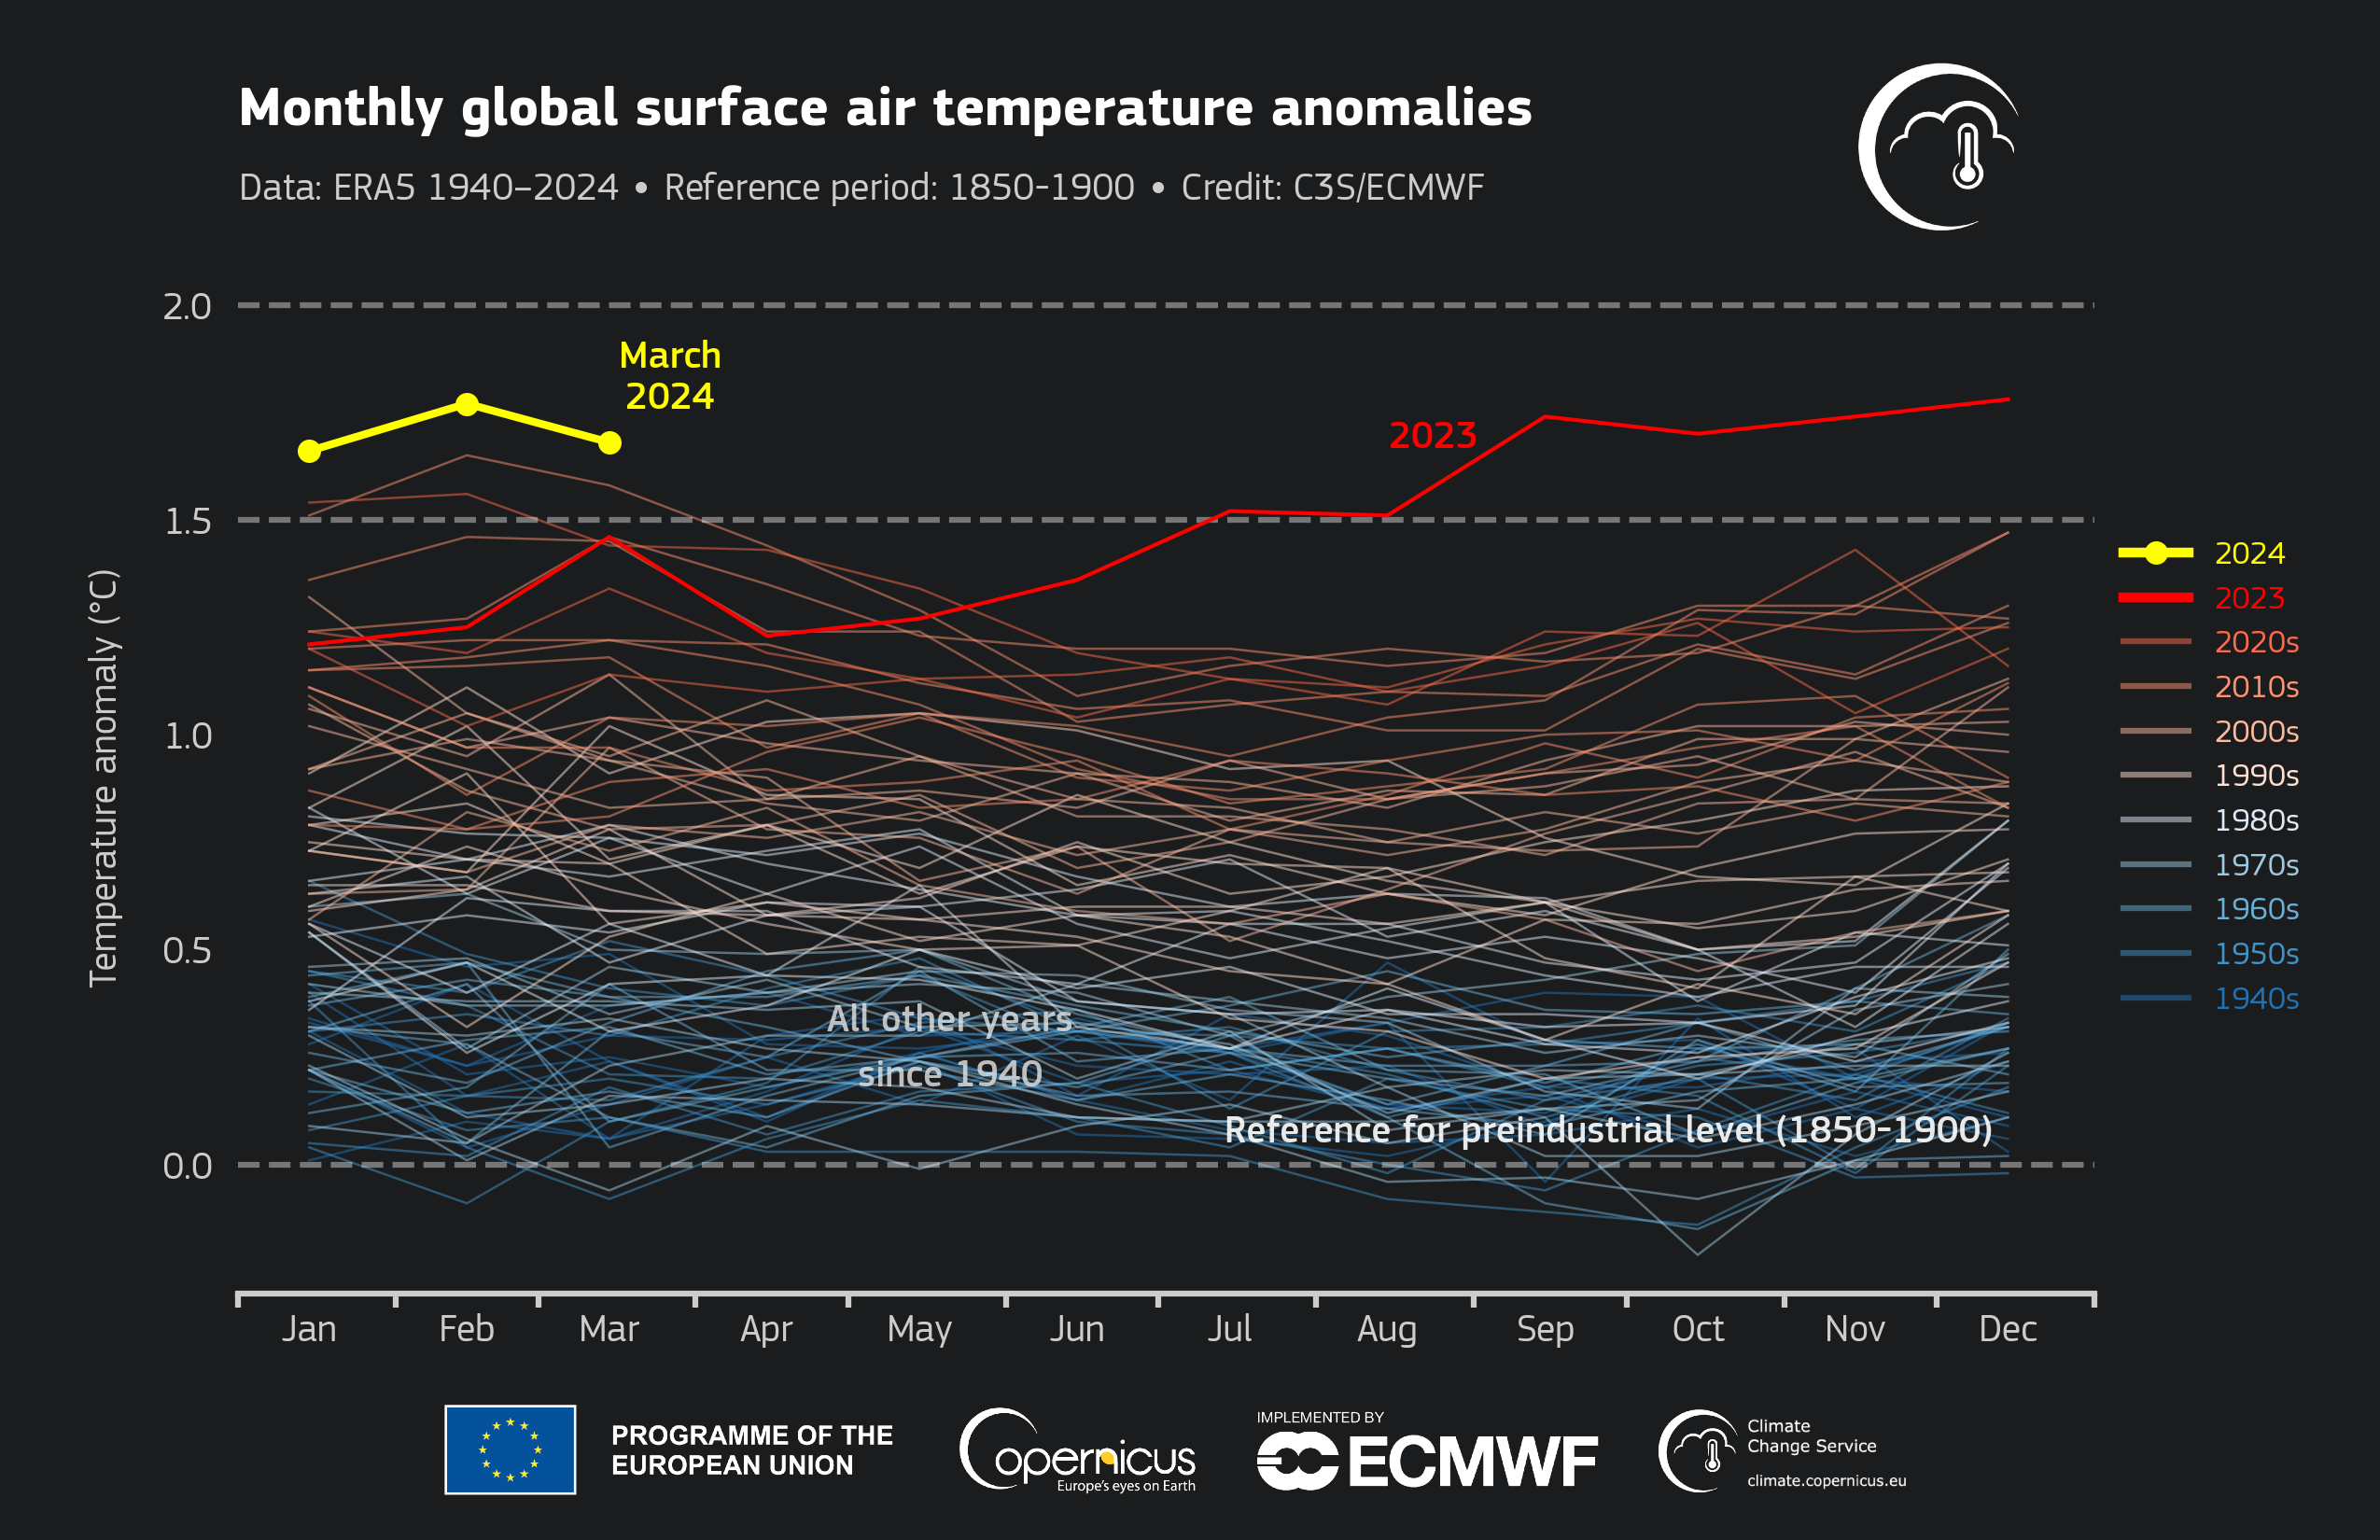
By Jonathan Erdman 12 April 2024 (Weather.com) – March was Earth’s warmest on record, according to data from three separate agencies, the latest month in a stretch of heat records since the planet’s hottest year in 2023. Another month, another record In a report released Friday, NOAA found March’s globally average temperature was 2.43 degrees Fahrenheit above […]
By Zoë Schlanger 10 November 2023 (The Atlantic) – You’d be forgiven for thinking that the fight against climate change is finally going well. The clean-energy revolution is well under way and exceeding expectations. Solar is set to become the cheapest form of energy in most places by 2030, and the remarkable efficiency of heat pumps is driving their own uptake […]
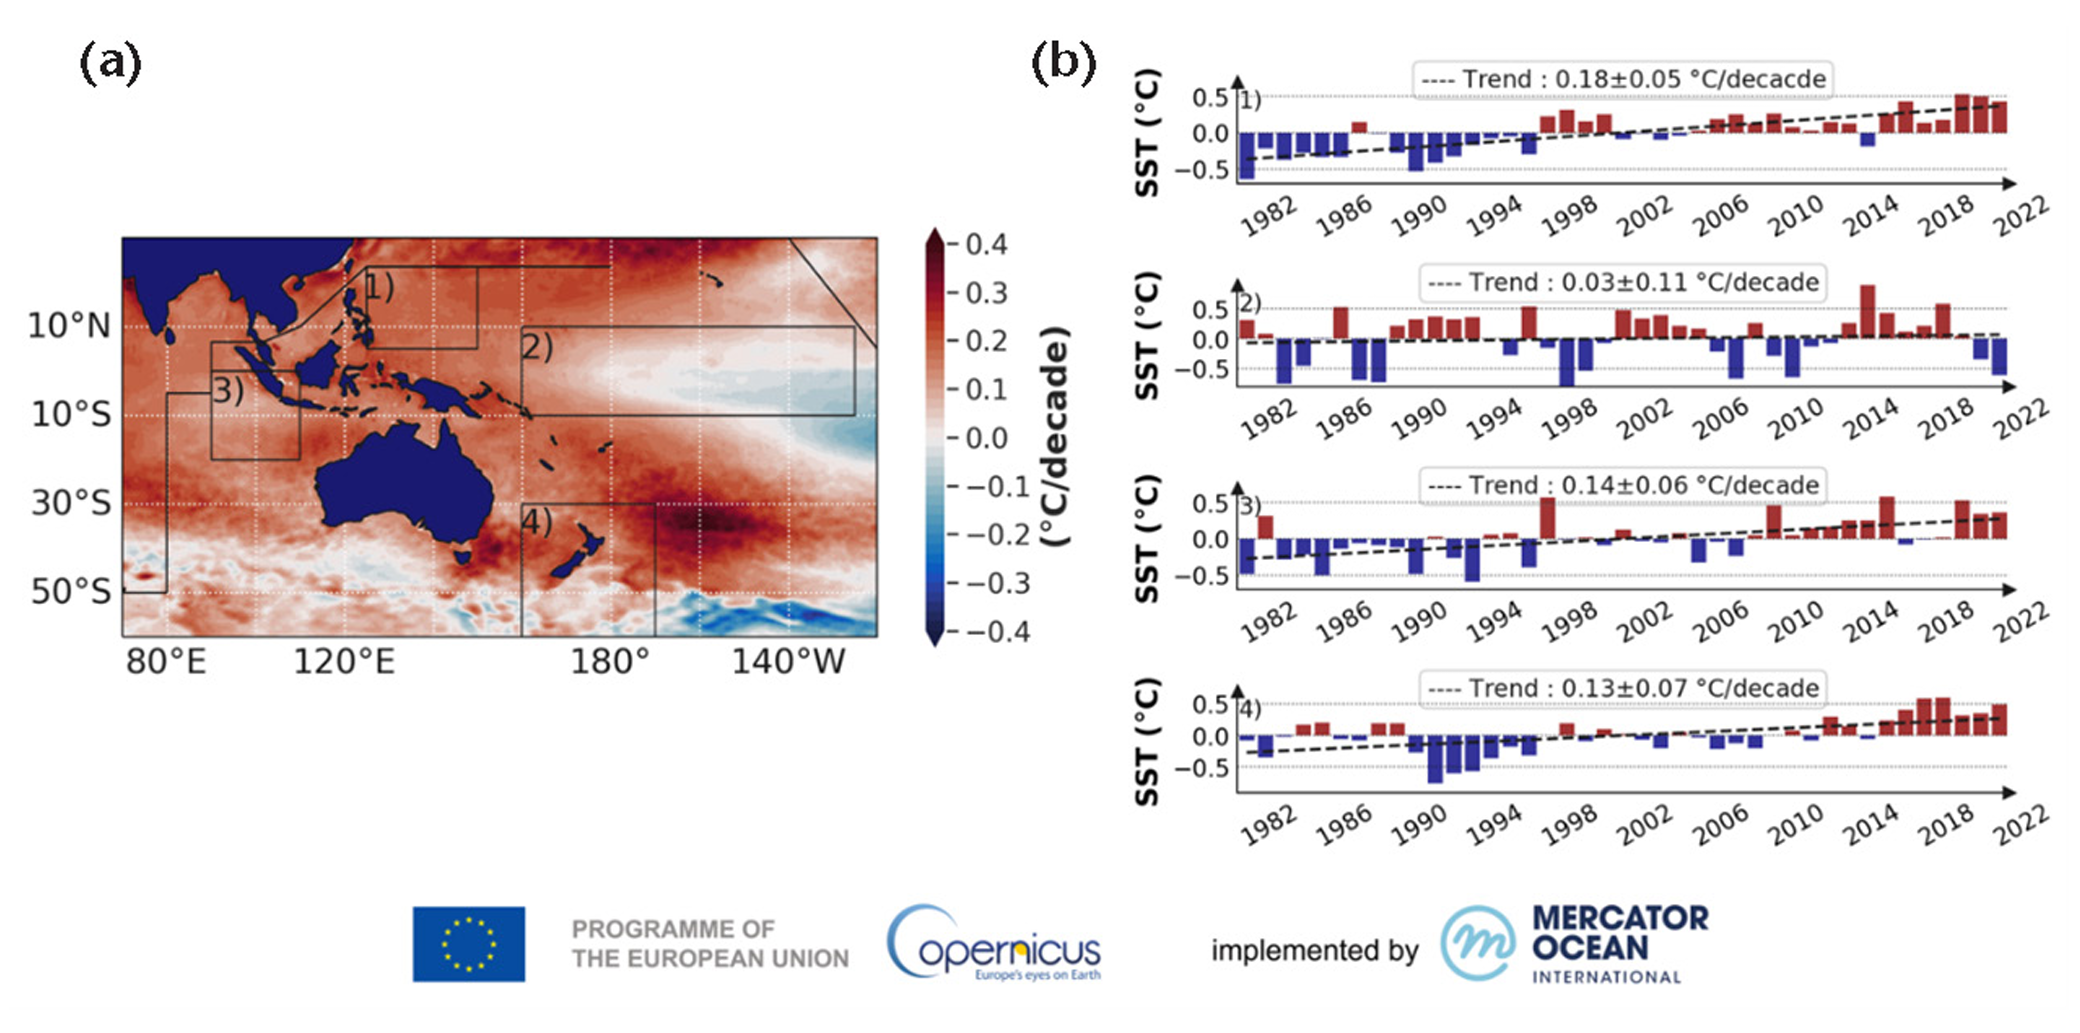
By Gabrielle Tétrault-Farber 17 August 2023 GENEVA (Reuters) – Sea levels in the South-West Pacific are rising faster than the global average, threatening low-lying islands while heat damages marine ecosystems, the U.N. meteorological agency said on Friday. In its State of the Climate in the South-West Pacific 2022 report, the World Meteorological Organization (WMO) said […]
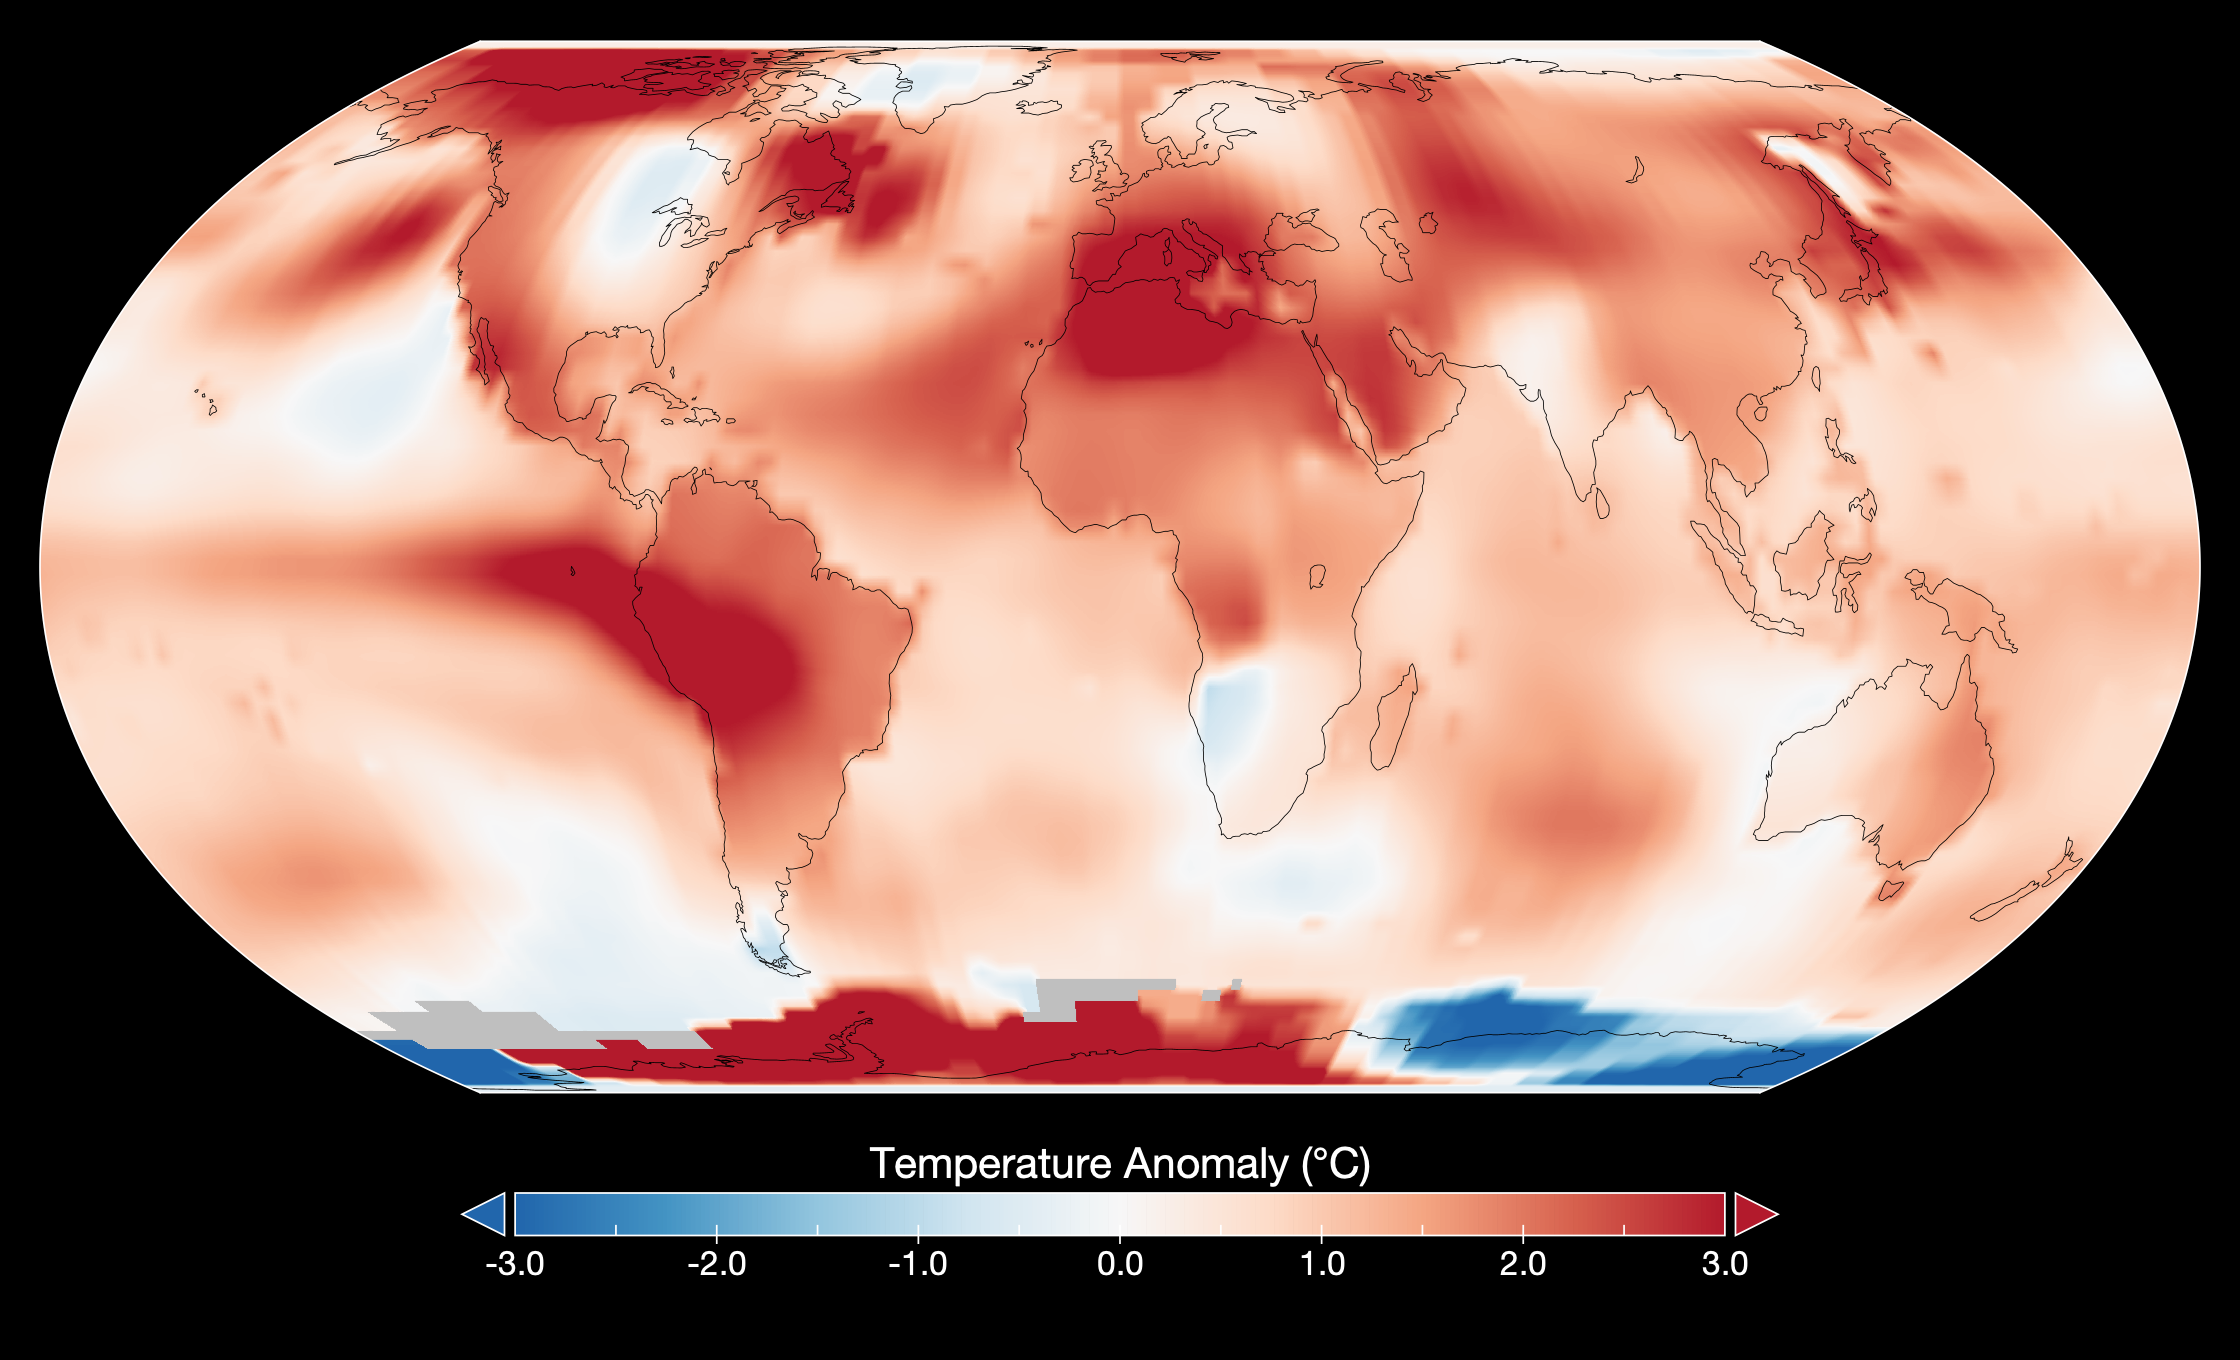
By Sheri Walsh 14 August 2023 (UPI) – July 2023 was the hottest month on record in 143 years, as Americans felt “the effects of the climate crisis,” scientists at NASA’s Goddard Institute for Space Studies in New York announced Monday. According to NASA, July 2023 was on average 0.43 degrees Fahrenheit warmer than any […]