The ocean’s color is changing as a consequence of global warming – Color changes reflect significant shifts in essential marine ecosystems – “To actually see it happening for real is not surprising, but frightening”
By Jennifer Chu
12 July 2023
(MIT News Office) – The ocean’s color has changed significantly over the last 20 years, and the global trend is likely a consequence of human-induced climate change, report scientists at MIT, the National Oceanography Center in the U.K., and elsewhere.
In a study appearing today in Nature, the team writes that they have detected changes in ocean color over the past two decades that cannot be explained by natural, year-to-year variability alone. These color shifts, though subtle to the human eye, have occurred over 56 percent of the world’s oceans — an expanse that is larger than the total land area on Earth.
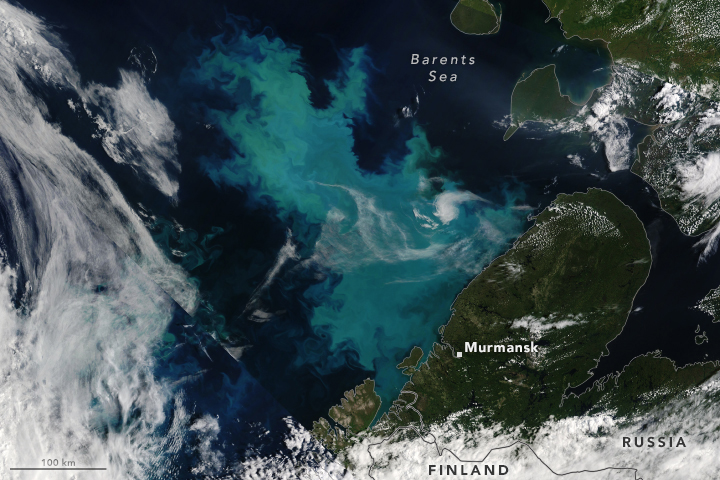
In particular, the researchers found that tropical ocean regions near the equator have become steadily greener over time. The shift in ocean color indicates that ecosystems within the surface ocean must also be changing, as the color of the ocean is a literal reflection of the organisms and materials in its waters.
At this point, the researchers cannot say how exactly marine ecosystems are changing to reflect the shifting color. But they are pretty sure of one thing: Human-induced climate change is likely the driver.
“I’ve been running simulations that have been telling me for years that these changes in ocean color are going to happen,” says study co-author Stephanie Dutkiewicz, senior research scientist in MIT’s Department of Earth, Atmospheric and Planetary Sciences and the Center for Global Change Science. “To actually see it happening for real is not surprising, but frightening. And these changes are consistent with man-induced changes to our climate.”
“This gives additional evidence of how human activities are affecting life on Earth over a huge spatial extent,” adds lead author B. B. Cael PhD ’19 of the National Oceanography Center in Southampton, U.K. “It’s another way that humans are affecting the biosphere.”
The study’s co-authors also include Stephanie Henson of the National Oceanography Center, Kelsey Bisson at Oregon State University, and Emmanuel Boss of the University of Maine.
The color of the oceans has changed. And we can’t say how. But we can say that changes in color reflect changes in plankton communities, that will impact everything that feeds on plankton. It will also change how much the ocean will take up carbon, because different types of plankton have different abilities to do that. So, we hope people take this seriously. It’s not only models that are predicting these changes will happen. We can now see it happening, and the ocean is changing.
Stephanie Dutkiewicz, senior research scientist in MIT’s Department of Earth, Atmospheric and Planetary Sciences and the Center for Global Change Science
Above the noise
The ocean’s color is a visual product of whatever lies within its upper layers. Generally, waters that are deep blue reflect very little life, whereas greener waters indicate the presence of ecosystems, and mainly phytoplankton — plant-like microbes that are abundant in upper ocean and that contain the green pigment chlorophyll. The pigment helps plankton harvest sunlight, which they use to capture carbon dioxide from the atmosphere and convert it into sugars.
Phytoplankton are the foundation of the marine food web that sustains progressively more complex organisms, on up to krill, fish, and seabirds and marine mammals. Phytoplankton are also a powerful muscle in the ocean’s ability to capture and store carbon dioxide. Scientists are therefore keen to monitor phytoplankton across the surface oceans and to see how these essential communities might respond to climate change. To do so, scientists have tracked changes in chlorophyll, based on the ratio of how much blue versus green light is reflected from the ocean surface, which can be monitored from space
But around a decade ago, Henson, who is a co-author of the current study, published a paper with others, which showed that, if scientists were tracking chlorophyll alone, it would take at least 30 years of continuous monitoring to detect any trend that was driven specifically by climate change. The reason, the team argued, was that the large, natural variations in chlorophyll from year to year would overwhelm any anthropogenic influence on chlorophyll concentrations. It would therefore take several decades to pick out a meaningful, climate-change-driven signal amid the normal noise.
In 2019, Dutkiewicz and her colleagues published a separate paper, showing through a new model that the natural variation in other ocean colors is much smaller compared to that of chlorophyll. Therefore, any signal of climate-change-driven changes should be easier to detect over the smaller, normal variations of other ocean colors. They predicted that such changes should be apparent within 20, rather than 30 years of monitoring.
“So I thought, doesn’t it make sense to look for a trend in all these other colors, rather than in chlorophyll alone?” Cael says. “It’s worth looking at the whole spectrum, rather than just trying to estimate one number from bits of the spectrum.”
The power of seven
In the current study, Cael and the team analyzed measurements of ocean color taken by the Moderate Resolution Imaging Spectroradiometer (MODIS) aboard the Aqua satellite, which has been monitoring ocean color for 21 years. MODIS takes measurements in seven visible wavelengths, including the two colors researchers traditionally use to estimate chlorophyll.
The differences in color that the satellite picks up are too subtle for human eyes to differentiate. Much of the ocean appears blue to our eye, whereas the true color may contain a mix of subtler wavelengths, from blue to green and even red.
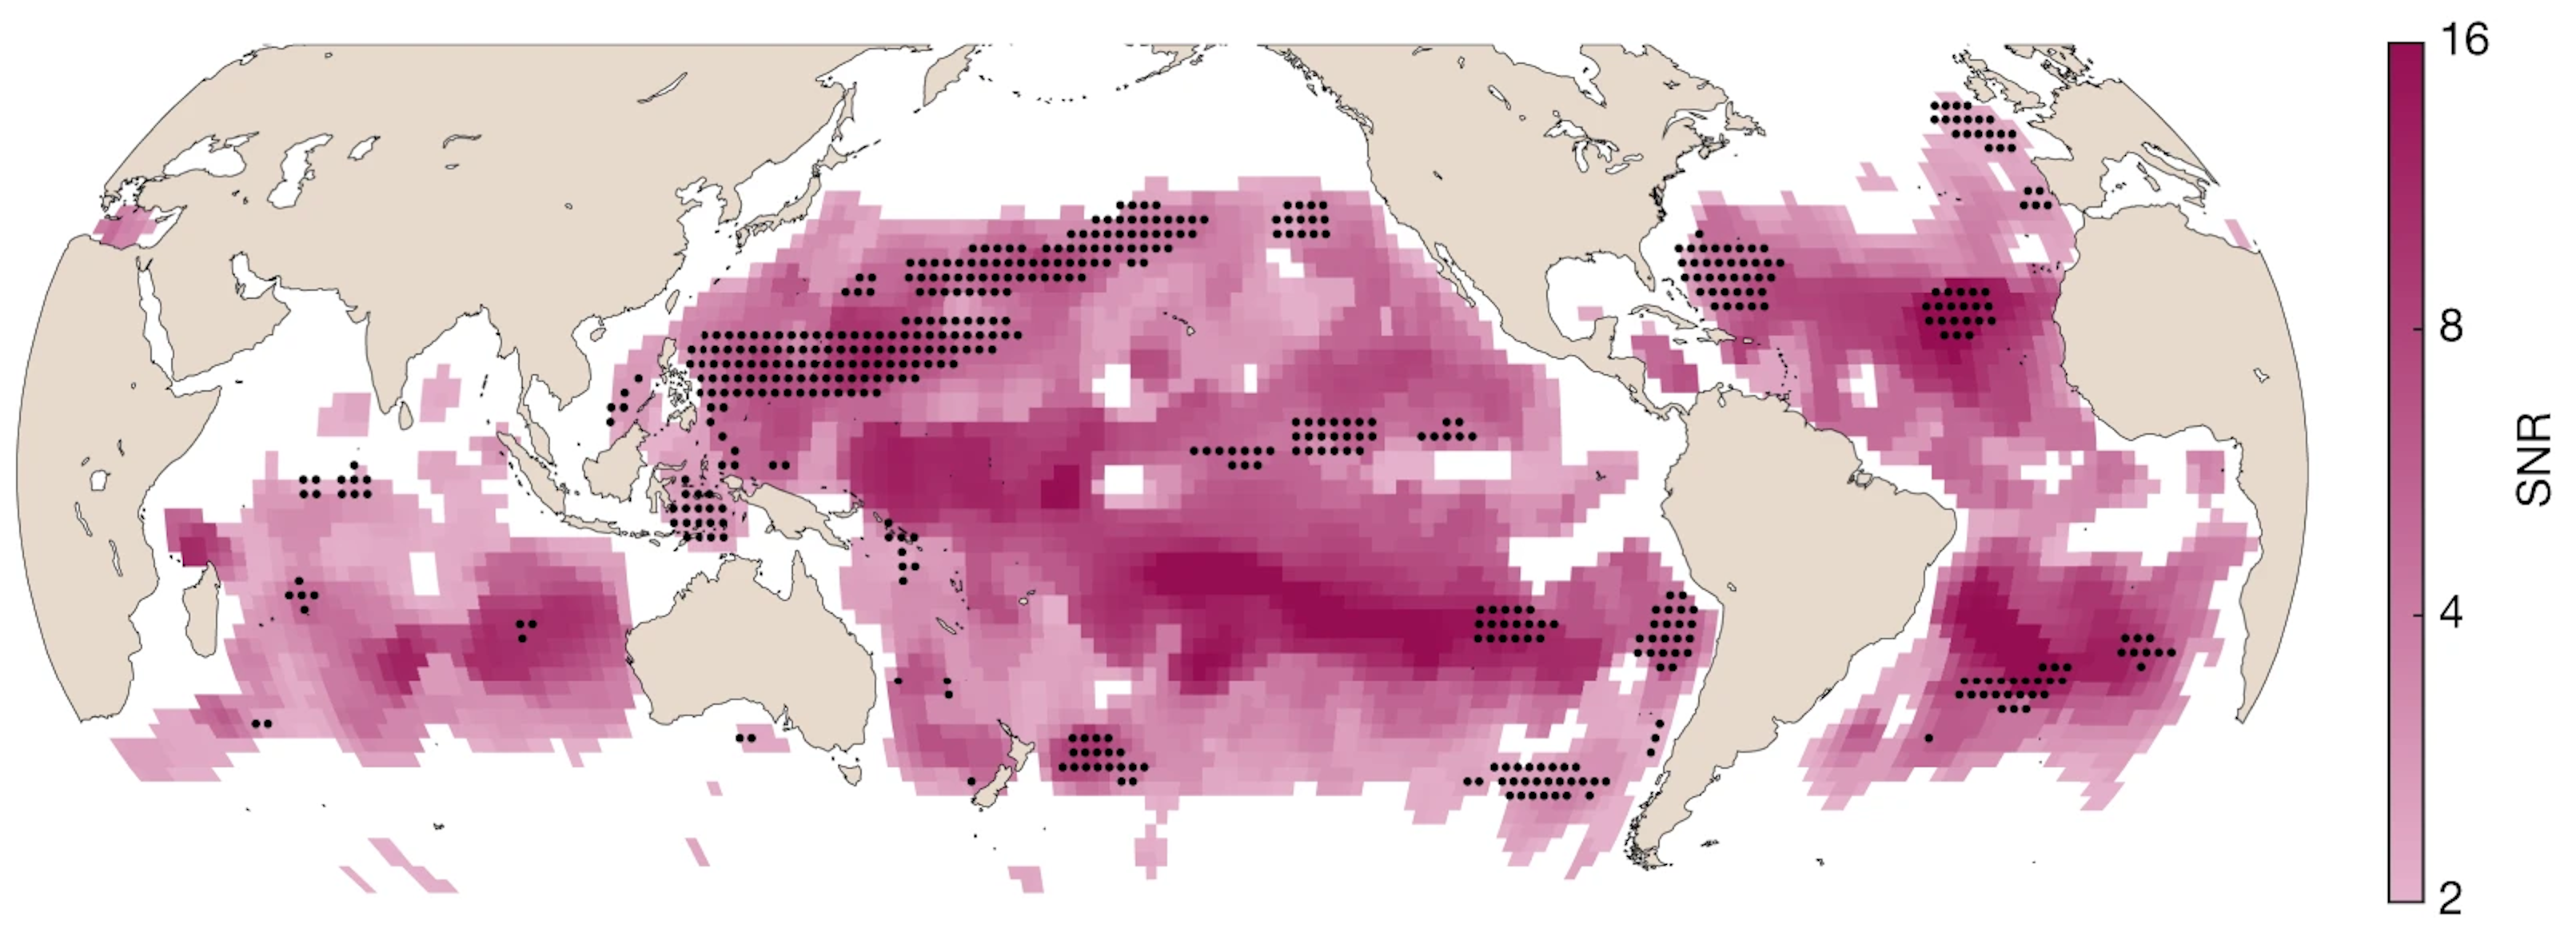
Cael carried out a statistical analysis using all seven ocean colors measured by the satellite from 2002 to 2022 together. He first looked at how much the seven colors changed from region to region during a given year, which gave him an idea of their natural variations. He then zoomed out to see how these annual variations in ocean color changed over a longer stretch of two decades. This analysis turned up a clear trend, above the normal year-to-year variability.
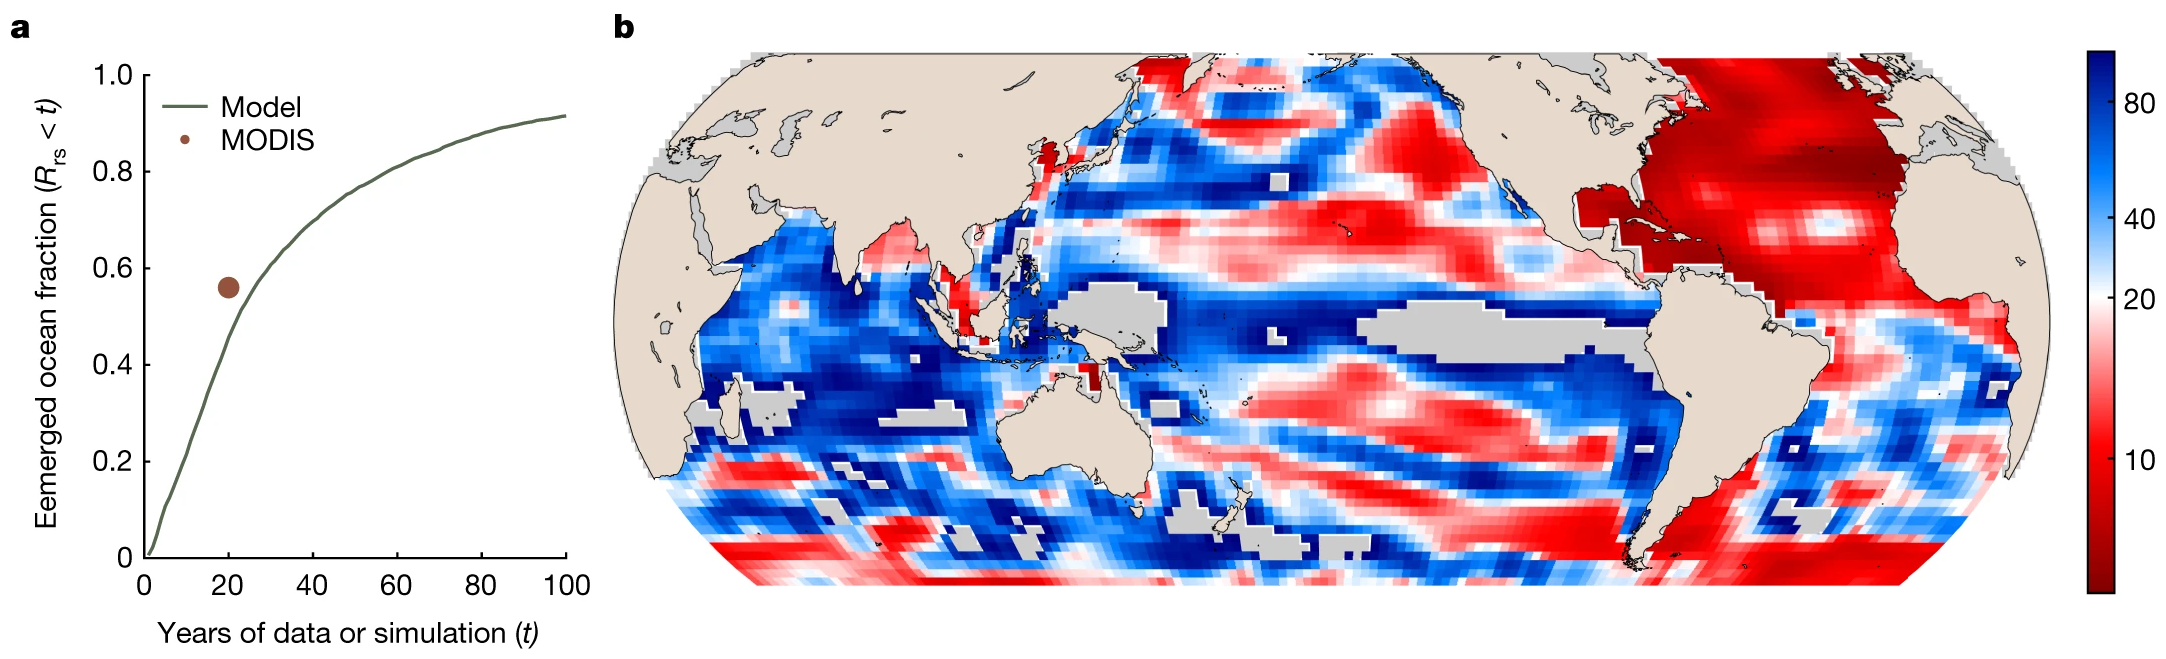
To see whether this trend is related to climate change, he then looked to Dutkiewicz’s model from 2019. This model simulated the Earth’s oceans under two scenarios: one with the addition of greenhouse gases, and the other without it. The greenhouse-gas model predicted that a significant trend should show up within 20 years and that this trend should cause changes to ocean color in about 50 percent of the world’s surface oceans — almost exactly what Cael found in his analysis of real-world satellite data.
“This suggests that the trends we observe are not a random variation in the Earth system,” Cael says. “This is consistent with anthropogenic climate change.”
The team’s results show that monitoring ocean colors beyond chlorophyll could give scientists a clearer, faster way to detect climate-change-driven changes to marine ecosystems.
“The color of the oceans has changed,” Dutkiewicz says. “And we can’t say how. But we can say that changes in color reflect changes in plankton communities, that will impact everything that feeds on plankton. It will also change how much the ocean will take up carbon, because different types of plankton have different abilities to do that. So, we hope people take this seriously. It’s not only models that are predicting these changes will happen. We can now see it happening, and the ocean is changing.”
This research was supported, in part, by NASA.
Study: The ocean’s color is changing as a consequence of climate change
Global climate-change trends detected in indicators of ocean ecology
ABSTRACT: Strong natural variability has been thought to mask possible climate-change-driven trends in phytoplankton populations from Earth-observing satellites. More than 30 years of continuous data were thought to be needed to detect a trend driven by climate change1. Here we show that climate-change trends emerge more rapidly in ocean colour (remote-sensing reflectance, Rrs), because Rrs is multivariate and some wavebands have low interannual variability. We analyse a 20-year Rrs time series from the Moderate Resolution Imaging Spectroradiometer (MODIS) aboard the Aqua satellite and find significant trends in Rrs for 56% of the global surface ocean, mainly equatorward of 40°. The climate-change signal in Rrs emerges after 20 years in similar regions covering a similar fraction of the ocean in a state-of-the-art ecosystem model2, which suggests that our observed trends indicate shifts in ocean colour—and, by extension, in surface-ocean ecosystems—that are driven by climate change. On the whole, low-latitude oceans have become greener in the past 20 years.
Global climate-change trends detected in indicators of ocean ecology