Changes of sea surface temperature (SST) gradient anomalies and the spatial distribution of SST to a changing CO2 pathway. (A) Time evolution of latitudinal gradient of sea surface temperature anomaly (unit: °C) in the SH (pink) from its PD value. (B) Same as (A) but for the NH (black), the North Pacific (NP; 120°E to 90°W, green dotted line), and the North Atlantic (NA; 70°W to 0°E, orange dashed line) sectors with the Atlantic meridional overturning circulation (AMOC) strength anomaly from its PD value (skyblue; unit: Sv). The SST gradient is determined by the SST differences from the tropics (0° to 15°) to the midlatitudes (45° to 60°) in each hemisphere. The AMOC strength is defined by averaging annual-mean Atlantic meridional ocean stream function within the latitudinal band from 35°N to 45°N at a depth of 1000 m. Note that the weakening of AMOC is upwards in the right axis in (B). All values are based on the ensemble mean of 28 members (subjected to an 11-year running mean), with their 1 SD ranges across the ensemble members marked with shading. (C to E) SST changes (unit: °C) for peak (2121–2160) minus early RU (2001–2040) periods, late RD (2241–2280) minus peak periods, and late RD minus early RU periods, respectively. Climatological SST in the PD climate (unit: °C) is contoured in (C) to (E). The hatched regions in (C) to (E) indicate where temperature changes are statistically insignificant at the 95 percent confidence level. The SH, NP, and NA sectors for the SST gradient in (A) and (B) are denoted by colored boxes in (C) to (E). Graphic: Kim, et al., 2023 / Science Advances

By Tereza Pultarova
28 July 2023

(Space.com) – Removing carbon from Earth’s atmosphere may not reverse devastating changes to weather patterns in vulnerable areas, a new study suggests.

In the study, Korean researchers simulated how removing large quantities of the greenhouse gas carbon dioxide from the air might affect the progress of local climate changes related to global warming. The study, based on computer modeling, examined a hypothetical scenario, in which carbon dioxide concentrations continued to rise from present-day levels for 140 years, then were gradually reduced back to the initial levels over another 140-year period.

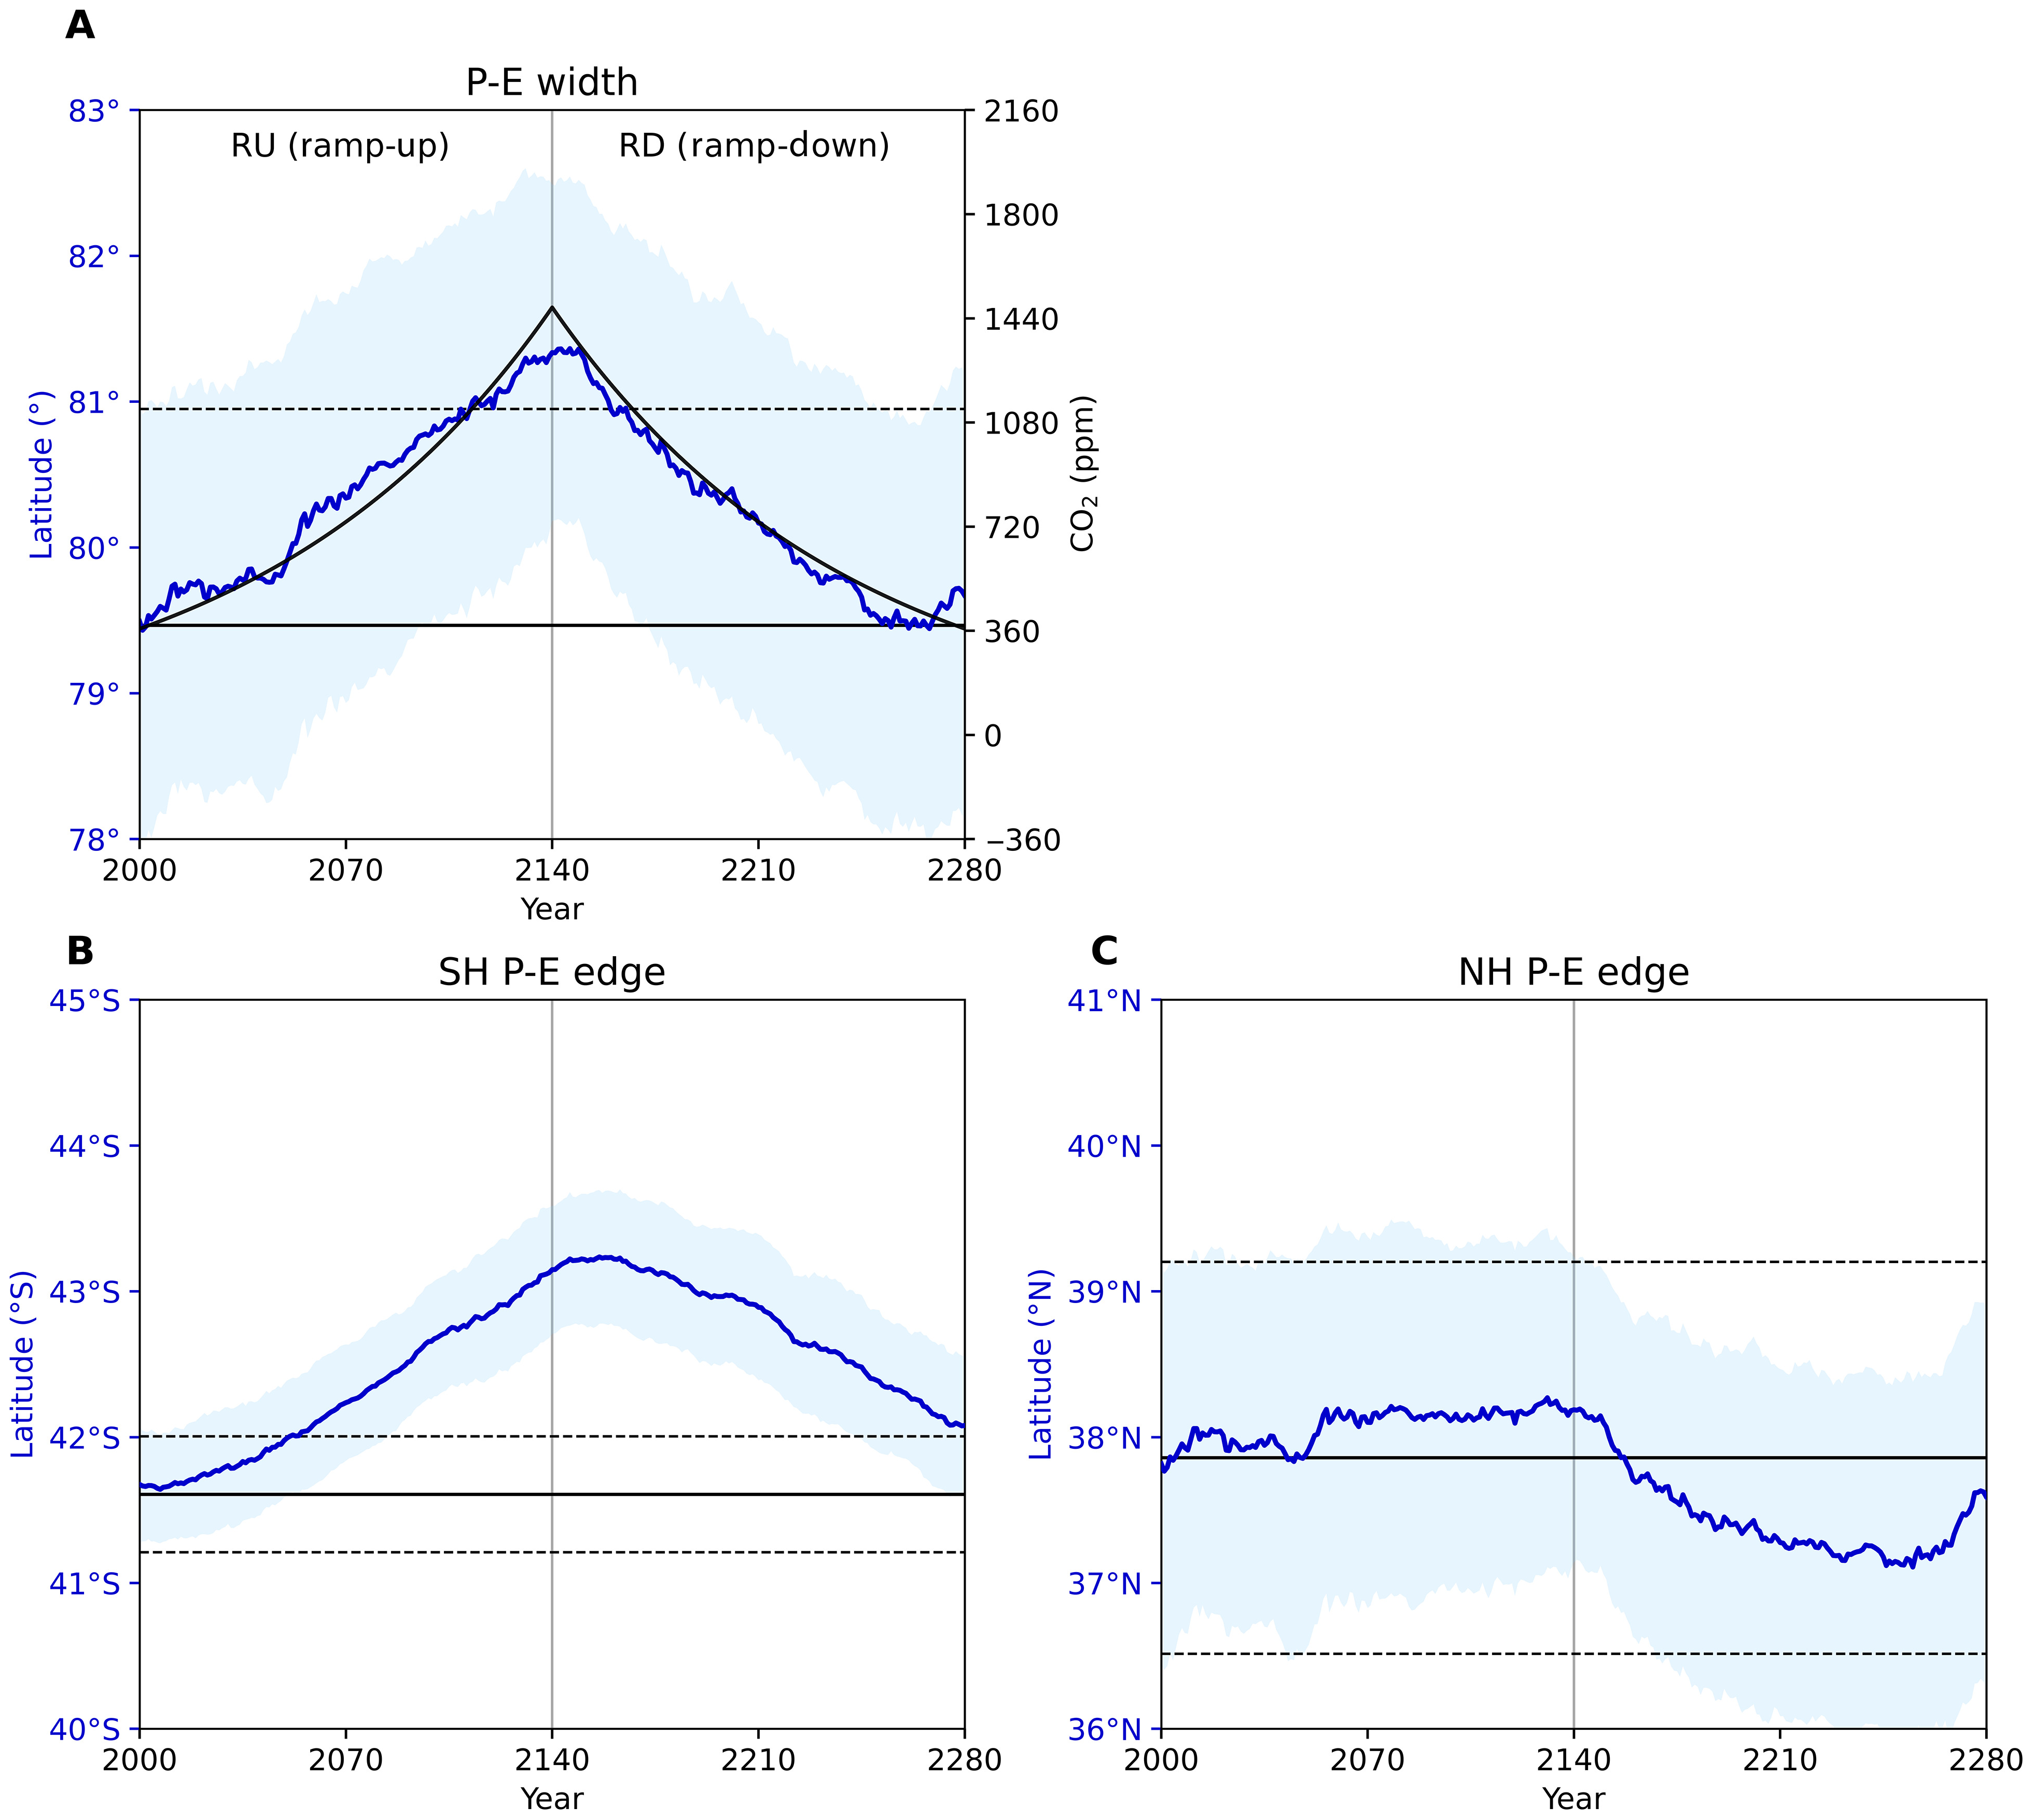
The researchers were particularly interested in how these changes would affect vulnerable subtropical regions, which are known to suffer from more intense and more frequent droughts as climate change progresses.

The study results suggest that the local climate in these areas would not return to normal for more than 200 years after the carbon dioxide concentrations drop. The Mediterranean region, for example, plagued by ever more severe heatwaves, droughts, and wildfires, would continue to suffer and could become even drier, the study found.

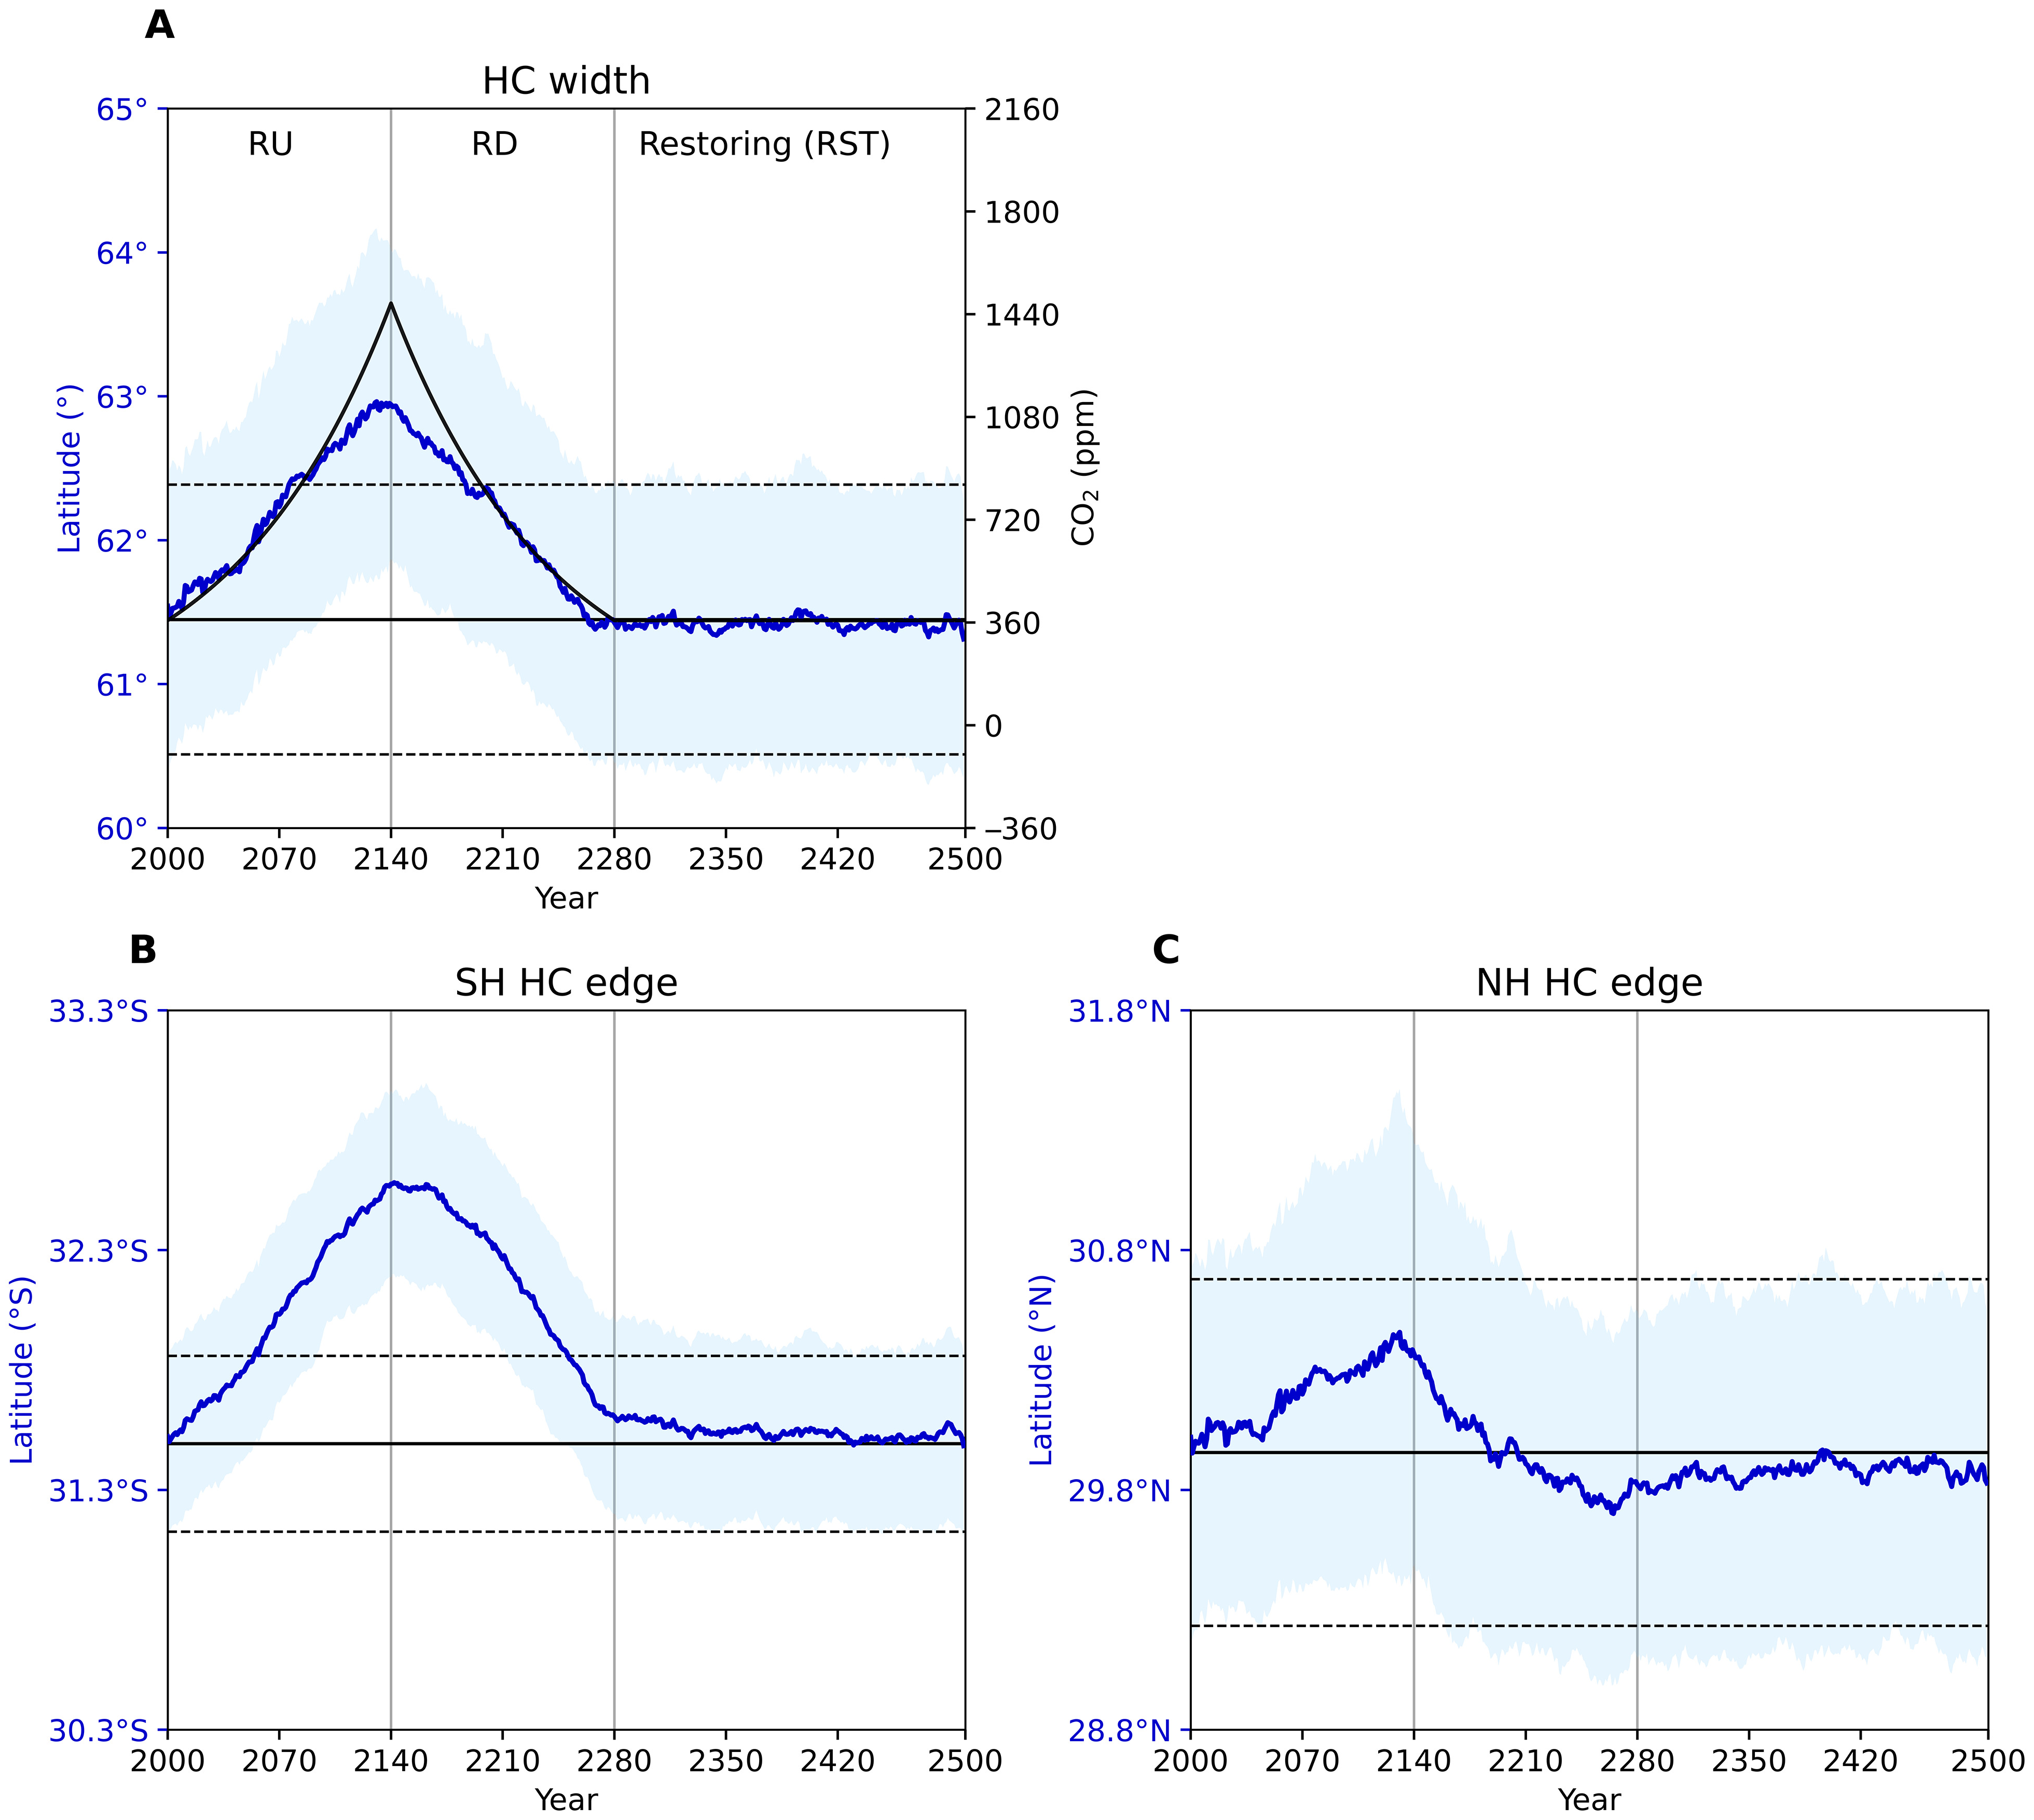
In the study, the researchers modeled the changes to the air circulation pattern called the Hadley Cell, which transports moisture from the equatorial regions toward the tropics of Cancer and Capricorn, which lie at about 23.5 degrees north and south of the equator, respectively. Scientists have known for years that the Hadley Cell circulation responds to climate change by expanding toward the poles. The humid air that rises from around the equator gets dumped back to Earth at higher and higher latitudes, causing worsening droughts in subtropical regions. 

The modeling done by the Korean team found that when carbon dioxide is removed from Earth’s atmosphere, the Hadley Cell doesn’t recover its original shape and extent even after another 220 years. In the Northern Hemisphere, the area where moisture arrives from tropical regions moves closer to the equator, a shift that could make the Mediterranean region drier than it is today. In the Southern Hemisphere, on the other hand, the cell remains slightly expanded toward the South Pole, possibly altering precipitation patterns over Australia. 

Hadley cell (HC) responses to a changing CO2 pathway, 2001-2500. (A) Time evolution of the Hadley cell width (blue line) and CO2 concentrations (black line) from a changing CO2 pathway and after CO2 removal (CDR). (B and C) Same as (A) but for the Southern Hemisphere (SH) and Northern Hemisphere (NH) HC edges, respectively. All values are based on the ensemble mean of 28 members subjected to an 11-year running average. 1 SD is denoted with shading. The means of the HC in the present-day (PD) state and their 1 SD ranges are denoted by horizontal solid and dashed lines, respectively. RU, ramp-up; RD, ramp-down; RST, restoring; ppm, parts per million. Graphic: Kim, et al., 2023 / Science Advances

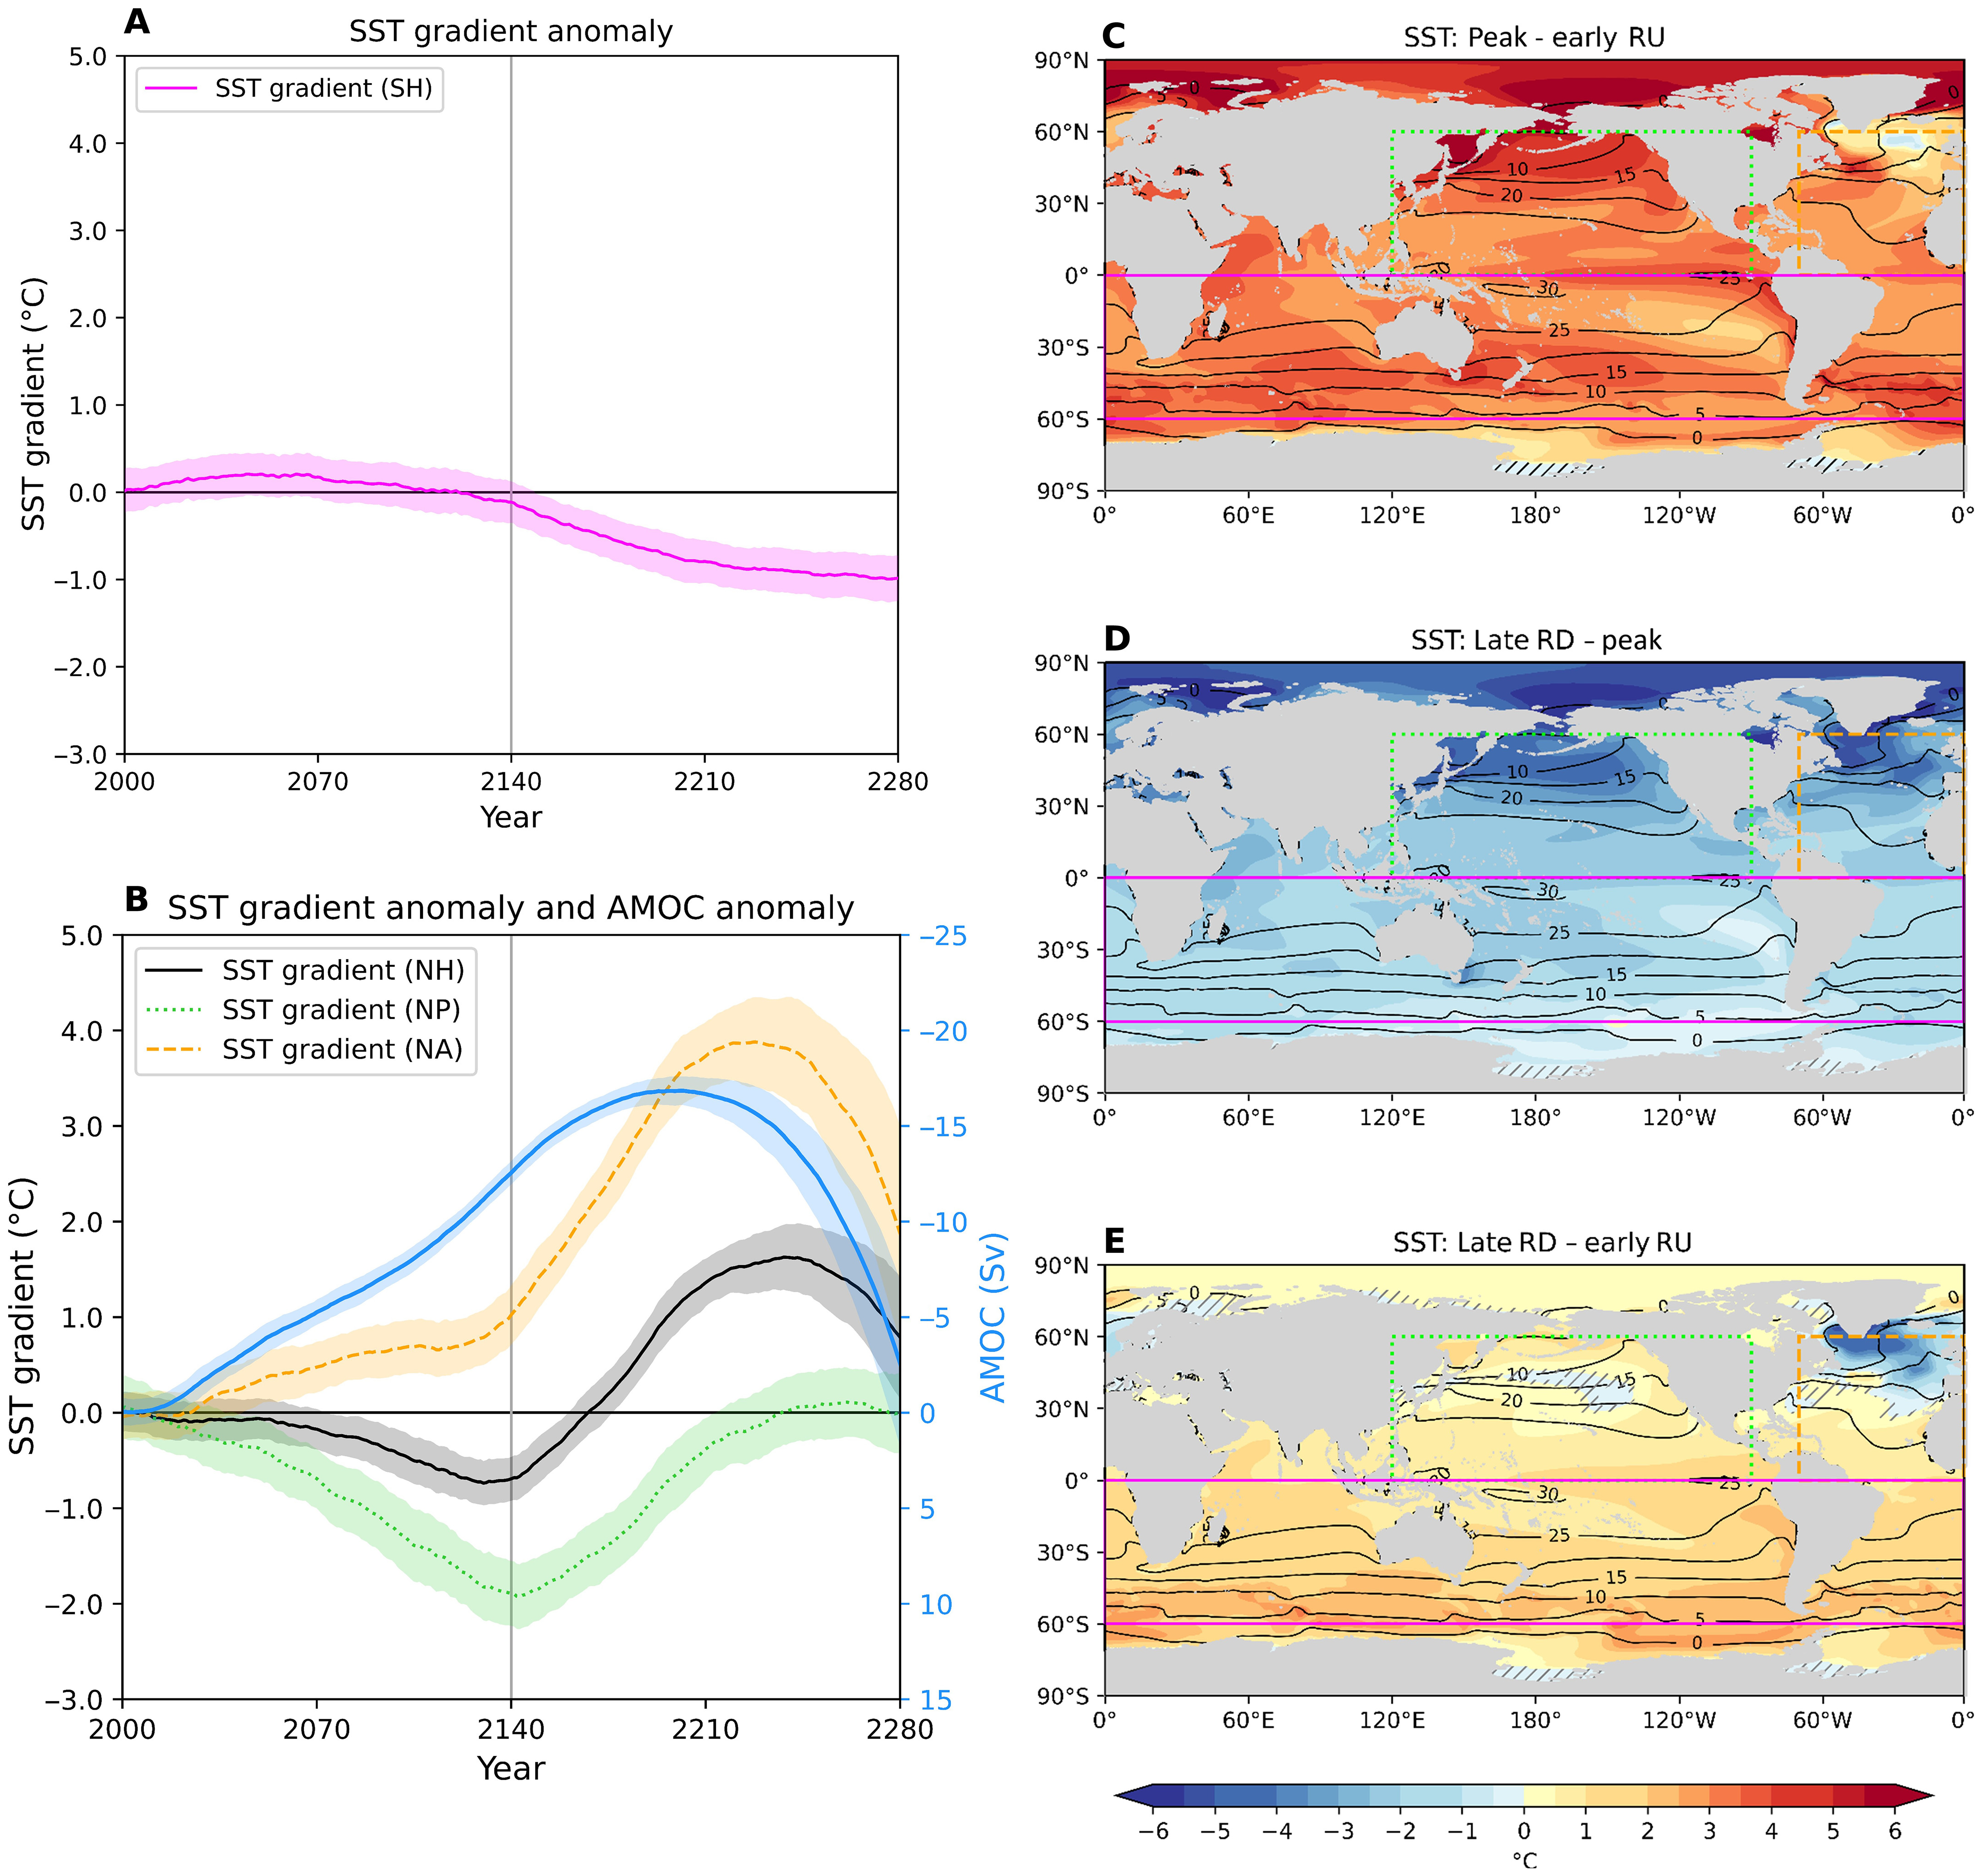
Study lead author Seo-Yeon Kim told Space.com that the unpredictable recovery of the crucial atmospheric circulation pattern has to do with the response of the global ocean to the decrease in temperatures prompted by the carbon dioxide removal.

“One of the main reasons for this asymmetrical response [of the Hadley Cell] is the different response of the northern and southern oceans,” said Kim, a postdoctoral researcher at the Department of Earth and Environmental Science at Seoul National University in South Korea. “It’s related to ocean circulation. The response of the ocean is always slower than the removal of the carbon dioxide, and how fast the ocean responds then determines the recovery of the Hadley Cell.” […]

Kim cautions that the modeling results show that, while carbon removal might reduce temperatures, environmental changes caused by the warming may continue to affect millions of people in vulnerable regions even centuries later. 

“I think that the main message of our study is that we should reduce carbon dioxide emissions now, because afterwards it gets really difficult,” she said. “We cannot control nature, we cannot reverse the consequences that easily; we cannot fix nature.” [more]

Removing carbon from Earth’s atmosphere may not ‘fix’ climate change


Changes of the tropical edges defined by precipitation minus evaporation (P-E) to a changing CO2 pathway. (A) Time evolution of the P-E width (blue), the latitudinal length from SH to NH P-E edges, and CO2 concentrations (black) from a changing CO2 pathway. (B and C) Same as (A) but for P-E edges in the SH (B) and in the NH (C), respectively. All values are based on the ensemble mean of 28 members subjected to an 11-year running average. 1 SD is denoted with blue shading. The climatological mean of the P-E edge latitude and its 1 SD range in the PD state are denoted by horizontal solid and dashed lines, respectively. Graphic: Kim, et al., 2023 / Science Advances

Hemispherically asymmetric Hadley cell response to CO2 removal

ABSTRACT: A poleward shift of the Hadley cell (HC) edge in a warming climate, which contributes to the expansion of drought-prone subtropical regions, has been widely documented. The question addressed here is whether this shift is reversible with CO2 removal. By conducting large-ensemble experiments where CO2 concentrations are systematically increased and then decreased to the present-day level, we show that the poleward-shifted HC edge in a warming climate does not return to its present-day state when CO2 concentrations are reduced. While the Southern Hemisphere HC edge remains poleward of its present-day state, the Northern Hemisphere HC edge ends up farther equatorward of its present-day state. Such hemispherically asymmetric HC edge changes are closely associated with the changes in vertical wind shear in the subtropical atmosphere, which result from the long adjustment time of the ocean response to CO2 removal. Our findings suggest that CO2 removal may not guarantee the recovery of the subtropical dryness associated with the HC changes.

Hemispherically asymmetric Hadley cell response to CO2 removal