News roundup for 8 August 2022 – Climate impacts have worsened vast range of human diseases – “Forever chemicals” have made rainwater “unsafe to drink” globally
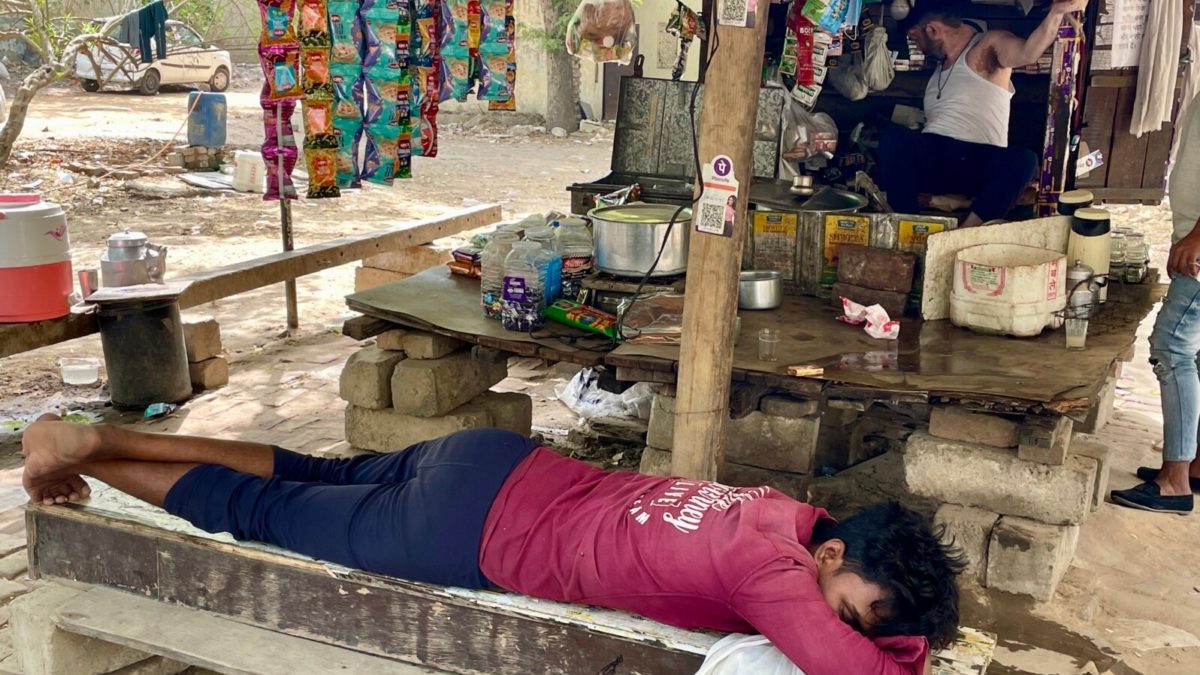
At this pavement stall, a worker rests as temperatures in May 2022 crossed 45 degrees Celsius. Photo: Anjana Pasricha / VOA By Sudarshan Varadhan 27 May 2022 NEW DELHI (Reuters) – India is expected to face a wider coal shortage...
By Priscilla Alvarez 10 September 2019 WASHINGTON (CNN) – The Trump administration will not grant temporary protected status, a form of humanitarian relief, to Bahamians affected by Hurricane Dorian, according to an administration official. The source did not say when...
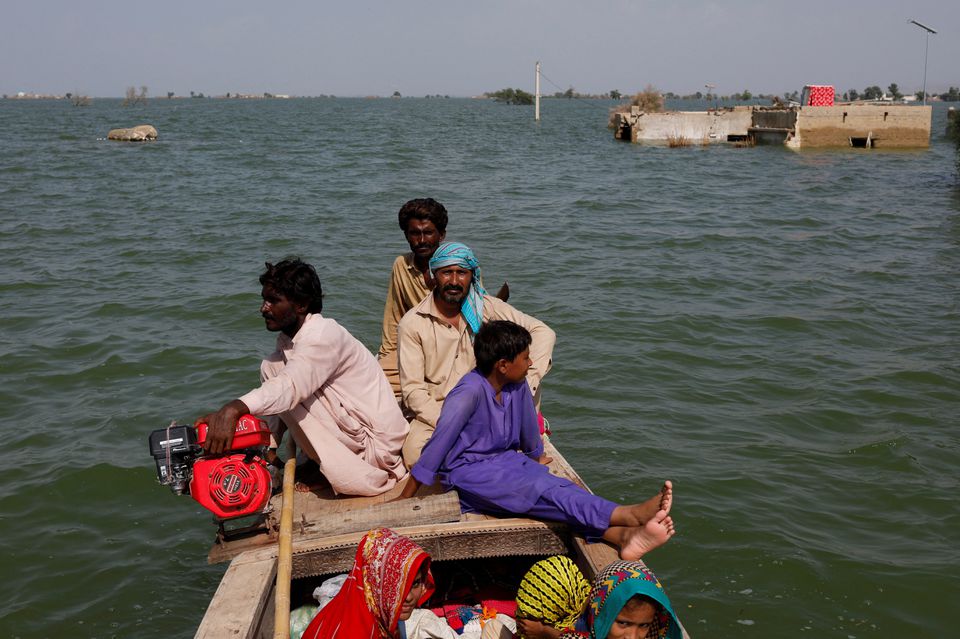
Residents ride on a wooden boat as they pass submerged houses amid flood water, following rains and floods during the monsoon season in Bajara village, at the banks of Manchar lake, in Sehwan, Pakistan 6 September 2022. Photo: Akhtar Soomro...