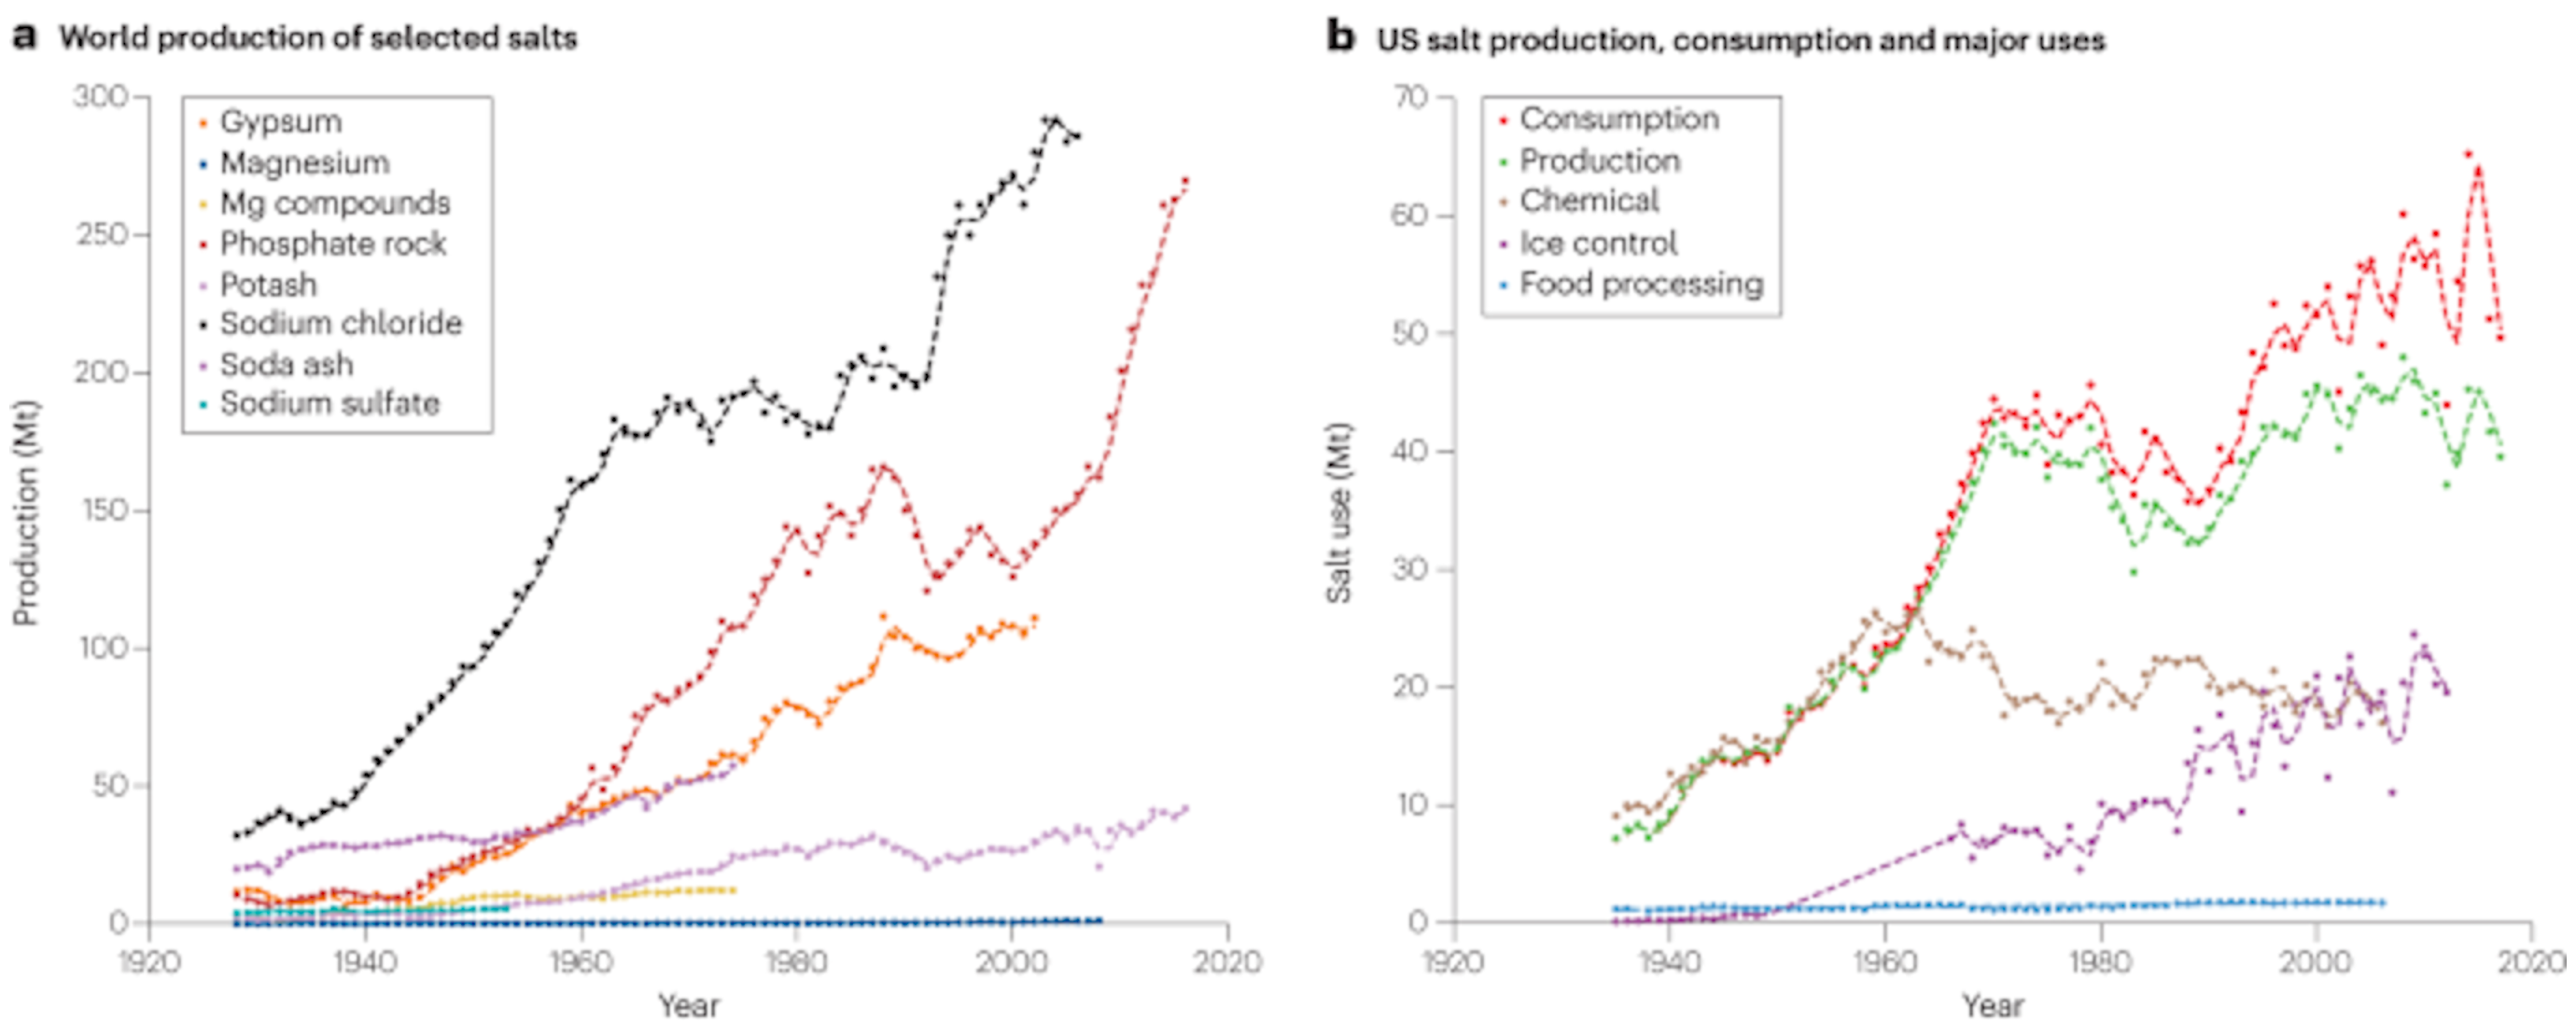
31 October 2023 (University of Maryland) – The influx of salt in streams and rivers is an ‘existential threat,’ according to a research team led by a UMD geologist. The planet’s demand for salt comes at a cost to the environment and human health, according to a new scientific review led by University of Maryland Geology Professor Sujay Kaushal. Published […]
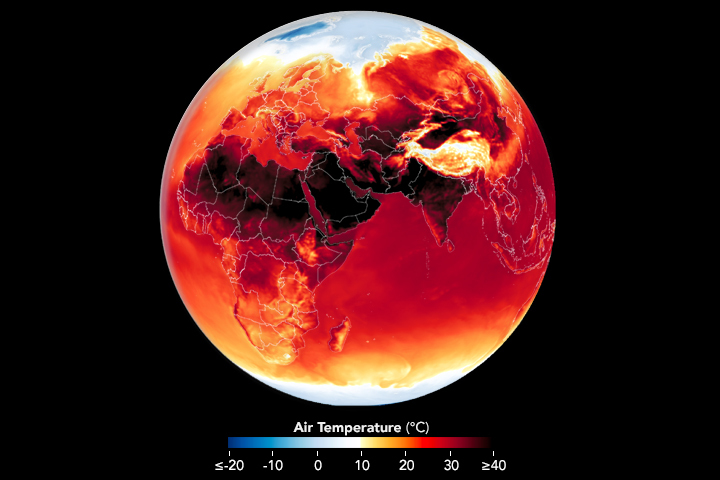
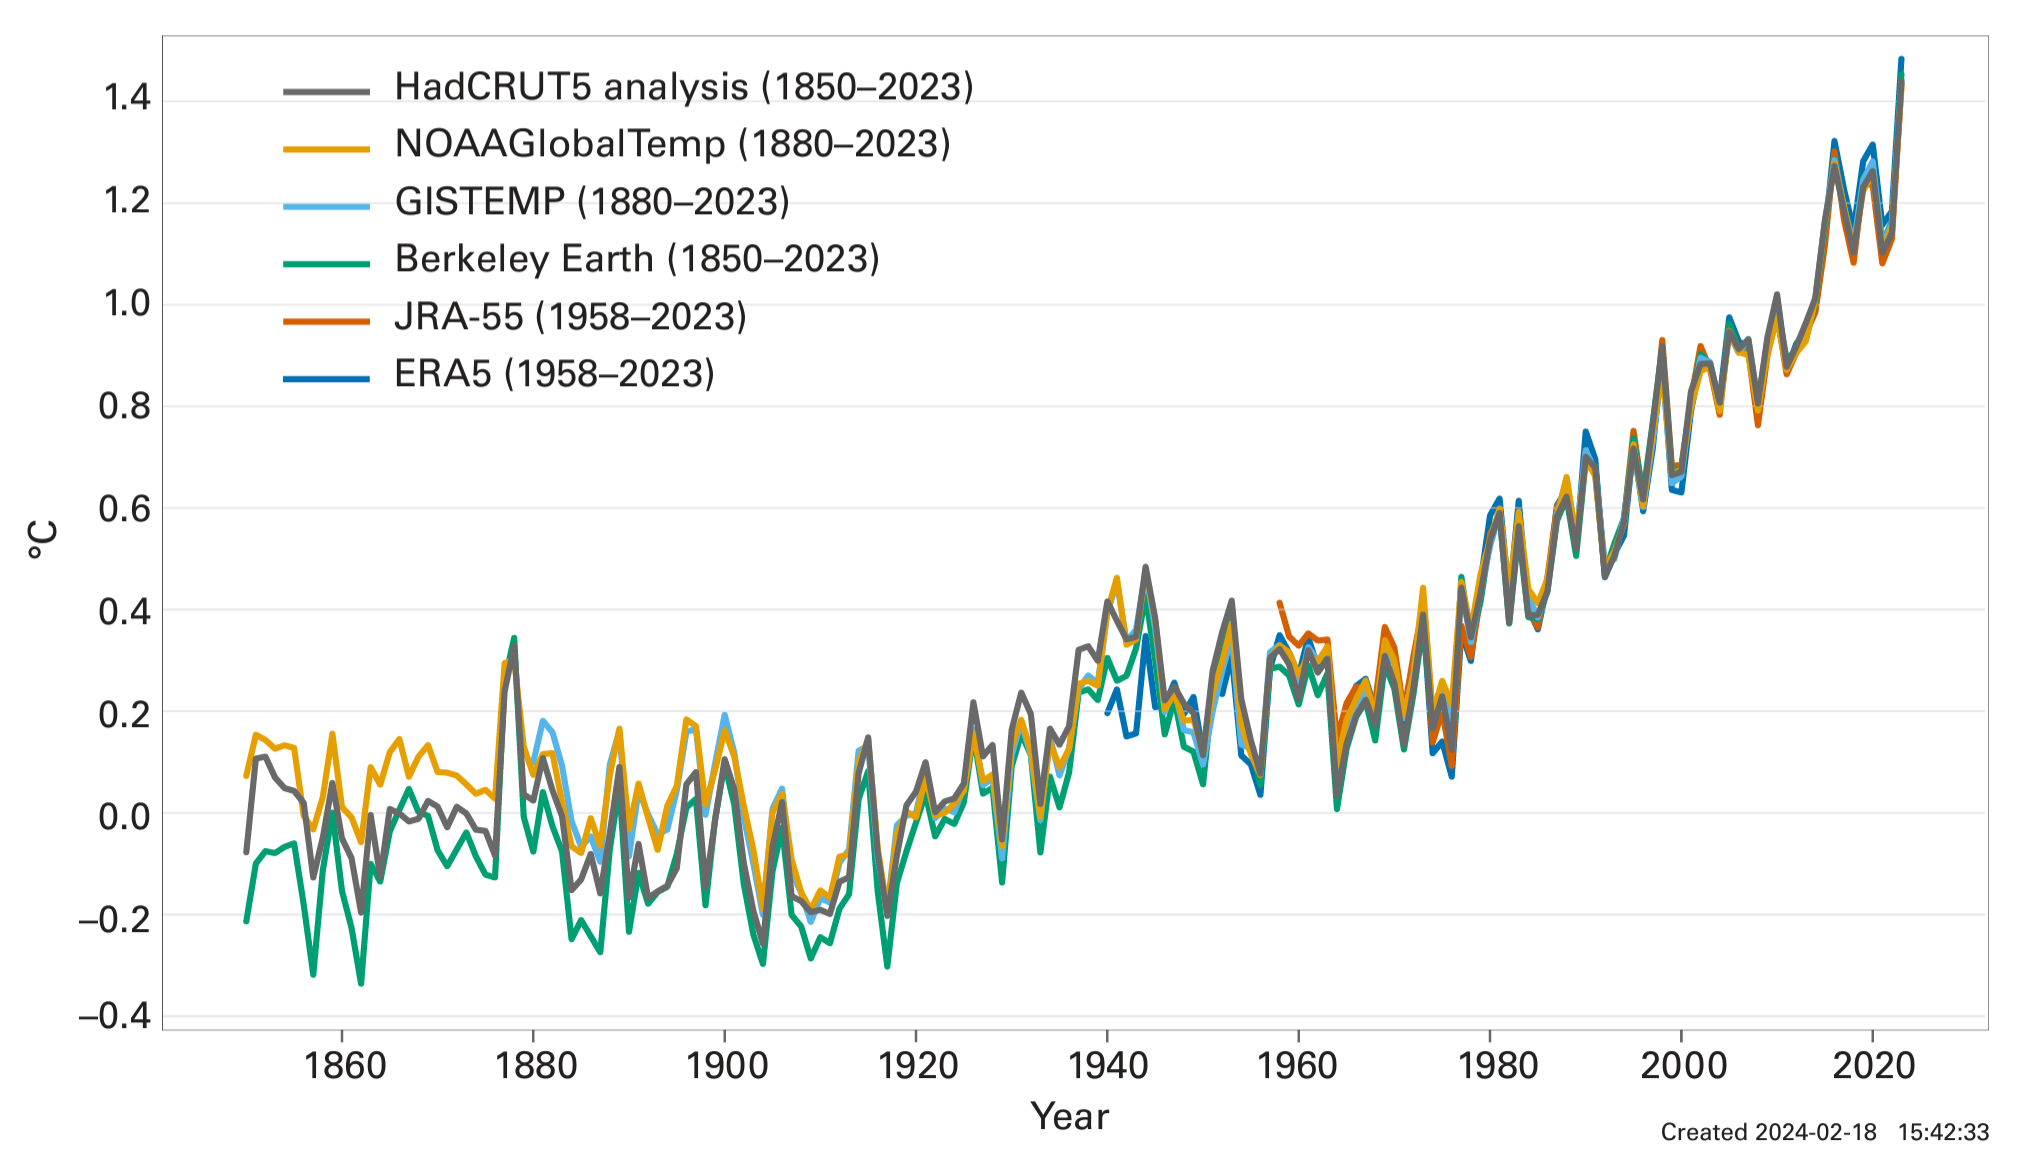
By Adam Voiland 28 June 2024 (NASA) – It’s only the beginning of the summer season in the Northern Hemisphere, but Earth is already roasting. Scientists from NASA’s Goddard Institute for Space Studies recently reported that May 2024, the hottest May in NASA’s global surface temperature analysis, marked a full year of record-high monthly temperatures. Likewise, NOAA recently reported that January through […]
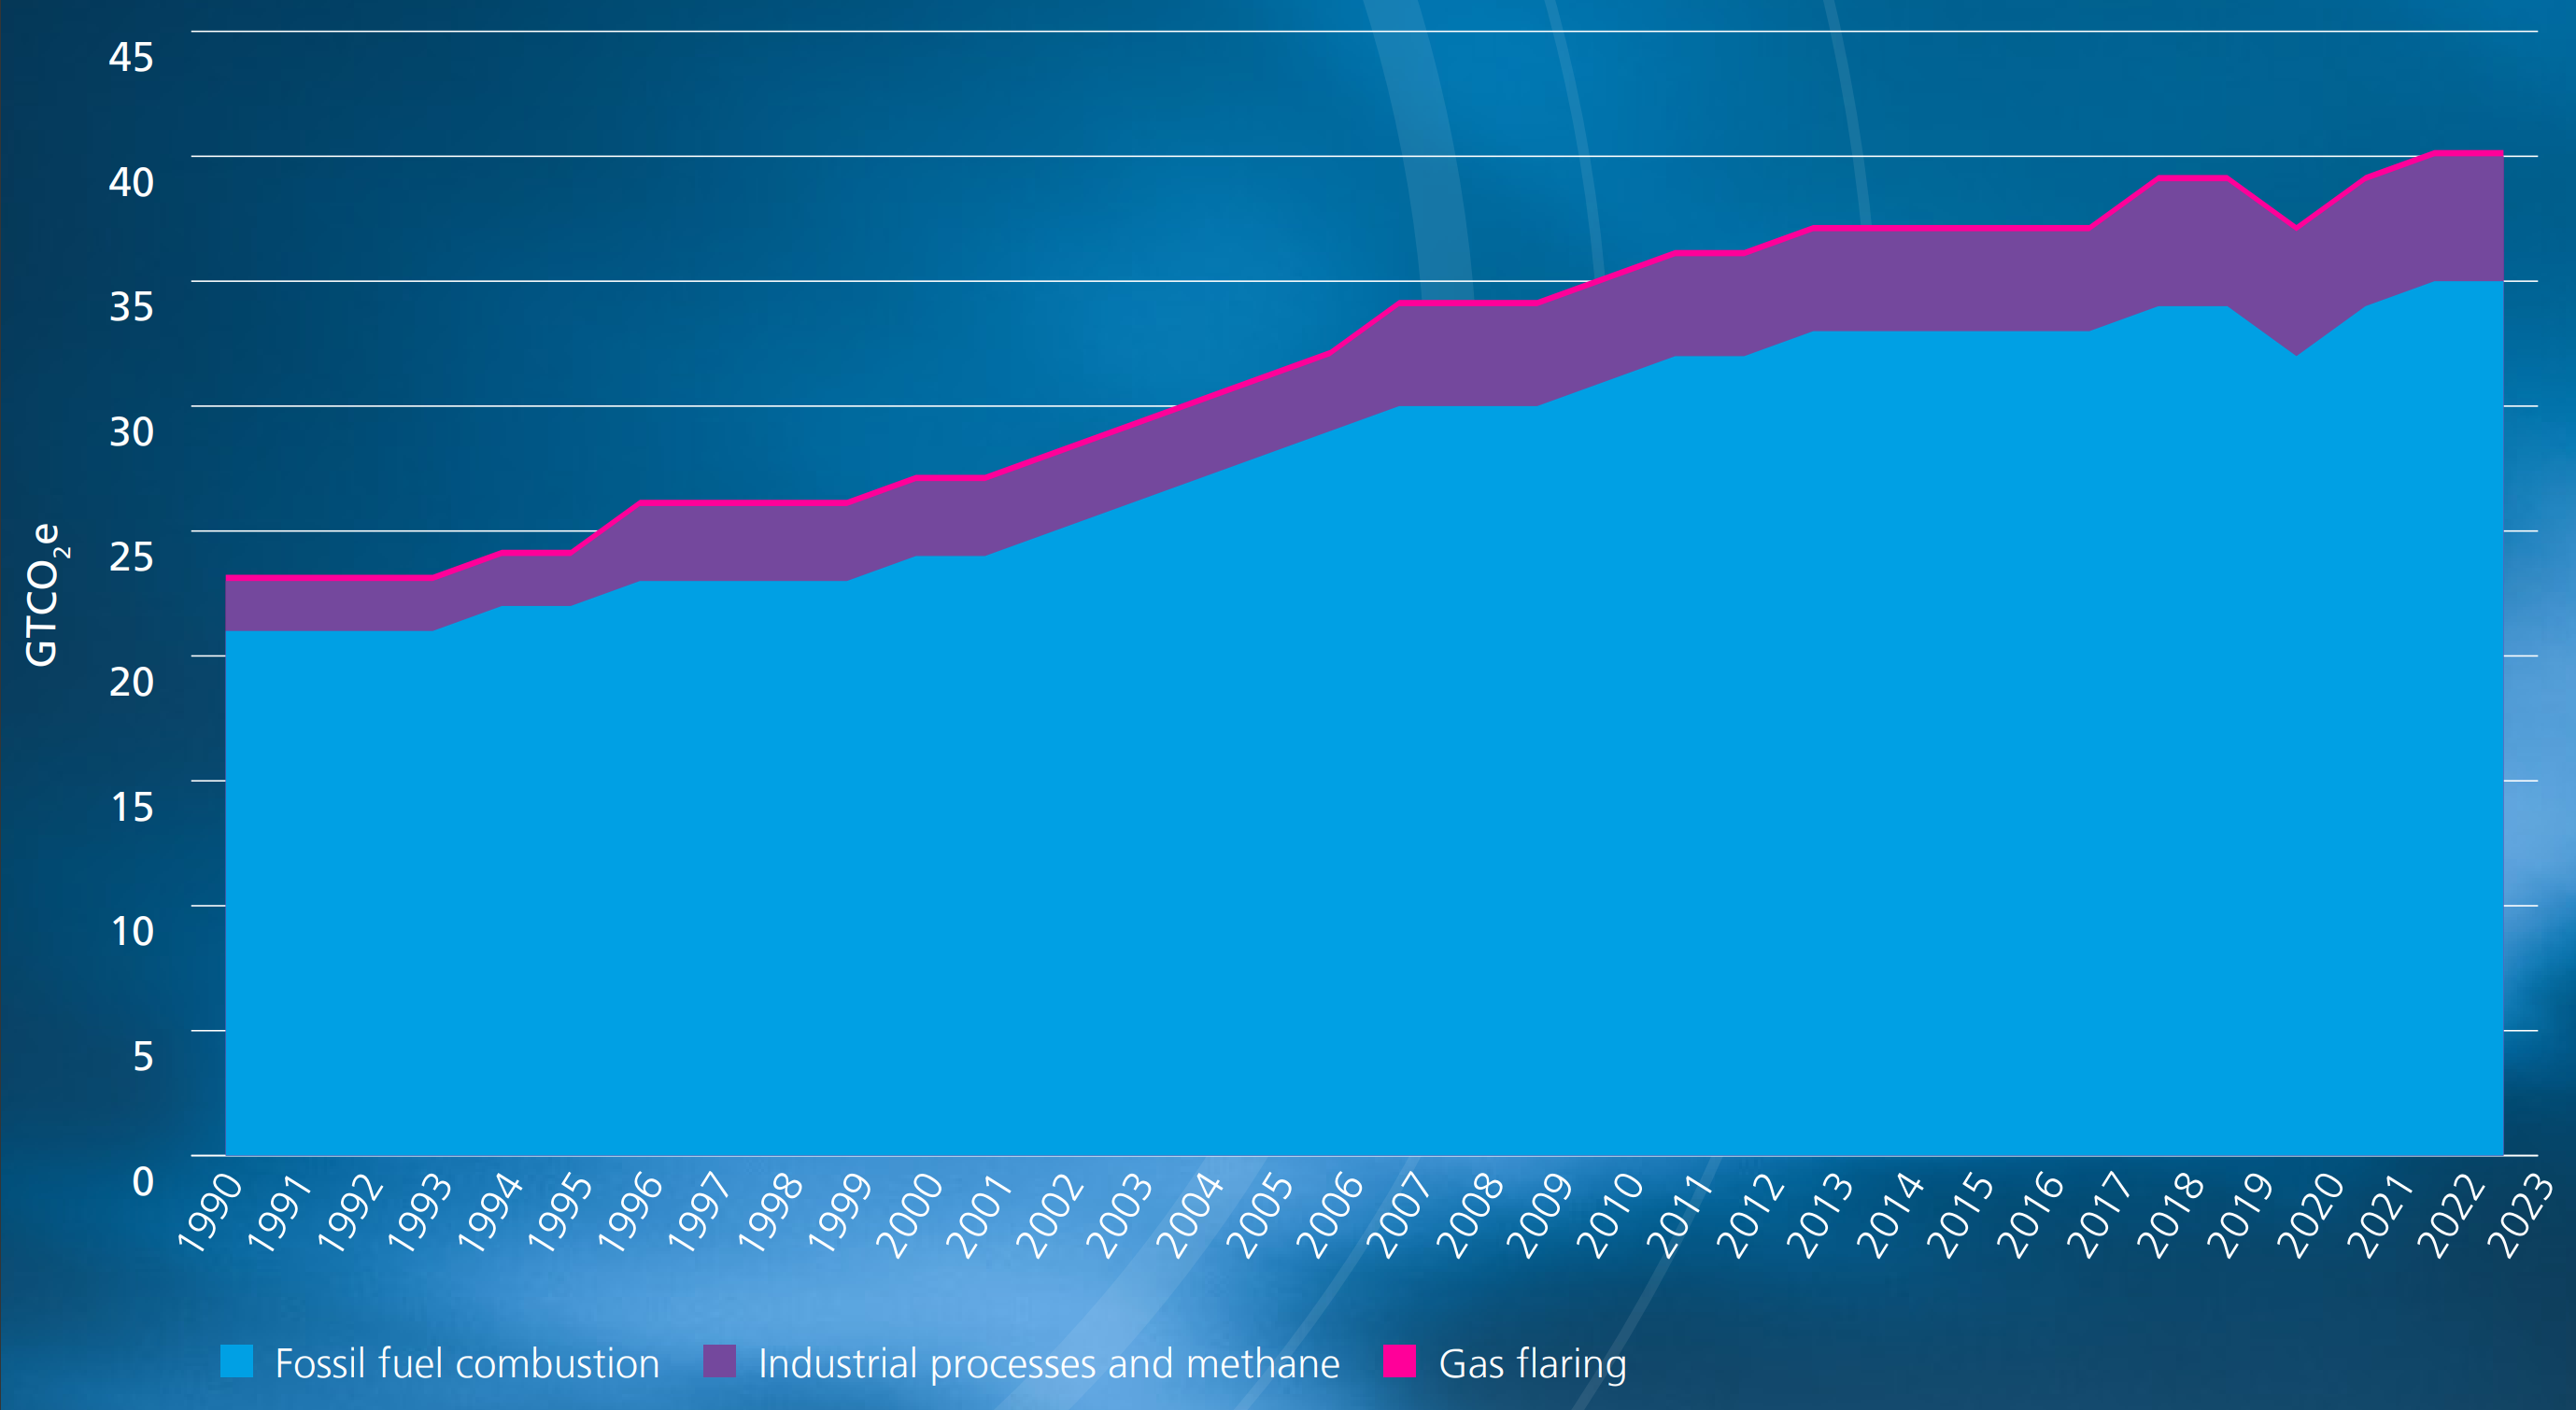
20 June 2024 (Energy Institute) – The Energy Institute (EI) and co-authors KPMG and Kearney today released the 73rd annual edition of the Statistical Review of World Energy, presenting for the first time full global energy data for 2023. Five key stories emerge from the 2023 data: EI President Juliet Davenport OBE HonFEI said: “Energy is central […]
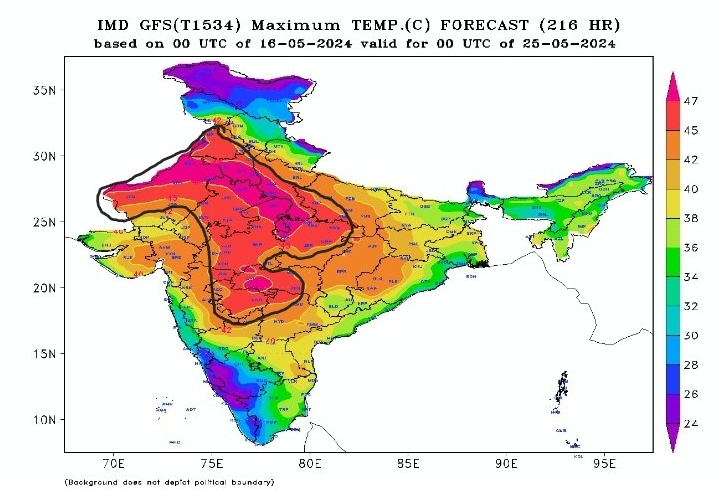
By Sakshi Dayal, Tanvi Mehta, and Anushree Fadnavis 31 May 2024 NEW DELHI (Reuters) – Animals collapsed, people jumped on water tankers with buckets amid shortages, and government employees changed their work hours as blistering summer heat kept its grip on north India on Thursday. Although Thursday’s readings were marginally lower in Delhi than the […]
By Karishma Mehrotra and Dan Stillman 29 May 2024 DELHI (The Washington Post) – India’s capital territory of Delhi experienced some of its hottest weather on record Tuesday and Wednesday, with highs in some neighborhoods near the landmark threshold of 50 degrees Celsius (122 degrees Fahrenheit). The exceptional heat has closed schools, endangered outdoor workers, […]
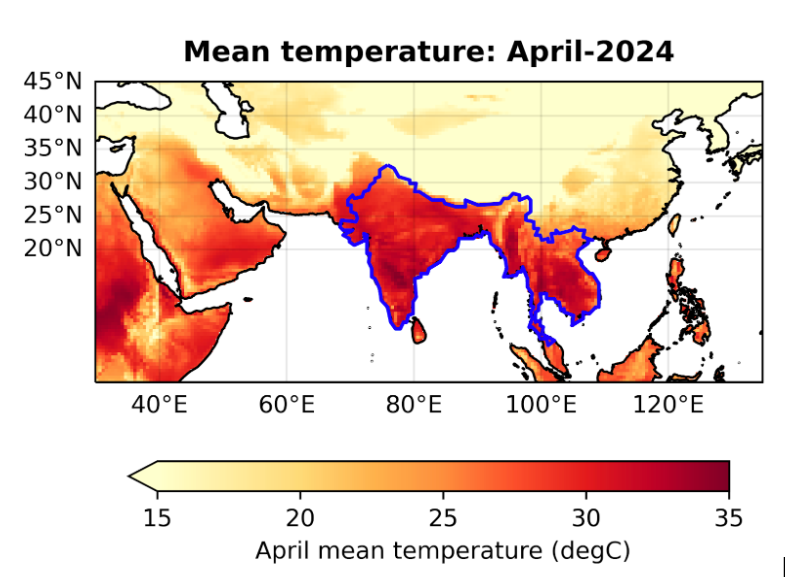
By Sibi Arasu 14 May 2024 BENGALURU, India (AP) – Sizzling heat across Asia and the Middle East in late April that echoed last year’s destructive swelter was made 45 times more likely in some parts of the continent because of human-caused climate change, a study Tuesday found. Scorching temperatures were felt across large swaths of Asia, […]
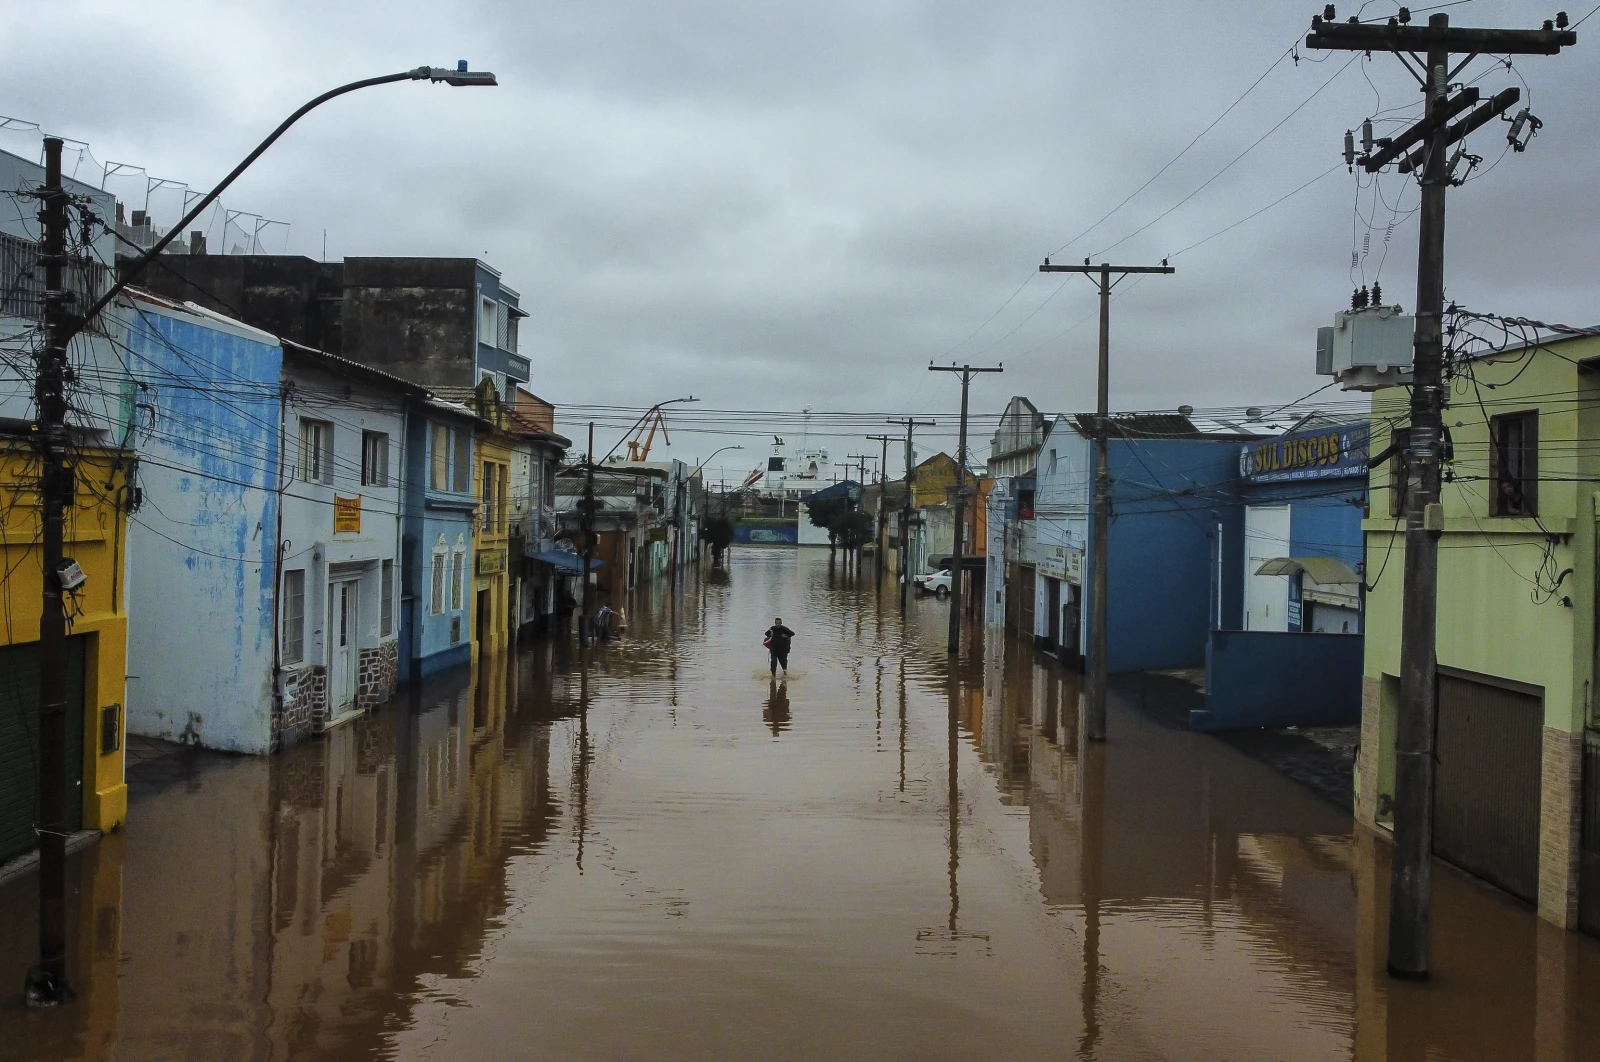
By Seth Borenstein, Suman Naishadham, Sibi Arasu, and Fabiano Maisonnave 7 May 2024 (AP News) – In sweltering Brazil, flooding killed dozens of people and paralyzed a city of about 4 million people. Voters and politicians in India, amid national elections, are fainting in heat that hit as high as 115 degrees (46.3 degrees Celsius). […]
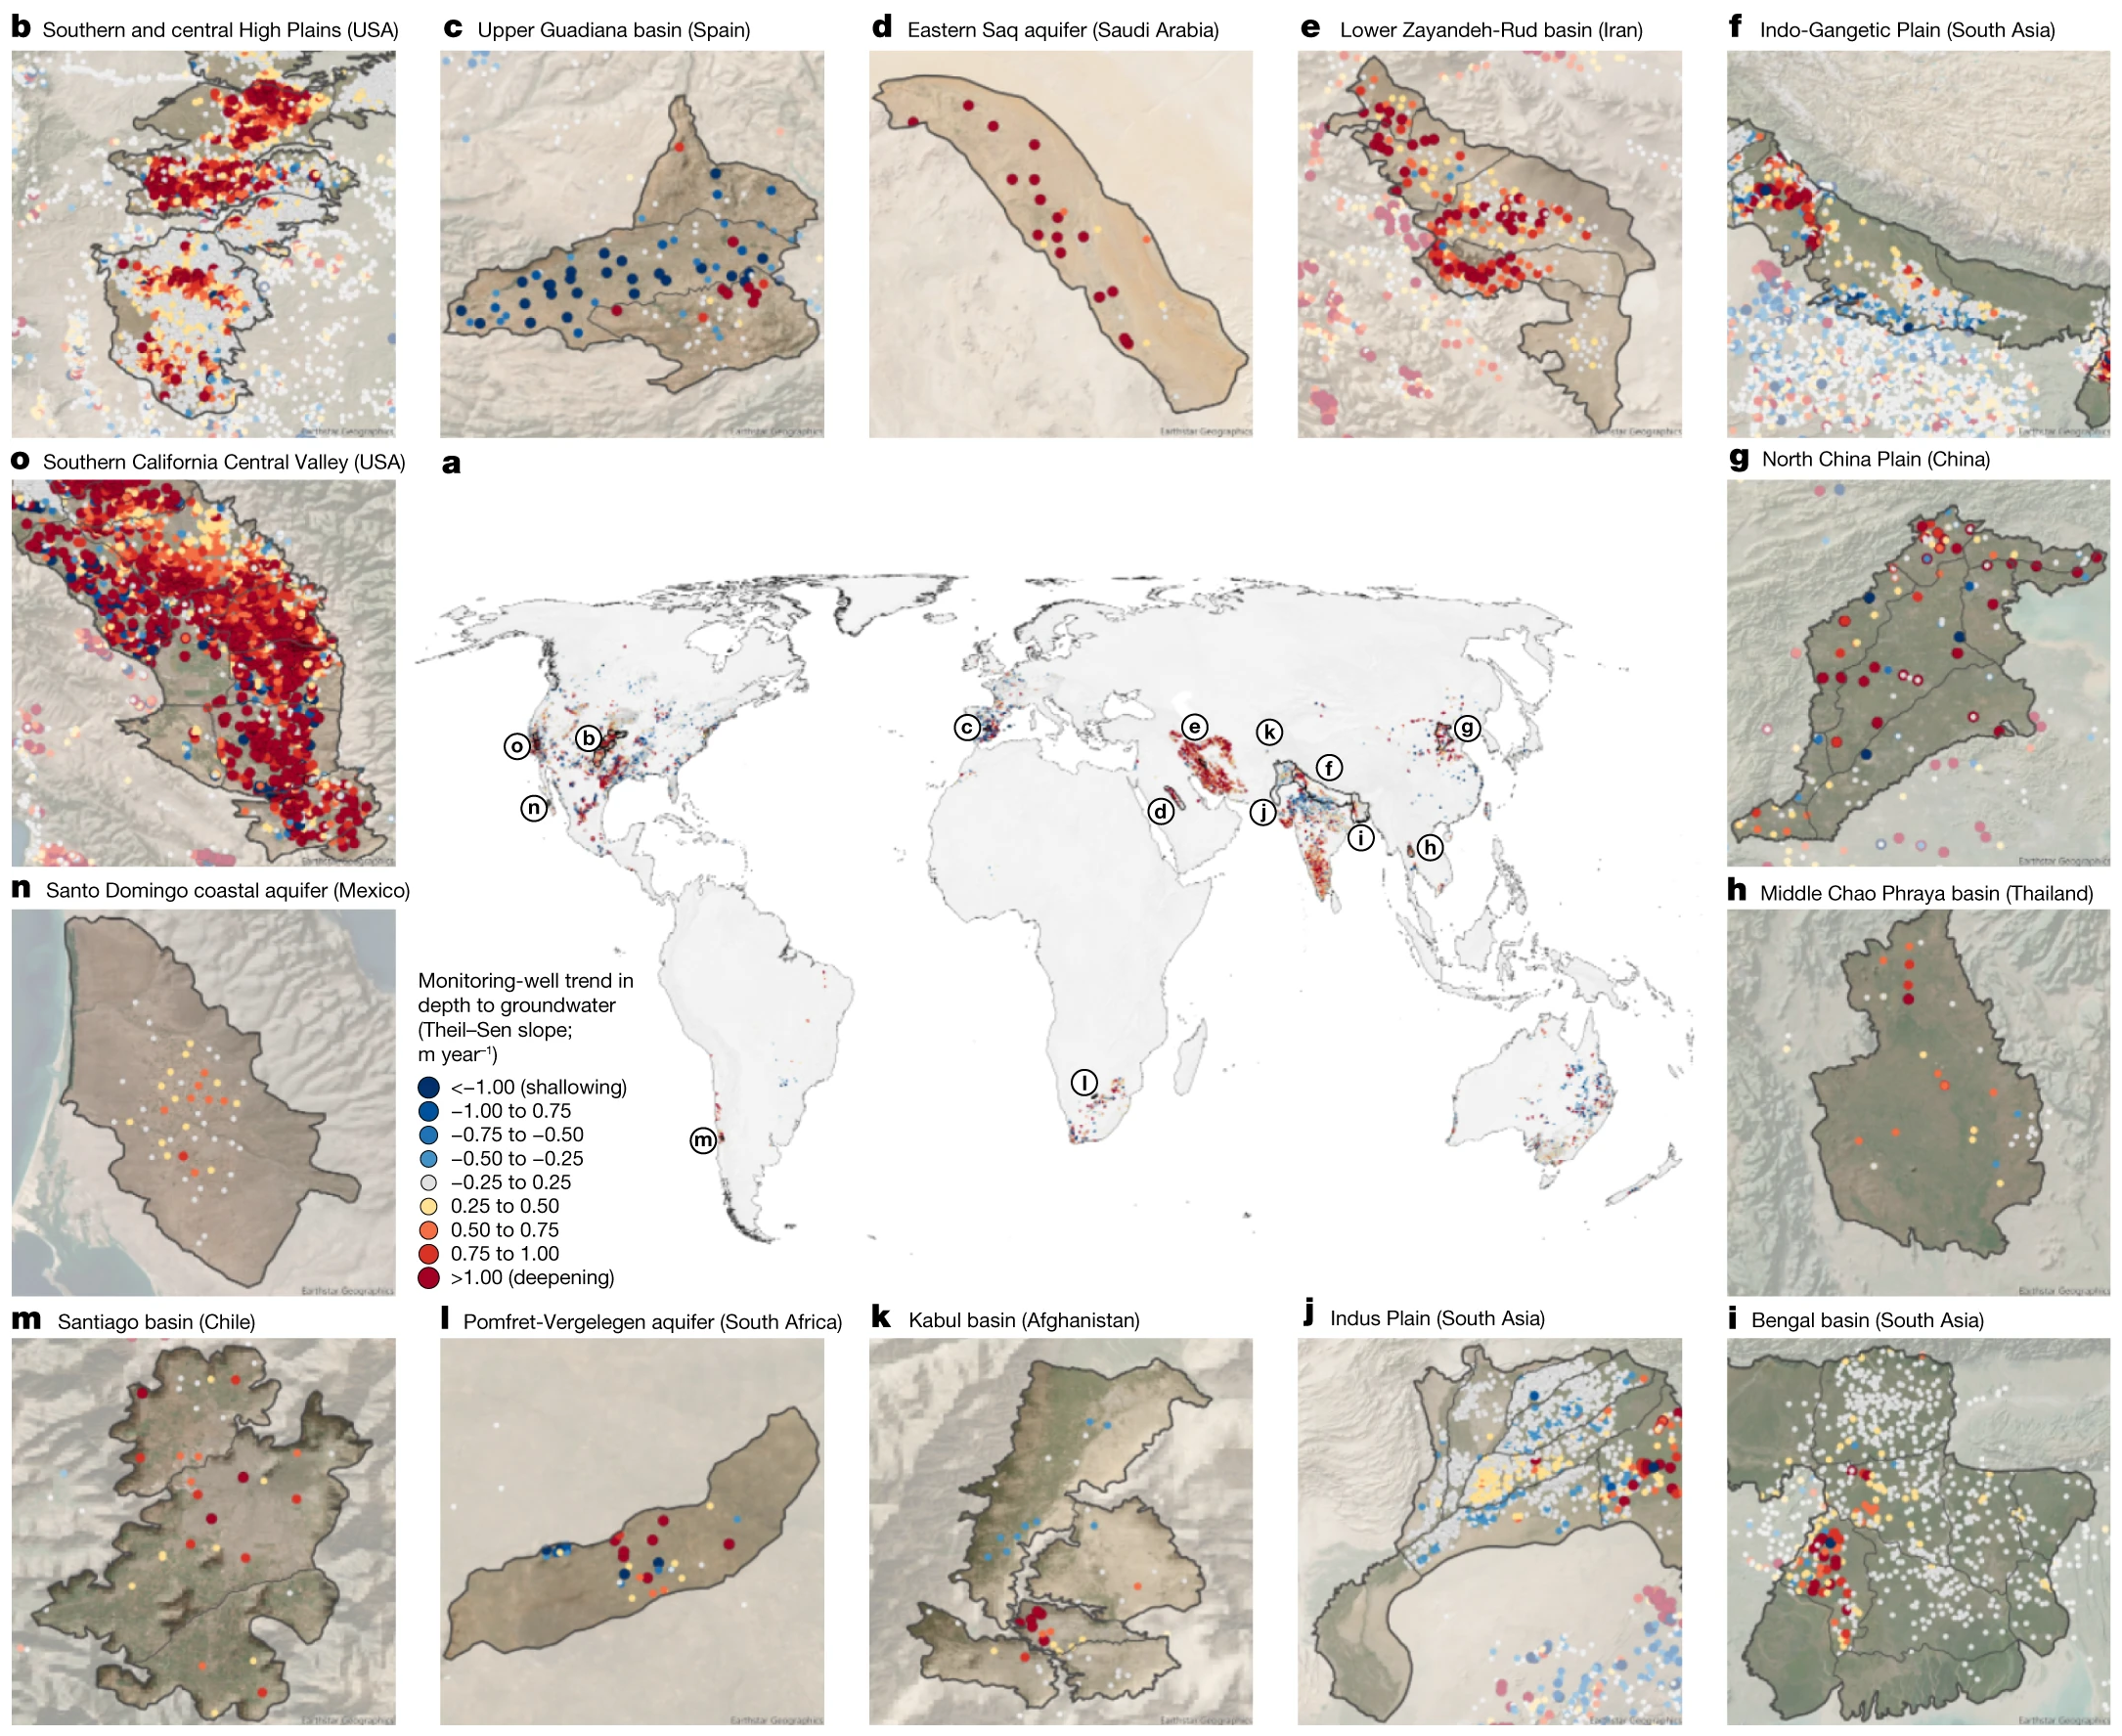
By Matthew Rozsa 24 January 2024 (Salon) – Humans rely on groundwater for many things, but especially our food. Roughly 30 percent of all the planet’s available freshwater comes from groundwater, or water that is found underground in the spaces between rocks, soil and sand. It is primarily used for agriculture and billions of humans are dependent […]
19 March 2024 (WMO) – A new report from the World Meteorological Organization (WMO) shows that records were once again broken, and in some cases smashed, for greenhouse gas levels, surface temperatures, ocean heat and acidification, sea level rise, Antarctic sea ice cover and glacier retreat. Heatwaves, floods, droughts, wildfires, and rapidly intensifying tropical cyclones […]
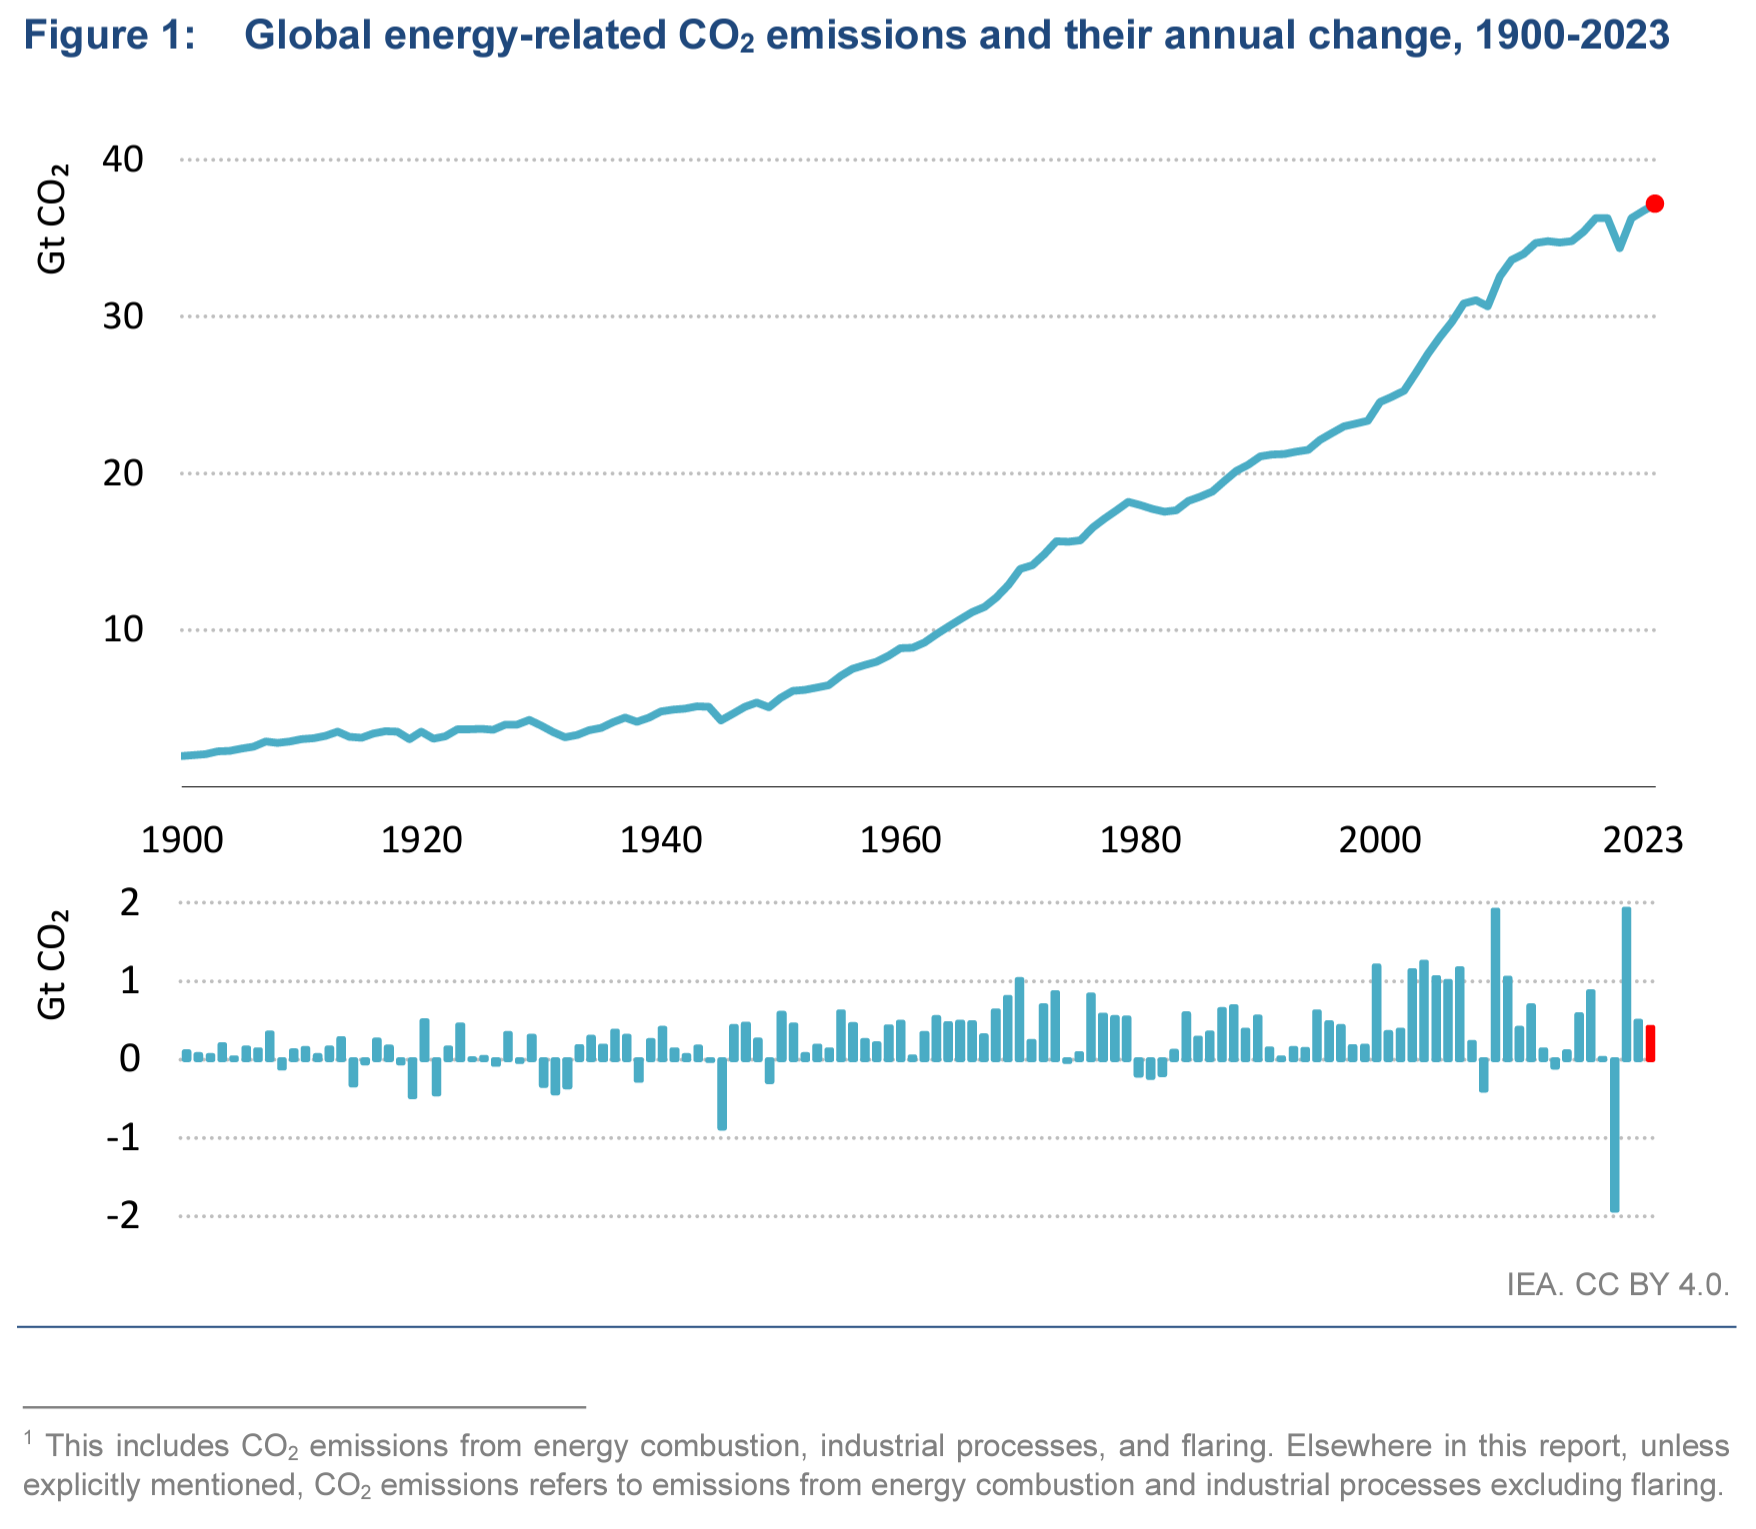
March 2024 (IEA) – CO2 Emissions in 2023 provides a complete picture of energy-related emissions in 2023. The report finds that clean energy growth has limited the rise in global emissions, with 2023 registering an increase of 1.1 percent. Weather effects and continued Covid-19 reopening played a significant role in driving emissions in 2023. Advanced economies saw […]