IEA: CO2 emissions in 2023 reached record high – Weather effects and continued Covid-19 reopening played a significant role in driving emissions in 2023
March 2024 (IEA) – CO2 Emissions in 2023 provides a complete picture of energy-related emissions in 2023. The report finds that clean energy growth has limited the rise in global emissions, with 2023 registering an increase of 1.1 percent. Weather effects and continued Covid-19 reopening played a significant role in driving emissions in 2023. Advanced economies saw a record decrease in their emissions, which are now back to the level of fifty years ago. This release brings together the IEA’s latest analysis, combining the Agency’s estimates of CO2 emissions from all energy sources and industrial processes.
This report is a companion piece to our Clean Energy Market Monitor, released in parallel.
Executive Summary
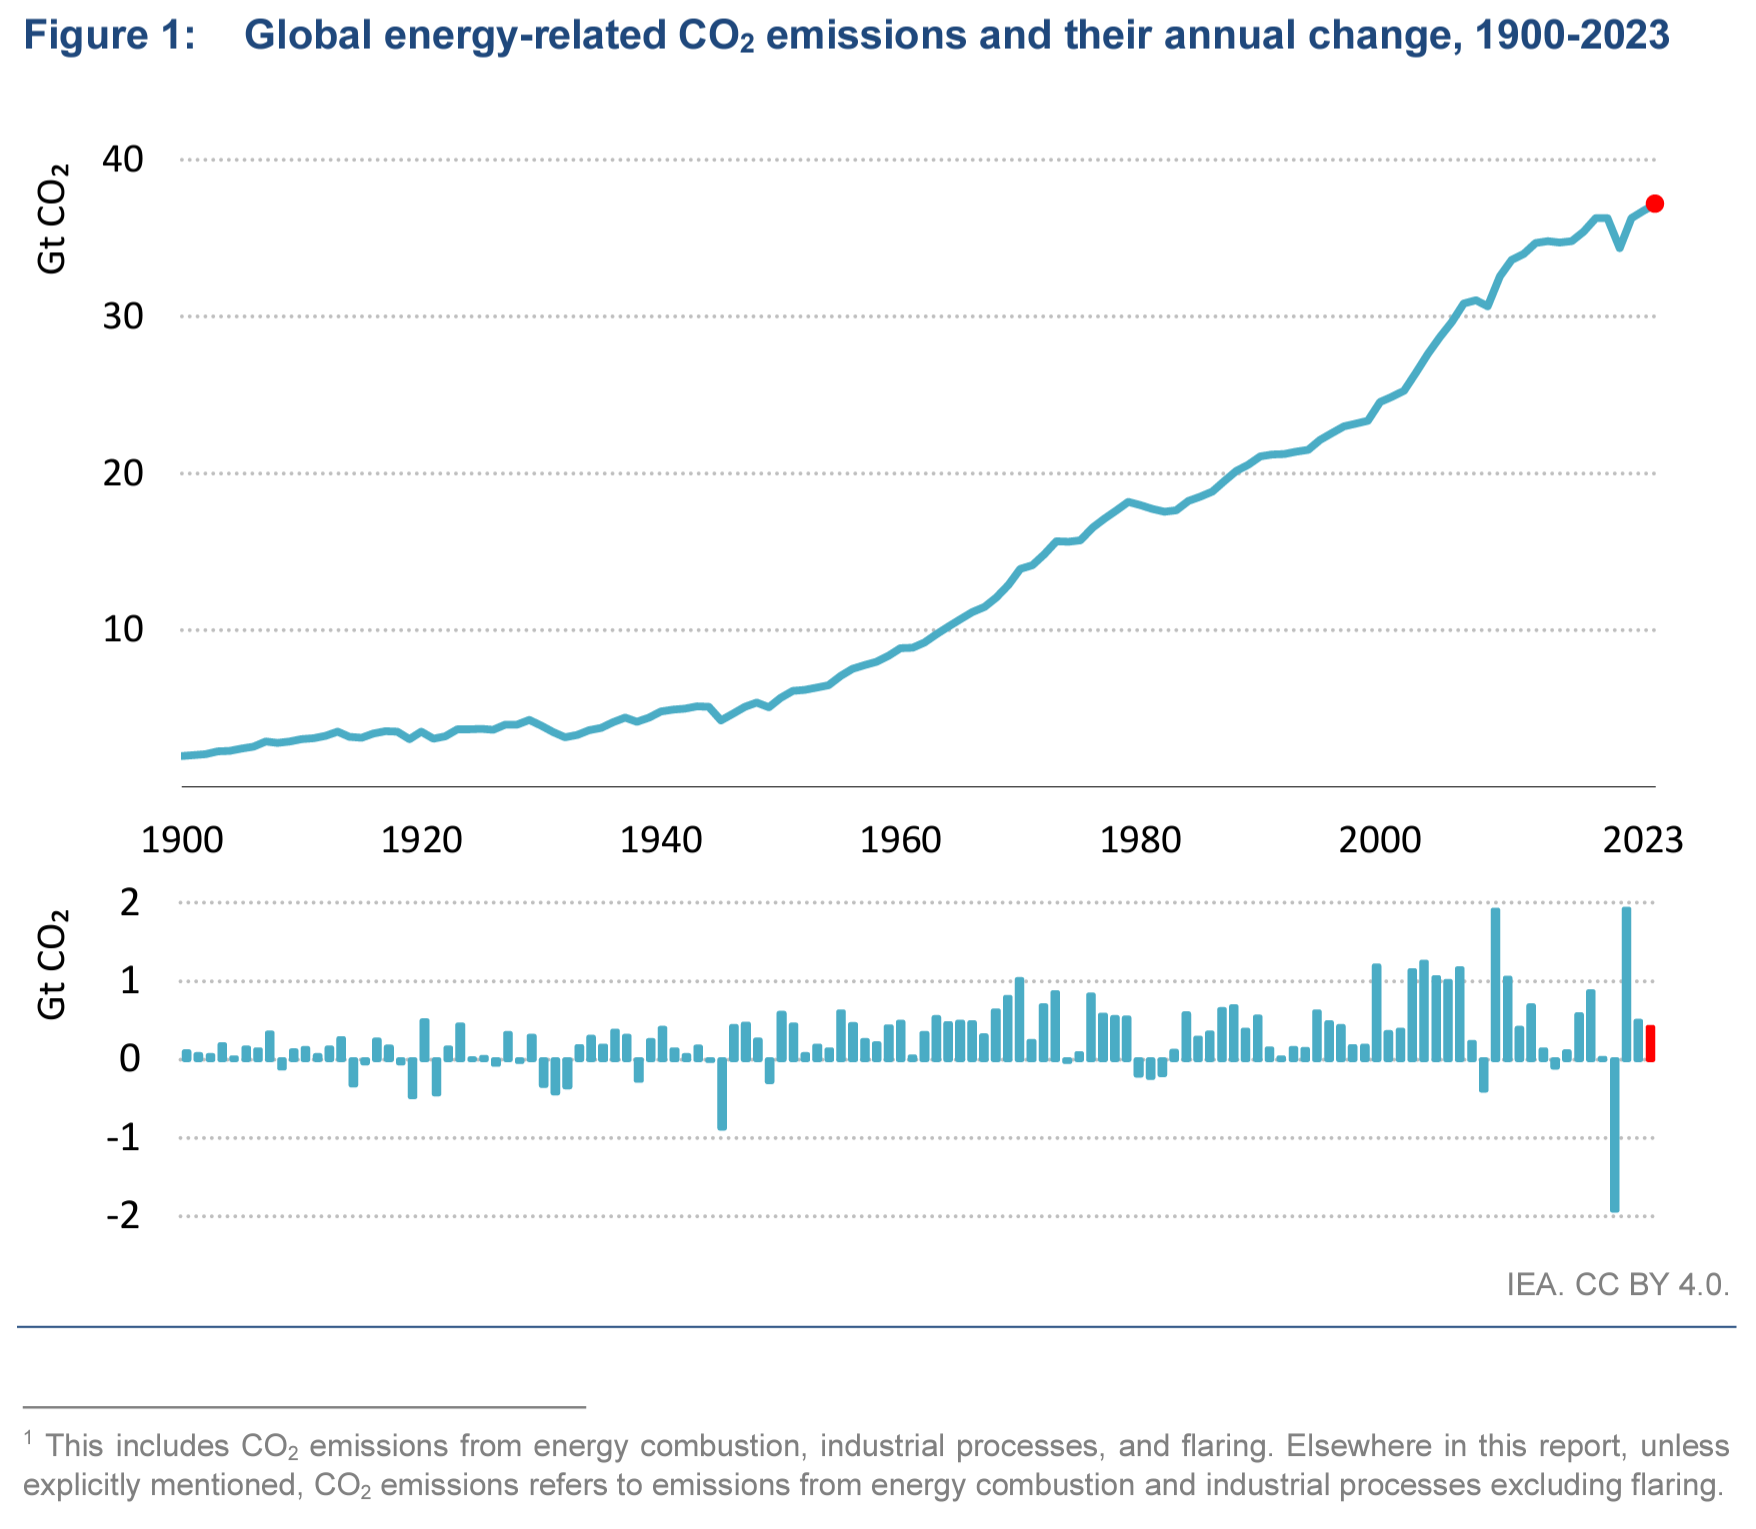
- Global energy-related CO2 emissions grew by 1.1% in 2023, increasing 410 million tonnes (Mt) to reach a new record high of 37.4 billion tonnes (Gt). This compares with an increase of 490 Mt in 2022 (1.3%). Emissions from coal accounted for more than 65% of the increase in 2023.
- The global shortfall in hydropower generation due to droughts drove up emissions by around 170 Mt. Without this effect, emissions from the global electricity sector would have fallen in 2023.
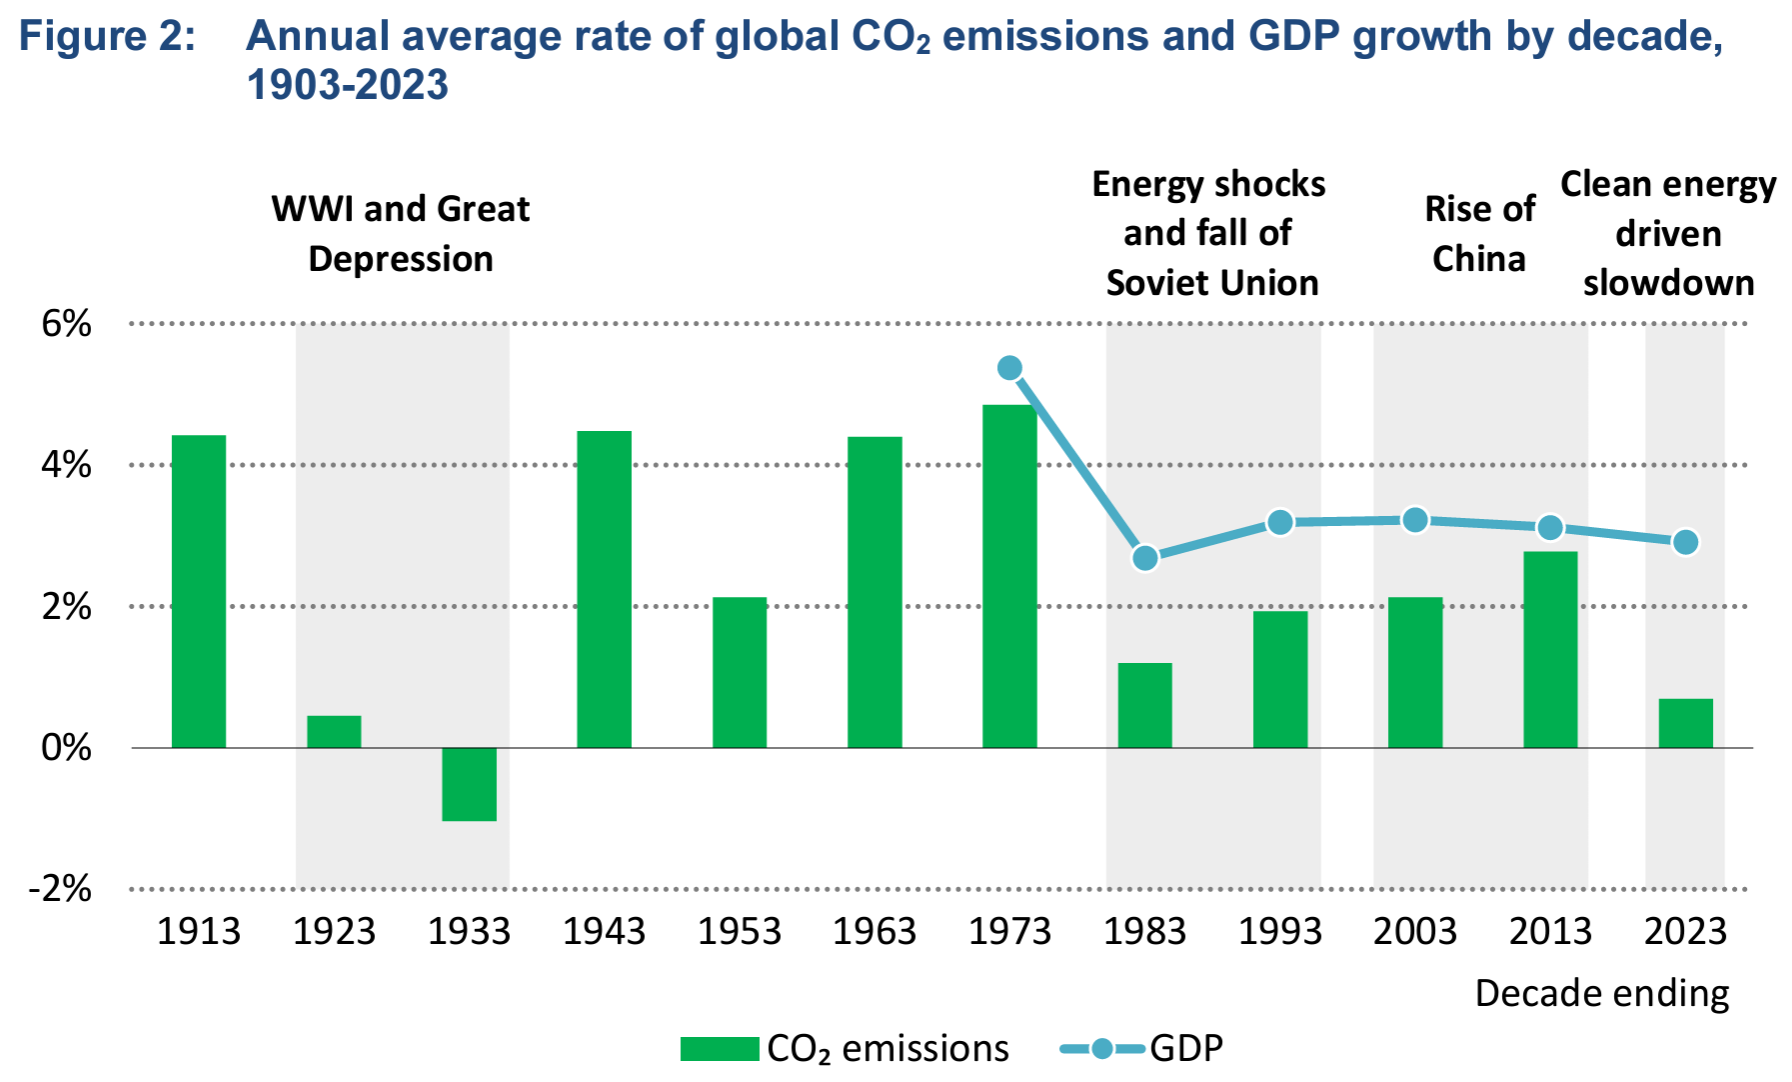
- Between 2019 and 2023, total energy-related emissions increased around 900 Mt. Without the growing deployment of five key clean energy technologies since 2019 – solar PV, wind, nuclear, heat pumps, and electric cars – the emissions growth would have been three times larger.
- Thanks to growing clean energy deployment, emissions are seeing a structural slowdown. In the decade to 2023, global emissions grew slightly more than 0.5% per year, the slowest rate since the Great Depression.
- Advanced economy GDP grew 1.7% but emissions fell 4.5%, a record decline outside of a recessionary period. Having fallen by 520 Mt in 2023, emissions are now back to their level of fifty years ago. Advanced economy coal demand, driven by evolutions in the G7, is back to the level of around 1900. The 2023 decline in advanced economy emissions was caused by a combination of structural and cyclical factors, including strong renewables deployment, coal-to-gas switching in the United States, but also weaker industrial production in some countries, and milder weather.
- Emissions in China grew around 565 Mt in 2023, by far the largest increase globally and a continuation of China’s emissions-intensive economic growth in the post-pandemic period. However, China continued to dominate global clean energy additions. Cyclical effects, notably a historically bad hydro year, contributed about one-third of its emissions growth in 2023. Per capita emissions in China are now 15% higher than in advanced economies.
- In India, strong GDP growth drove up emissions by around 190 Mt. But a weak monsoon increased demand for electricity and cut hydro production, contributing around one-quarter of the increase in its total emissions in 2023. Per capita emissions in India remain far below the world average.
Emissions grew in 2023, but clean energy is limiting the growth
The 1.1% increase in emissions in 2023 represented an increase of around 410 million tonnes (Mt CO2). The percentage growth of emissions was substantially slower than global GDP growth, which was around 3% in 2023. Last year therefore continued the recent trend of CO2 growing more slowly than global economic activity. Over the ten years ending with 2023, global CO2 emissions have grown by slightly more than 0.5% per year. This is not just due to the Covid-19 pandemic: although emissions fell precipitously in 2020, by the following year they had already rebounded to the pre-pandemic level. It was also not caused by slow global GDP growth, which averaged a robust 3% per year across the course of the previous decade, in line with the annual average over the last 50 years.
The rate of emissions growth seen over the last decade is slower than that seen during the 1970s and 1980s, which saw major disruptions with the two energy shocks of 1973-4 and 1979-80, and a macroeconomic shock of global significance with the fall of the Soviet Union in 1989-90. When the last ten years are put in a broader historical context, a comparably slow rate of CO2 emissions growth only occurred in the extremely disruptive decades of World War I and the Great Depression. Global CO2 emissions are therefore undergoing a structural slowdown even as global prosperity grows.
Clean energy is at the heart of this slowdown in emissions. Global capacity additions of wind and solar PV reached a record almost 540 GW in 2023, up 75% on the level of 2022. Global sales of electric cars climbed to around 14 million, an increase of 35% on the level of 2022. Clean energy is having a significant impact on the trajectory of global CO2 emissions.
On the back of Covid-19 stimulus packages, there has been a significant acceleration in clean energy deployment since 2019. Between 2019 and 2023, total energy-related emissions increased around 900 Mt. Without the growing deployment of five key clean energy technologies since 2019 – solar PV, wind power, nuclear power, heat pumps, and electric cars – the emissions growth would have been three times larger.
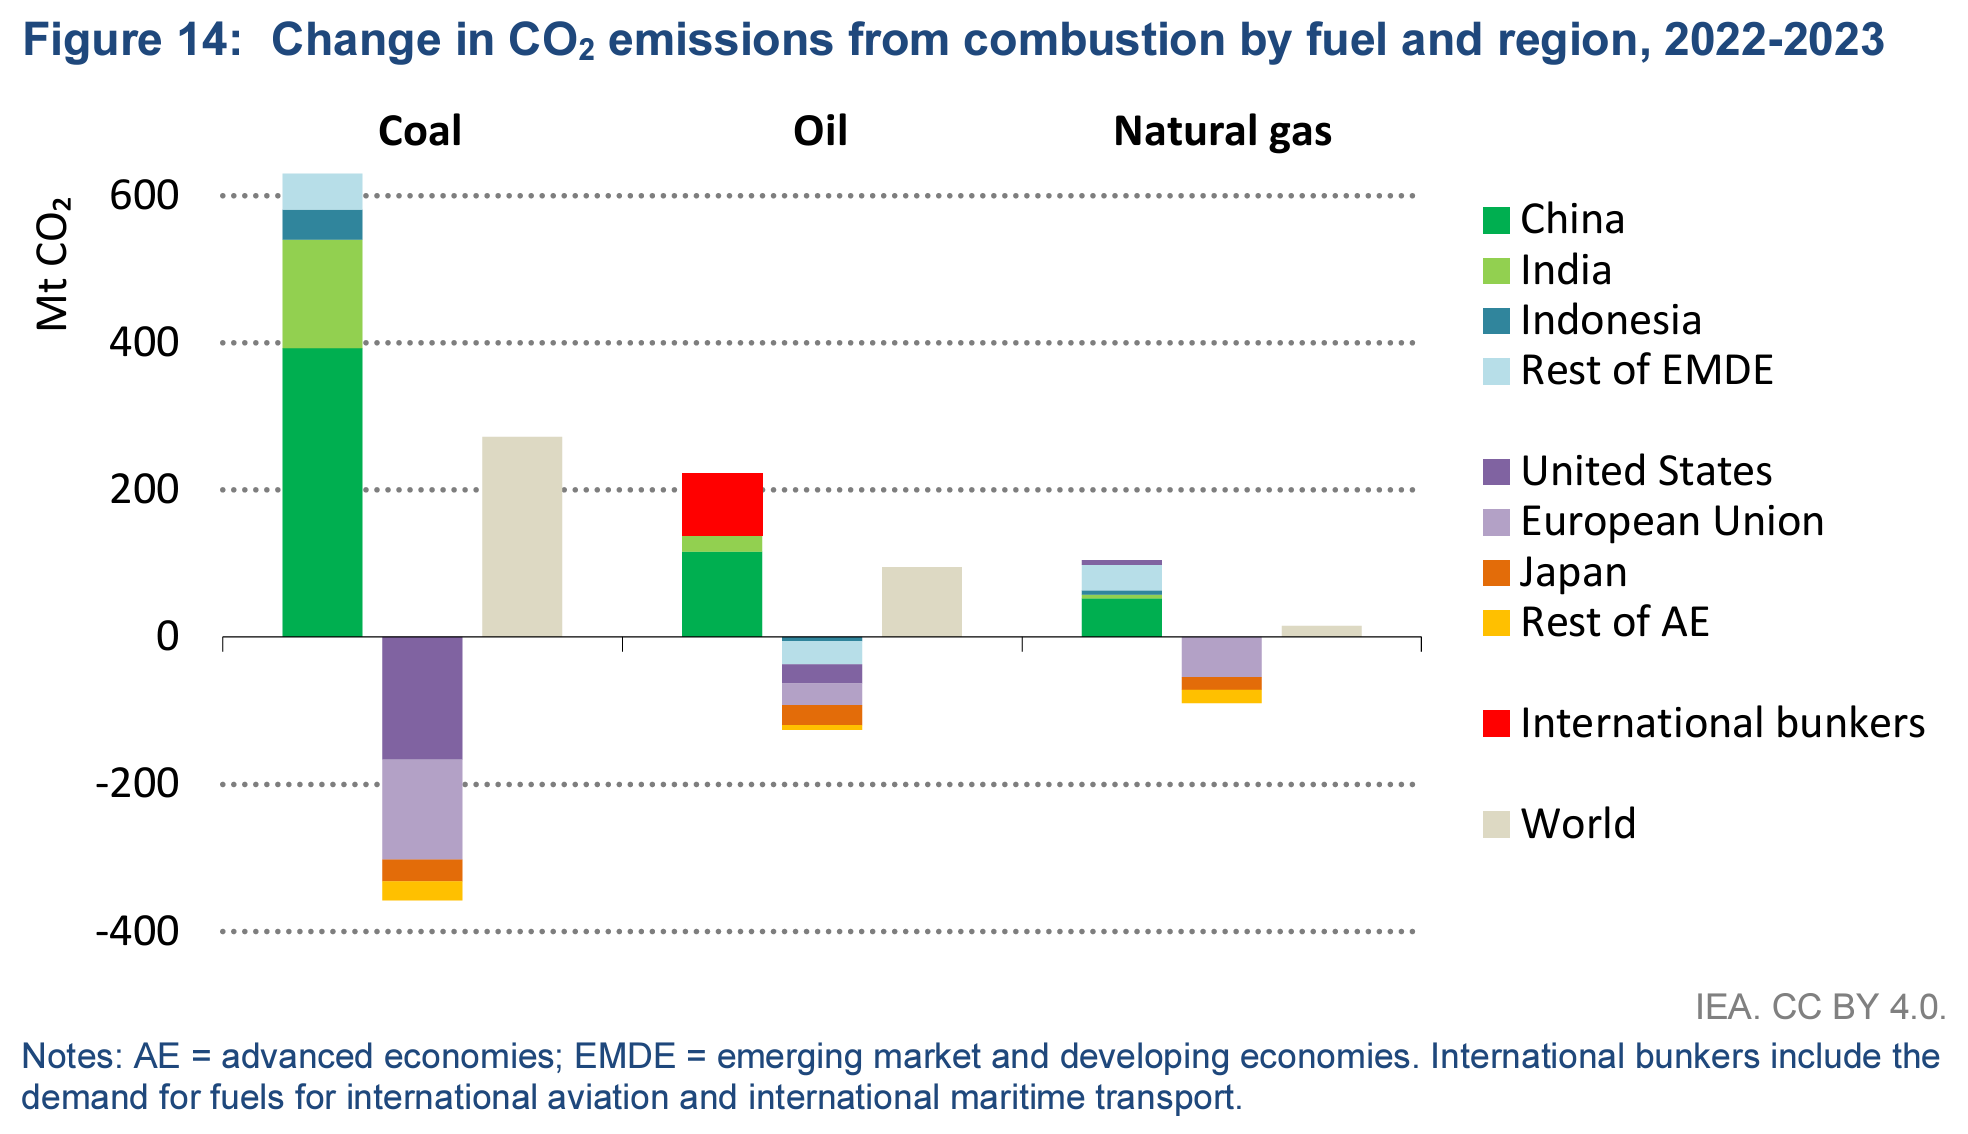
Coal demand in emerging market and developing economies was the biggest driver in global emissions growth
Coal has contributed by far the most to the increase of global CO2 emissions in the post-pandemic era. Global emissions from energy combustion have increased by around 850 Mt since 2019; those from coal have grown by 900 Mt, gas emissions have increased moderately, and oil emissions are still slightly below their 2019 level.
Coal accounted for around 70% of the increase in global emissions from energy combustion in 2023 (+270 Mt). China and India saw substantial increases in emissions from coal combustion, only partially offset by declines in advanced economies. Oil emissions were pushed up by the reopening in China and in global aviation, increasing by around 95 Mt globally. Natural gas emissions increased only marginally at the global level.
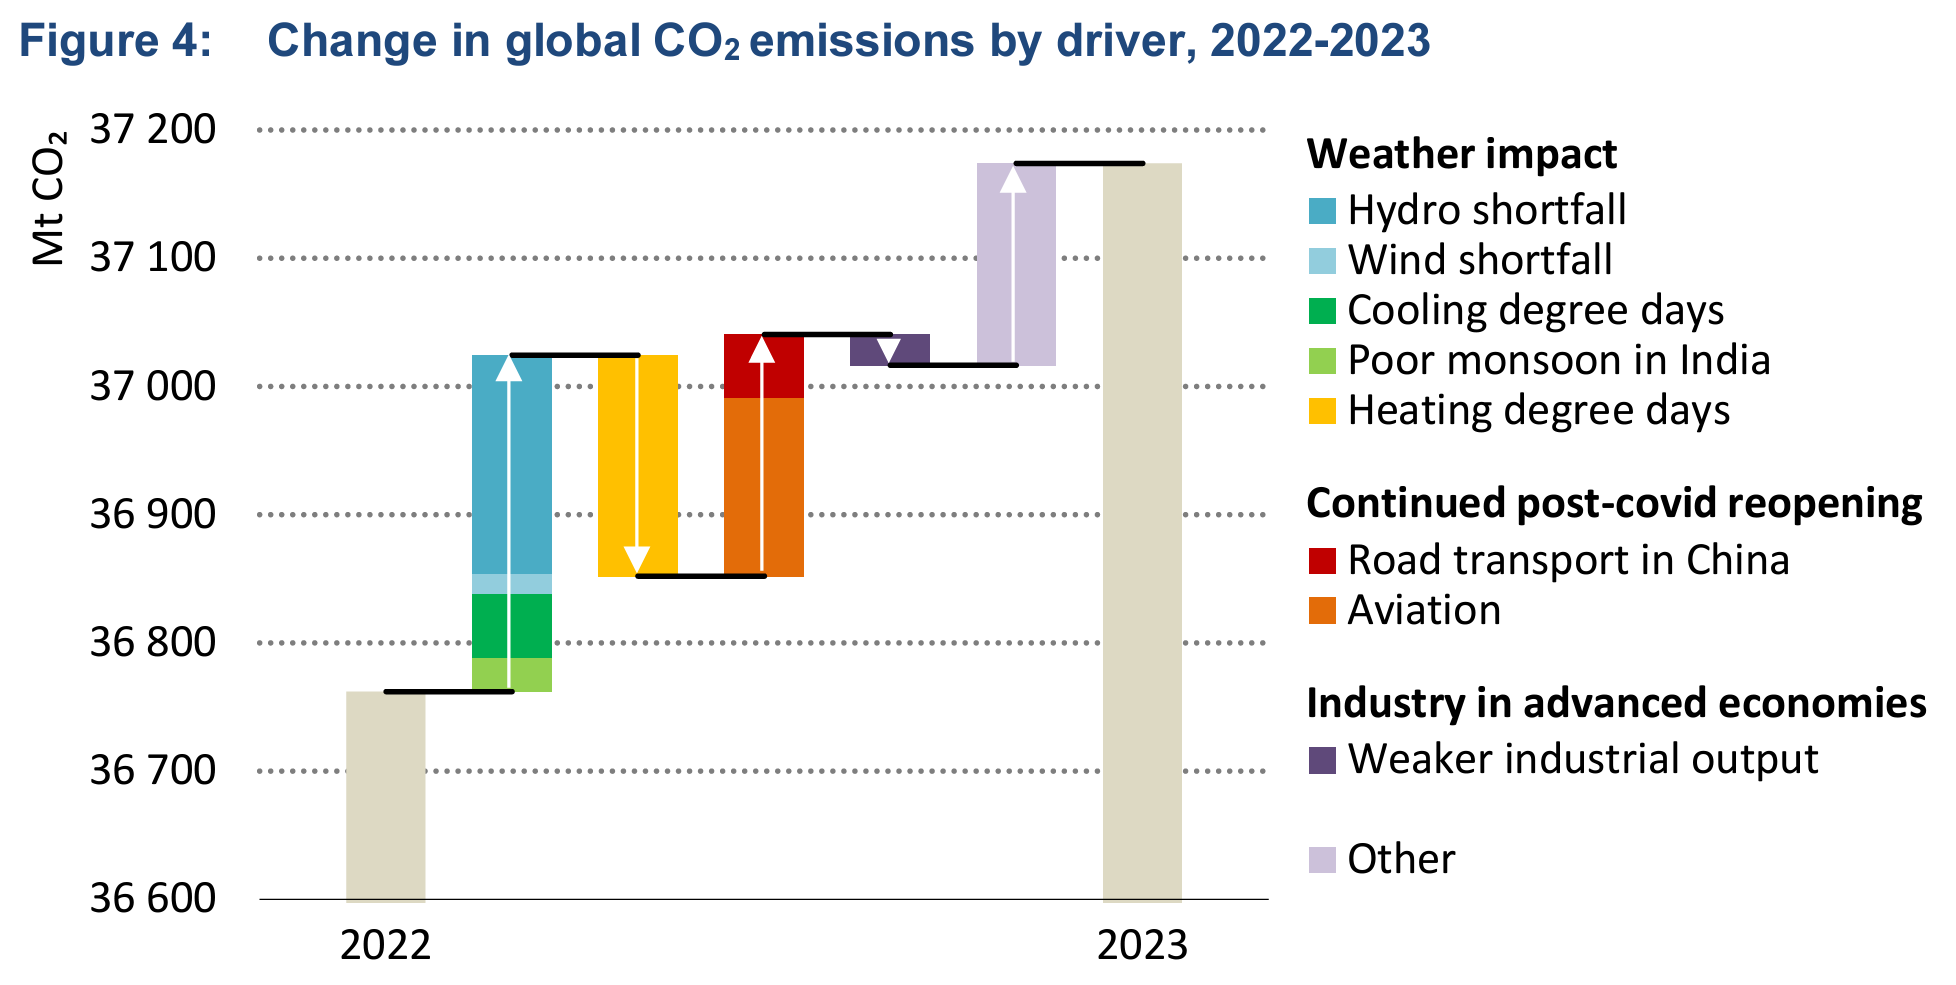
Weather and continued Covid-19 reopening effects played an important role in the emissions increase
The following sections outline a series of factors – both positive and negative – that shaped the change in CO2 emissions between 2022 and 2023. In summary, the cumulative net impact of these effects accounts for nearly two-thirds of the overall increase in emissions, or around 255 Mt CO2 of the 410 Mt of observed increase.
Temperature
Temperatures have significant impacts on energy sector emissions, by affecting energy demand for heating and cooling. 2023 was the hottest year on record. However, 2022 was also marked by extremely high temperatures in major regions with high ownership rates of air conditioning. 2023 was hot globally, but 2022 was hotter or just as hot in the regions accounting for a large share of global energy demand for air conditioning. The increase in emissions from more cooling demand globally in 2023 was therefore relatively small, at around 50 Mt CO2.
In contrast, 2023 saw much milder winter conditions compared to 2022 in countries with large energy demand for heating, notably the United States and the People’s Republic of China (hereinafter China). This significantly reduced energy demand for heating, saving emissions equivalent to 170 Mt CO2. Globally, considering the net effects of moderately higher energy demand for cooling and much lower energy demand for heating, temperatures reduced emissions by around 120 Mt CO2 in 2023.
Precipitation
Global hydropower capacity increased by around 20 GW in 2023. Despite this increase, the global generation of hydropower saw a record decline in 2023. This was primarily driven by severe and prolonged droughts that impacted major hydropower regions, exacerbated by the influence of El Niño. Had the availability of the hydropower plant fleet in 2023 remained consistent with 2022 levels, an additional 200 TWh of electricity would have been generated globally. This would have avoided the emission of around 170 million Mt CO2 from fossil fuel-based power plants. It would also have meant that electricity sector emissions would have fallen globally in 2023, instead of rising moderately.
China experienced a challenging period of 12 consecutive months of belowaverage rainfall from the middle of 2022 to the middle of 2023; the deficit was particularly severe during the second half of 2022. Even as rainfall gradually recovered over the course of 2023, additional water inflow was primarily utilised to refill hydro reservoirs rather than for electricity production. This meant that although the worst of the precipitation deficit was seen in the second half of 2022, the impact on hydropower output was only seen in 2023. In 2023, China’s hydropower generation fell around 4.9%, the worst decline in the last twenty years. China’s hydropower generation would have been 125 TWh higher in 2023 if its hydropower fleet availability had been the same as in 2022. China’s hydropower shortfall accounted for nearly two-thirds of the global deficit in hydropower generation in 2023. [more]