By Rajesh Kumar Singh, Piyush Nagpal, and Sibi Arasu 19 June 2023 BALLIA, India (AP News) – A scorching heat wave in two of India’s most populous states has overwhelmed hospitals, filled a morgue to capacity and disrupted power supply, forcing staff to use books to cool patients, as officials investigate the number of deaths that […]
By Nahal Toosi 18 June 2023 OSLO, Norway (POLITICO) – Gatherings of human rights activists tend to feature commitments to the cause mixed with a lot of gallows humor — after all, many such advocates have survived and persisted in their roles despite imprisonment, torture and surveillance by authoritarian regimes. But on a sunlit June […]
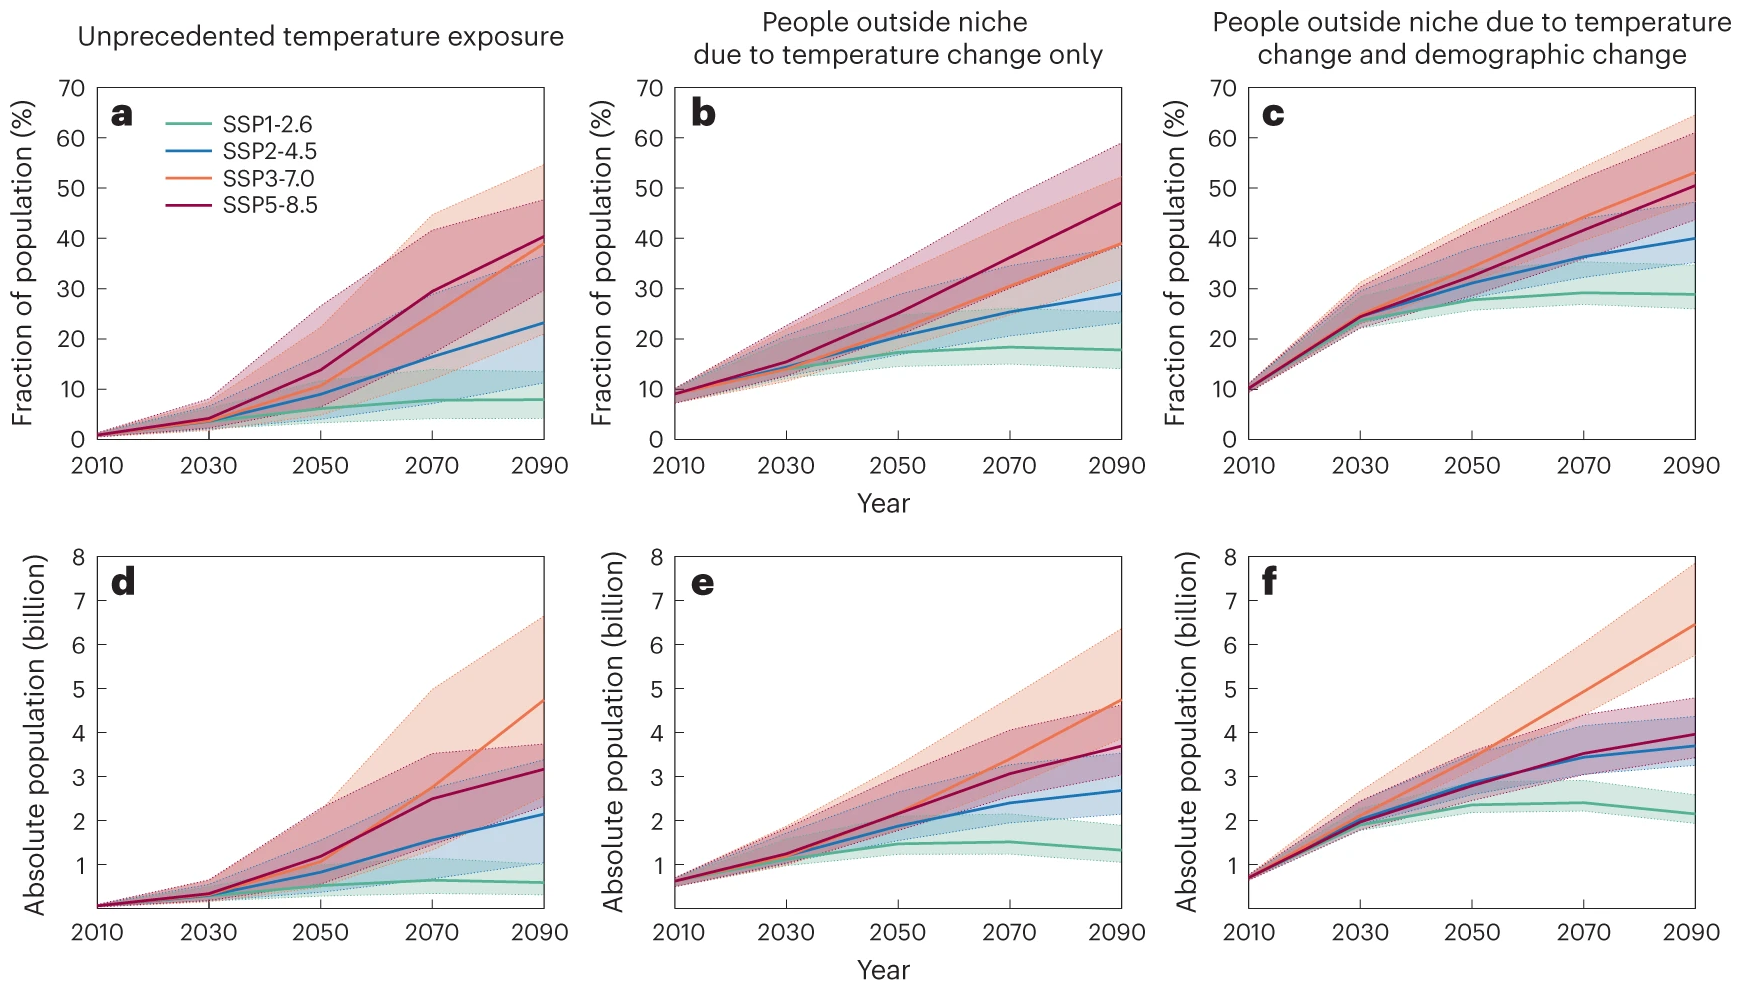
By Alex Morrison 22 May 2023 (University of Exeter) – Current climate policies will leave more than a fifth of humanity exposed to dangerously hot temperatures by 2100, new research suggests. Despite the Paris Agreement pledge to keep global warming well below 2°C (compared to pre-industrial levels), current policies are projected to result in 2.7°C warming by the […]
3 May 2023 (RSF) – According to the 2023 World Press Freedom Index – which evaluates the environment for journalism in 180 countries and territories and is published on World Press Freedom Day (3 May) – the situation is “very serious” in 31 countries, “difficult” in 42, “problematic” in 55, and “good” or “satisfactory” in 52 countries. In […]
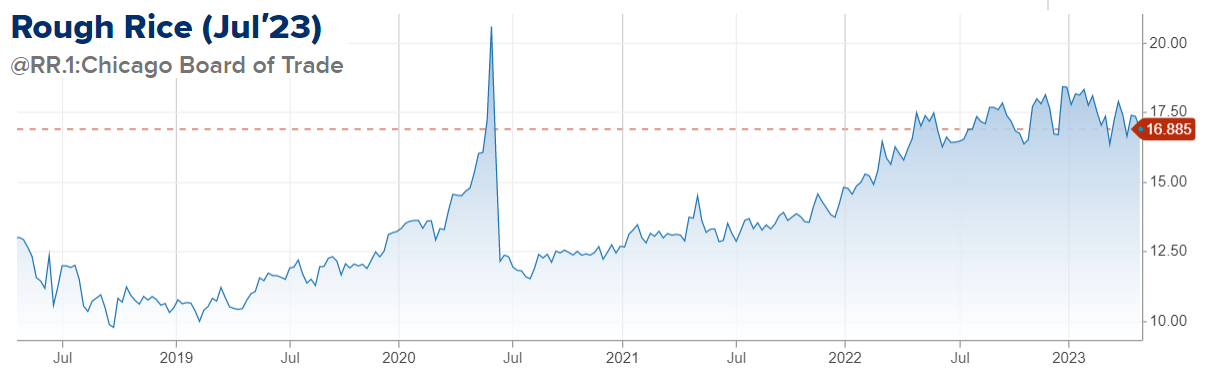
By Lee Ying Shan 18 April 2023 (CNBC) – From China to the U.S. to the European Union, rice production is falling and driving up prices for more than 3.5 billion people across the globe, particularly in Asia-Pacific – which consumes 90% of the world’s rice. The global rice market is set to log its largest […]
By Dan Stillman 17 April 2023 (The Washington Post) – Numerous heat records have been broken across Southeast Asia, China and other parts of the continent in recent days as the region remains in the grip of a dangerously scorching heat wave, with Thailand in particular experiencing unusually extreme conditions. Weather historian Maximiliano Herrera is describing […]
By Pandora Dewan 24 February 2023 (Newsweek) – By 2100, Florida could see sea levels rise by up to 6 feet, with over 900,000 properties at risk of being underwater. “By 2050, Florida sea levels, like much of the US, are headed for a 1-foot rise on average (above 2020 levels),” William Sweet, an Oceanographer for the […]
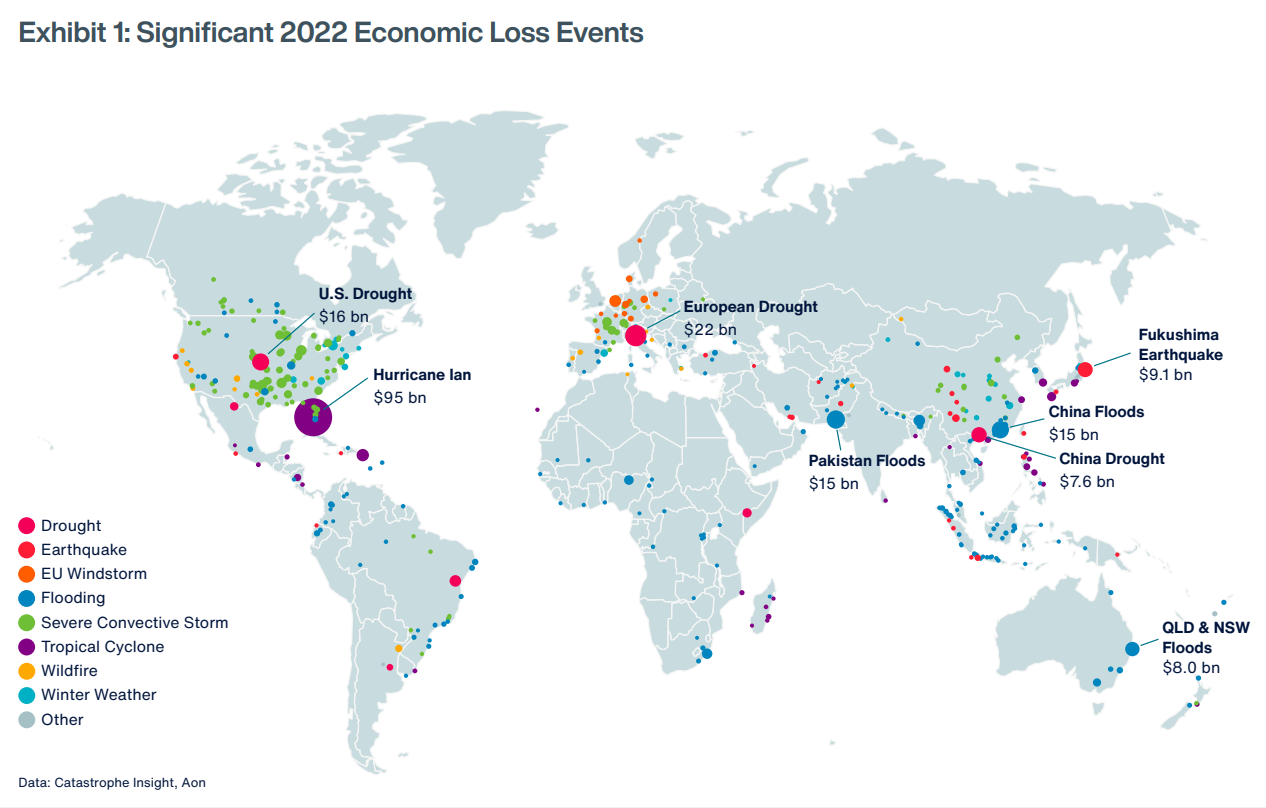
CHICAGO, 25 January 2023 (PRNewswire) – Aon plc (NYSE: AON), a leading global professional services firm, today published its 2023 Weather, Climate and Catastrophe Insight report, which identifies global natural disaster and climate trends to help make better decisions to manage volatility and enhance global resilience. The report reveals that natural disasters caused a $313 billion global economic loss […]
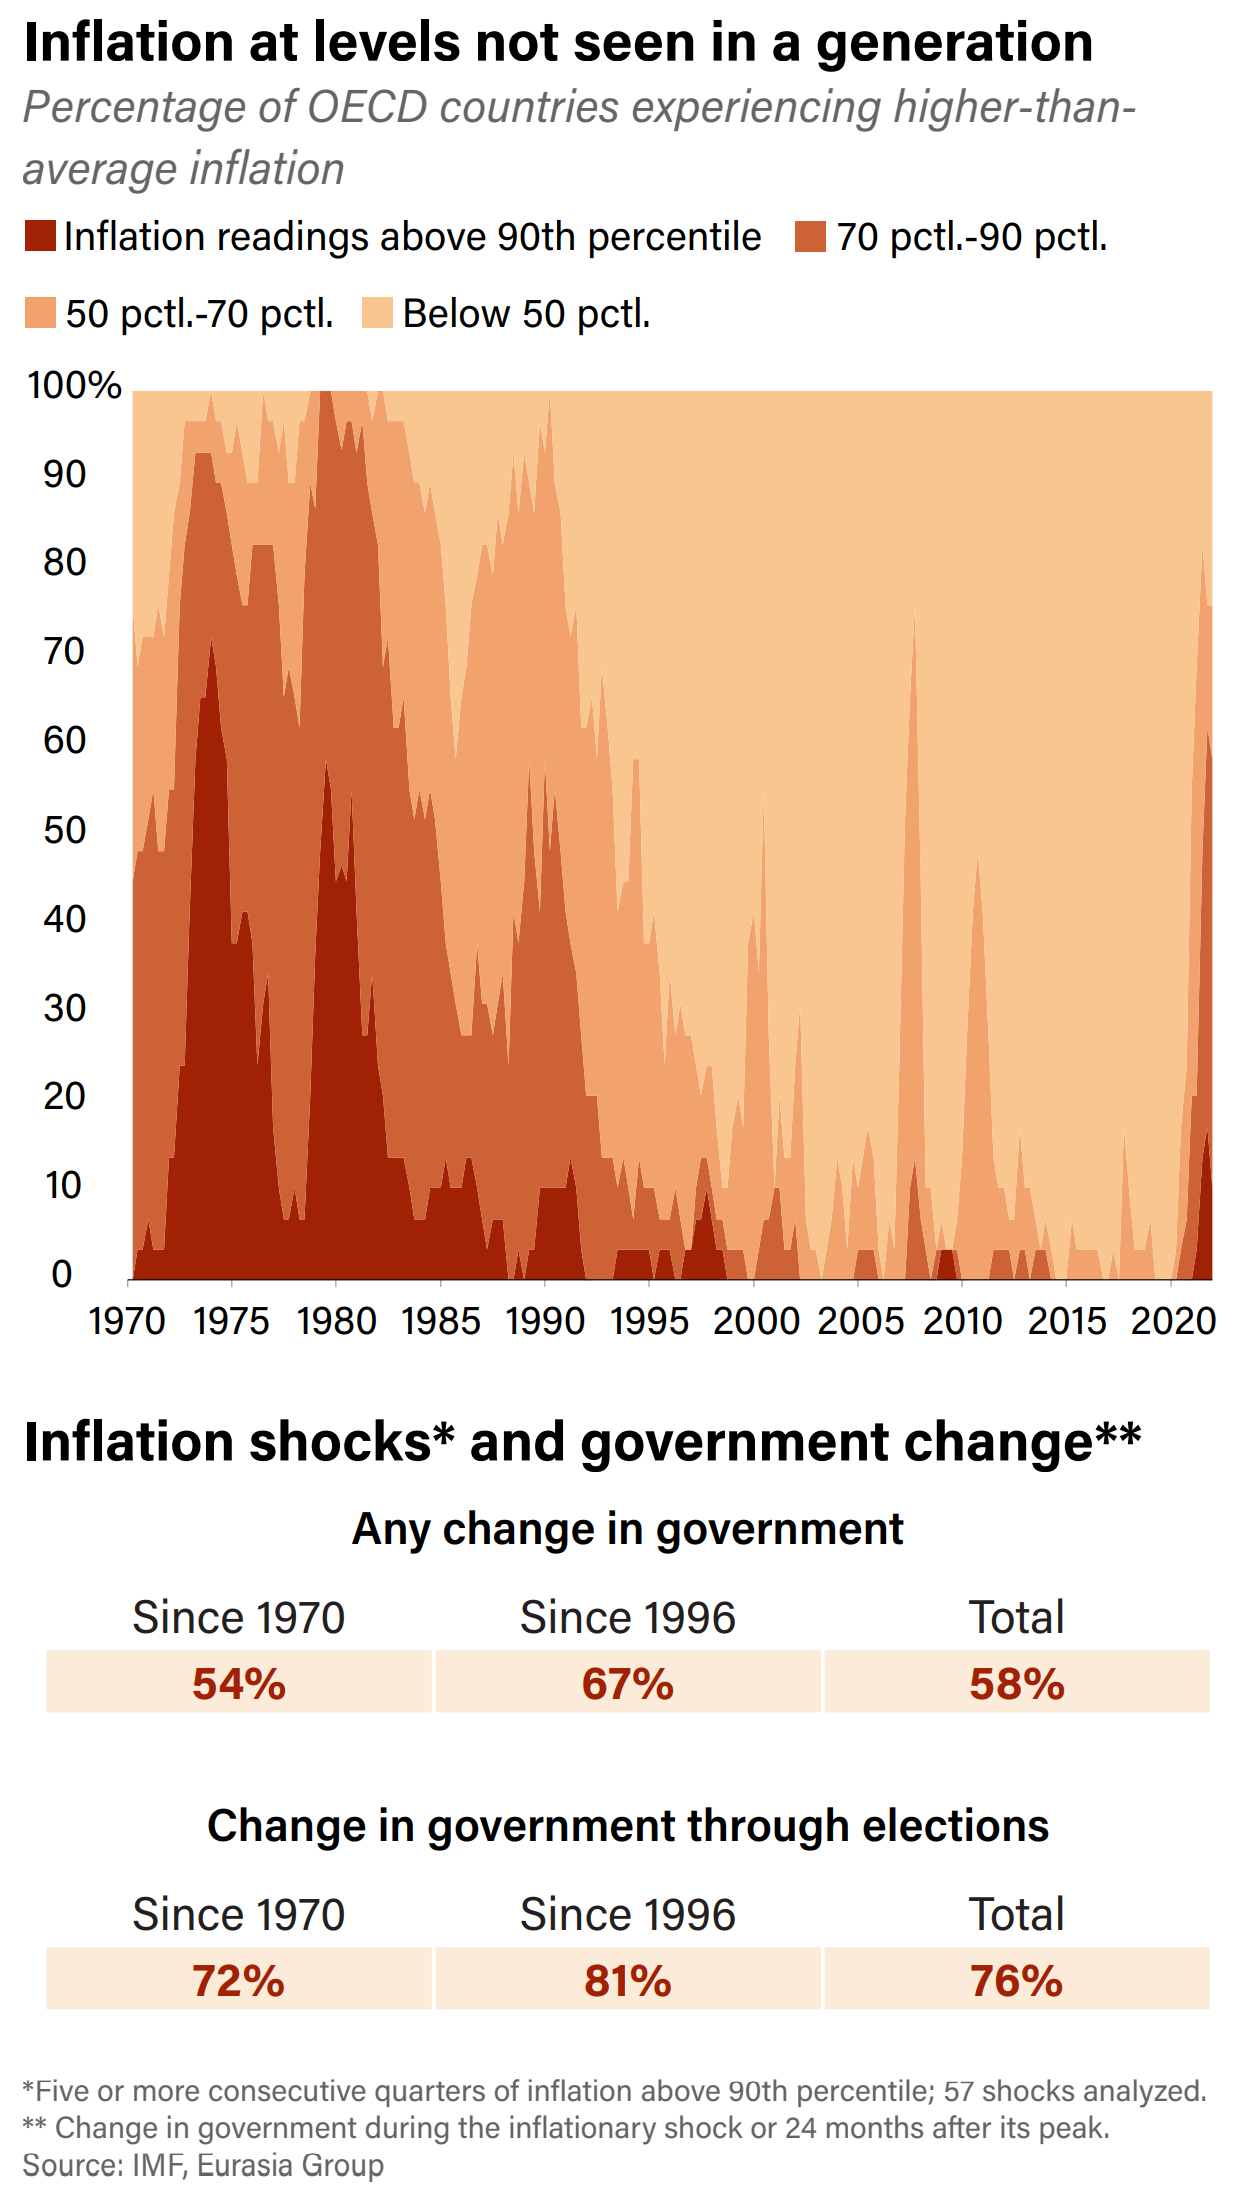
By Ian Bremmer and Cliff Kupchan 3 January 2023 (Eurasia Group) – Russia has no way to win in Ukraine. The European Union is stronger than ever. NATO rediscovered its reason for being. The G7 is strengthening. Renewables are becoming dirt cheap. American hard power remains unrivaled. Midterms in the United States were decidedly normal […]
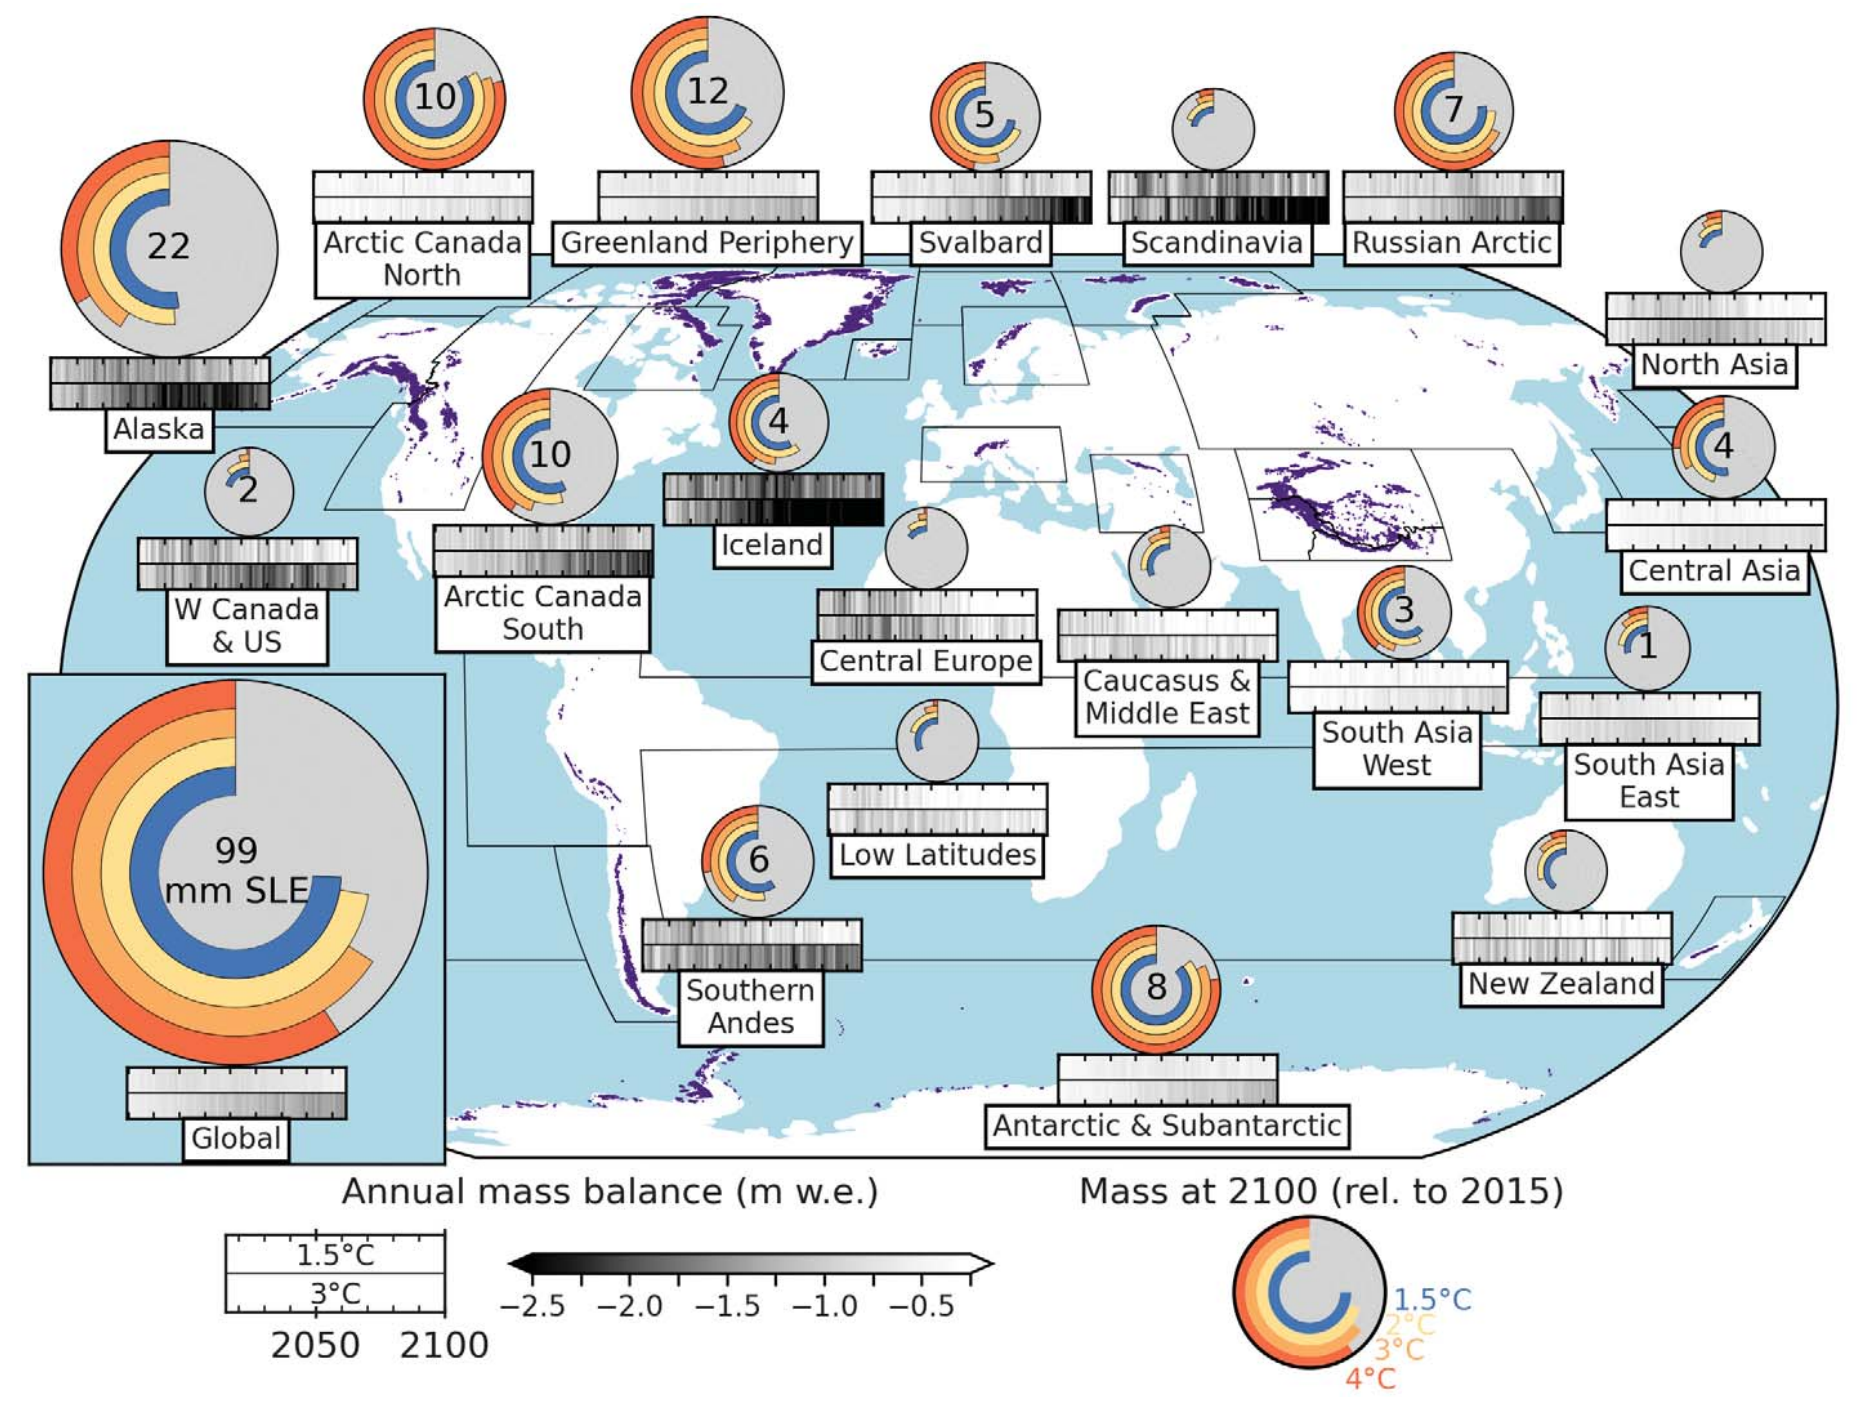
By Phoebe Weston 5 January 2023 (The Guardian) – Half the planet’s glaciers will have melted by 2100 even if humanity sticks to goals set out in the Paris climate agreement, according to research that finds the scale and impacts of glacial loss are greater than previously thought. At least half of that loss will happen […]