30 September 2024 (World Bank) – Domestic food price inflation remains high in many low- and middle-income countries. Inflation higher than 5 percent is experienced in 77.3 percent of low-income countries (18.2 percentage points higher since the last Update on June 27, 2024), 54.3 percent of lower-middle-income countries (8.7 percentage points lower), 44% of upper-middle-income […]
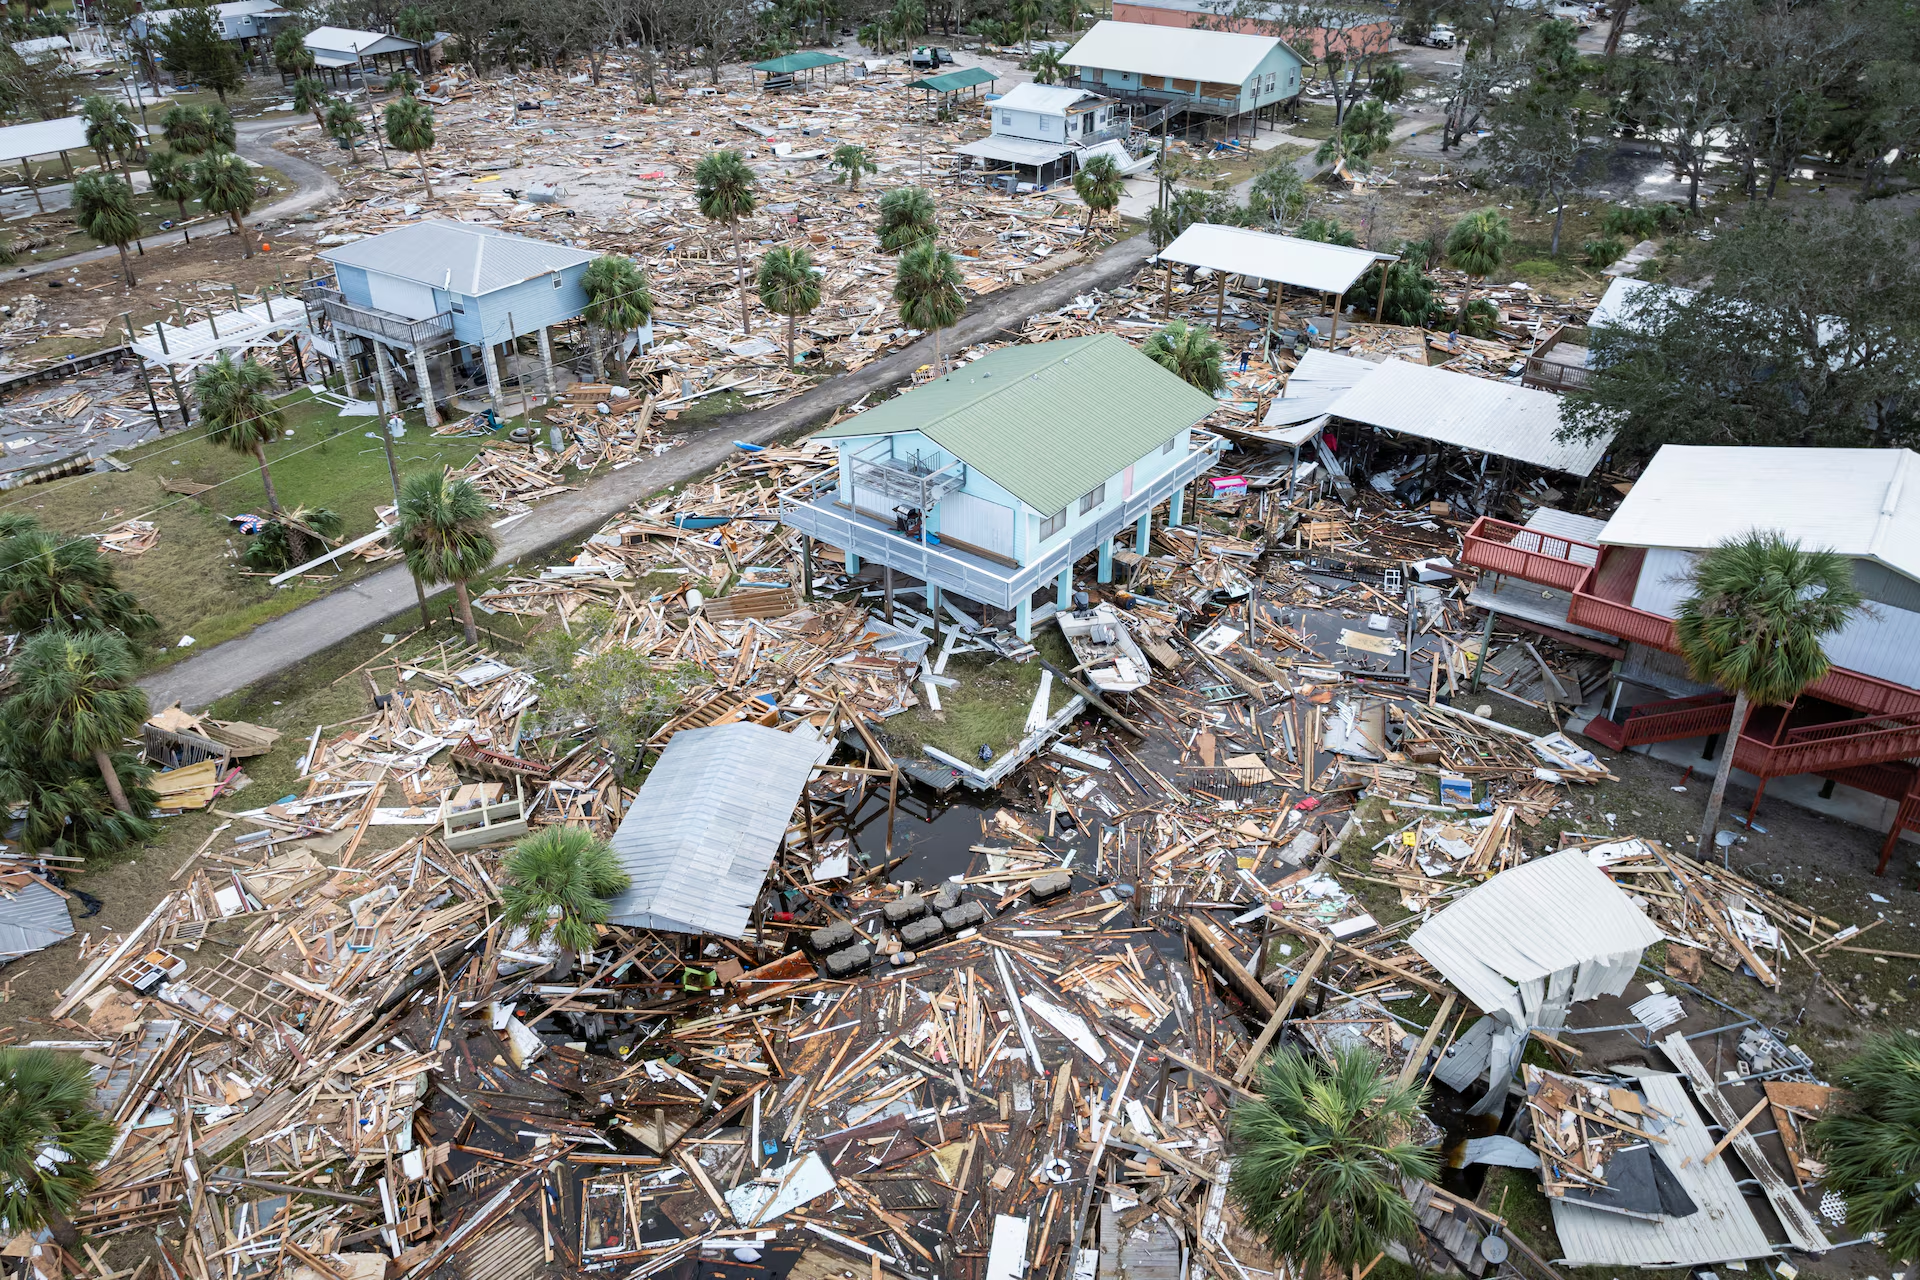
By Abrahm Lustgarten 2 October 2024 (The New York Times) – When Hurricane Helene, the 420-mile-wide, slow-spinning conveyor belt of wind and water drowned part of Florida’s coastline and then barged its path northward through North Carolina last week, it destroyed more than homes and bridges. It shook people’s faith in the safety of living […]
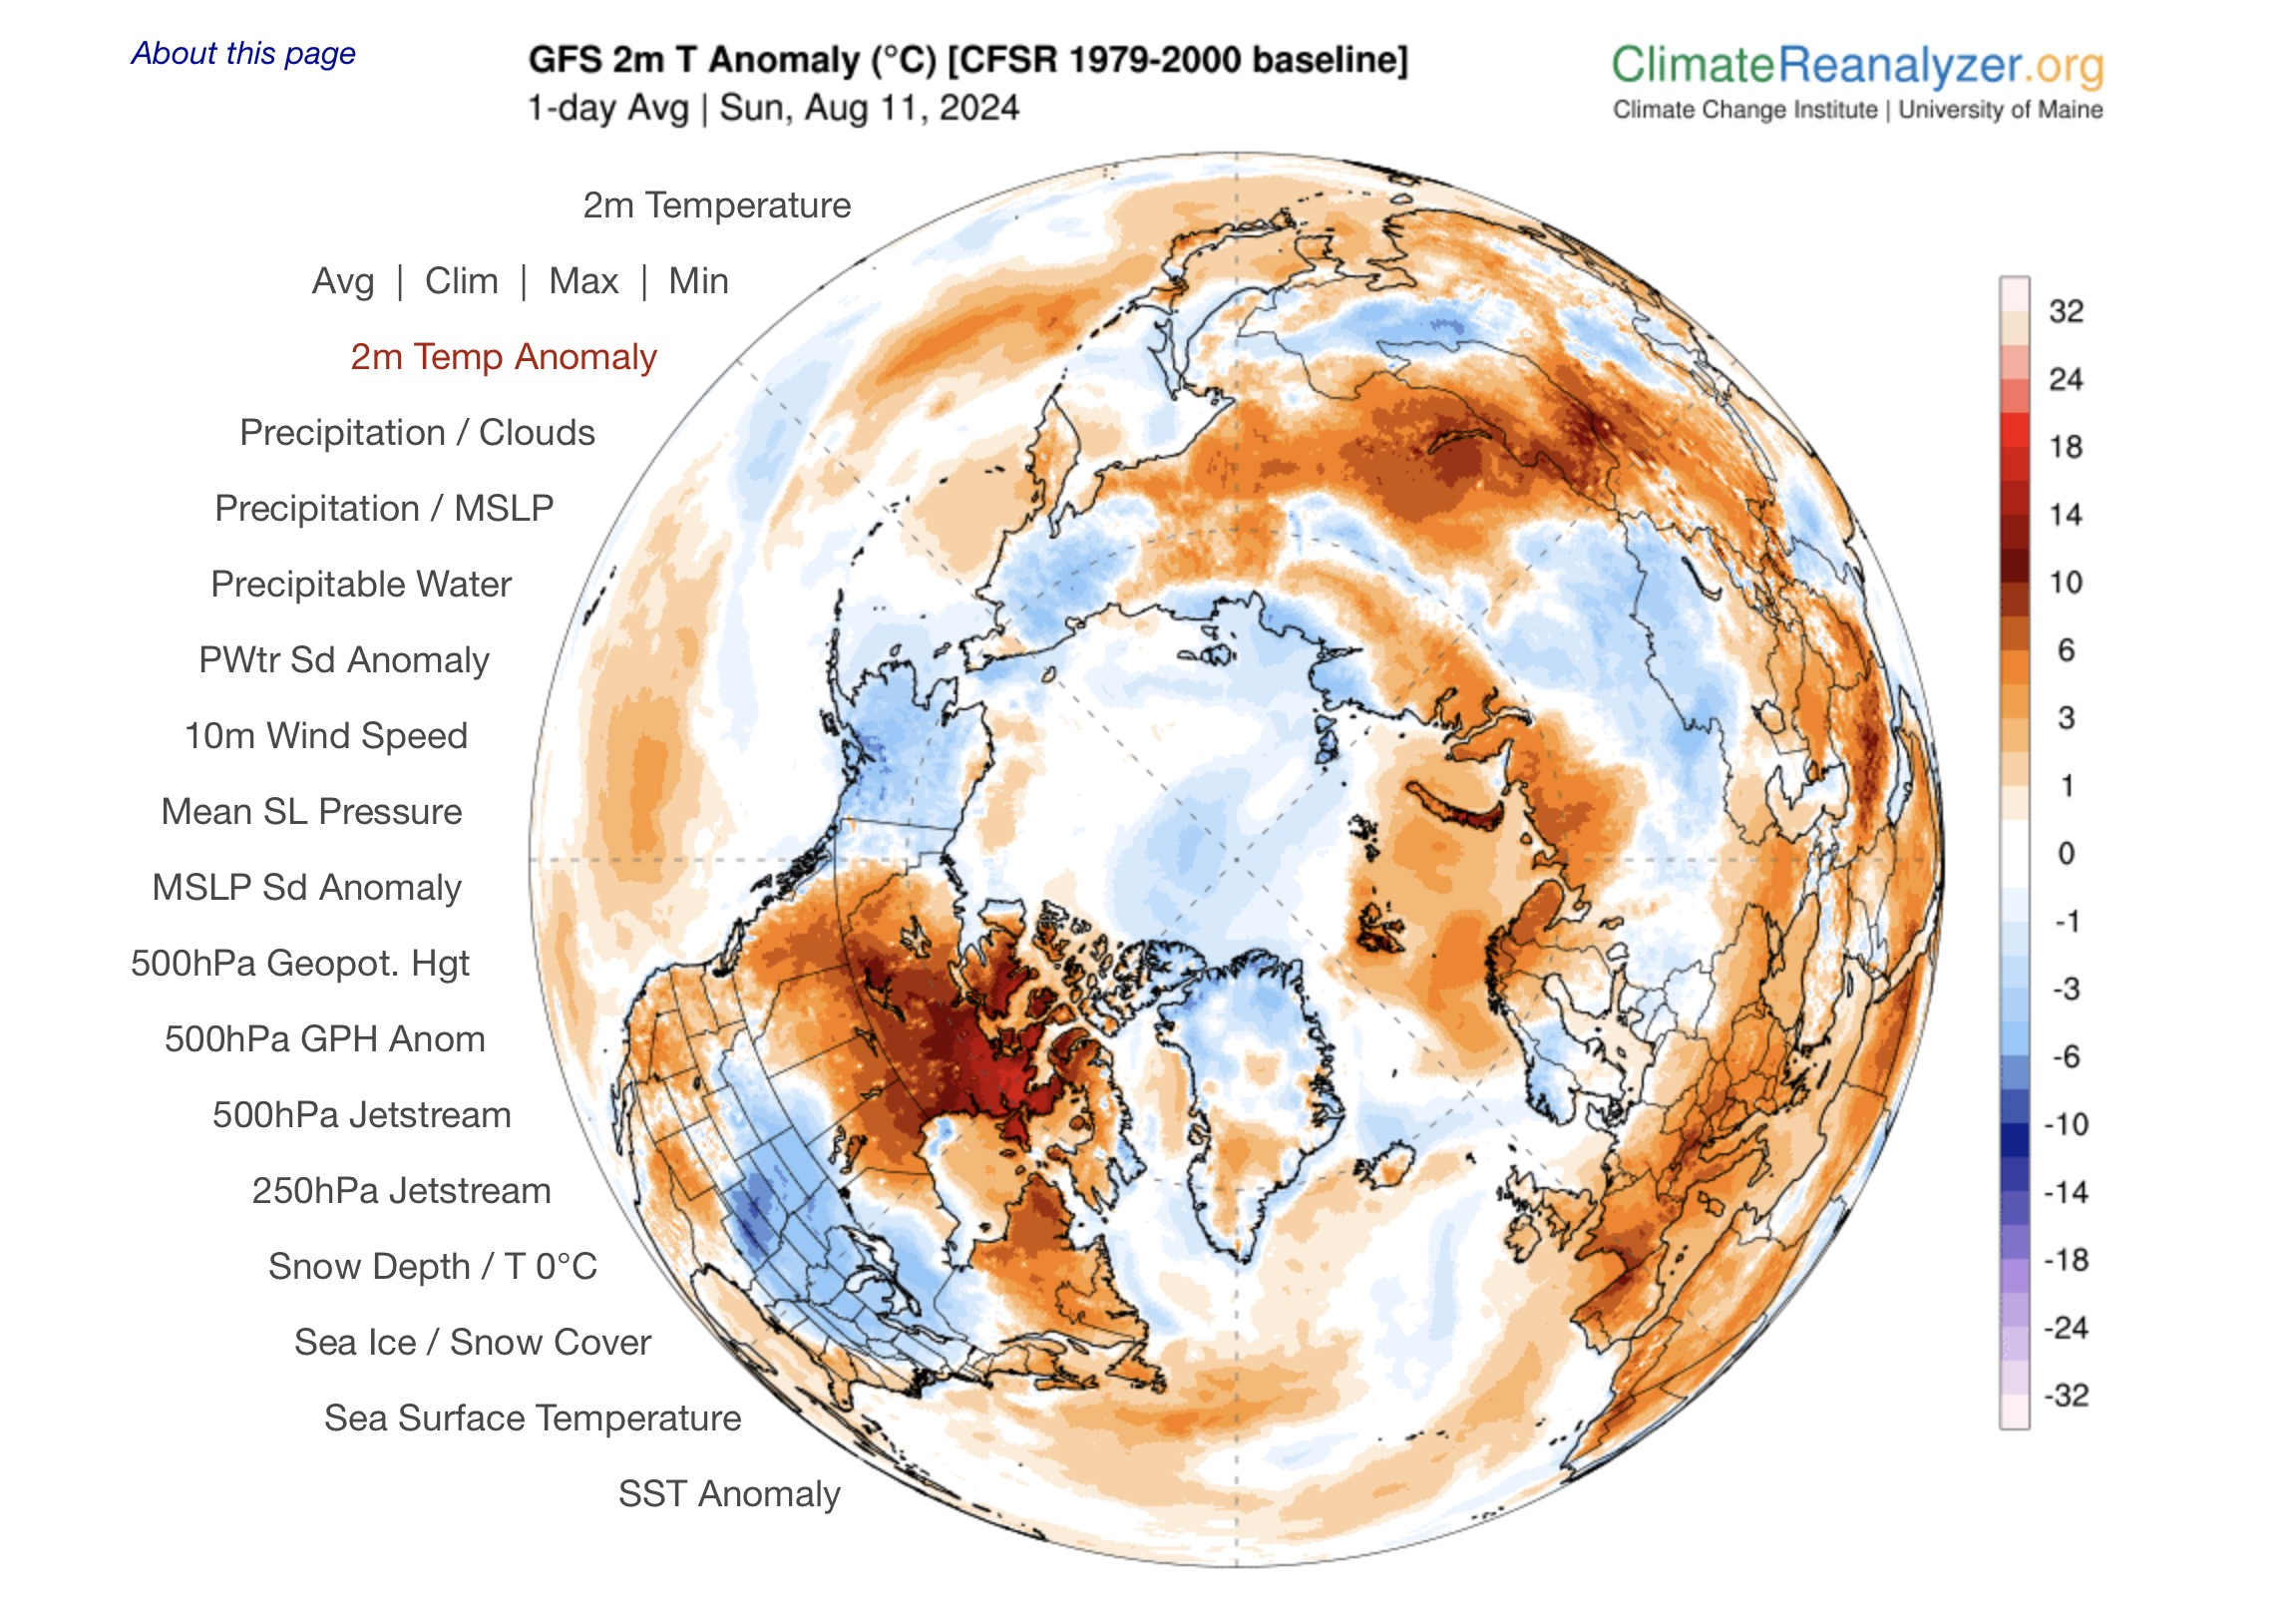
By Jonathan Watts 14 August 2024 (The Guardian) – A record 15 national heat records have been broken since the start of this year, an influential climate historian has told the Guardian, as weather extremes grow more frequent and climate breakdown intensifies. An additional 130 monthly national temperature records have also been broken, along with […]
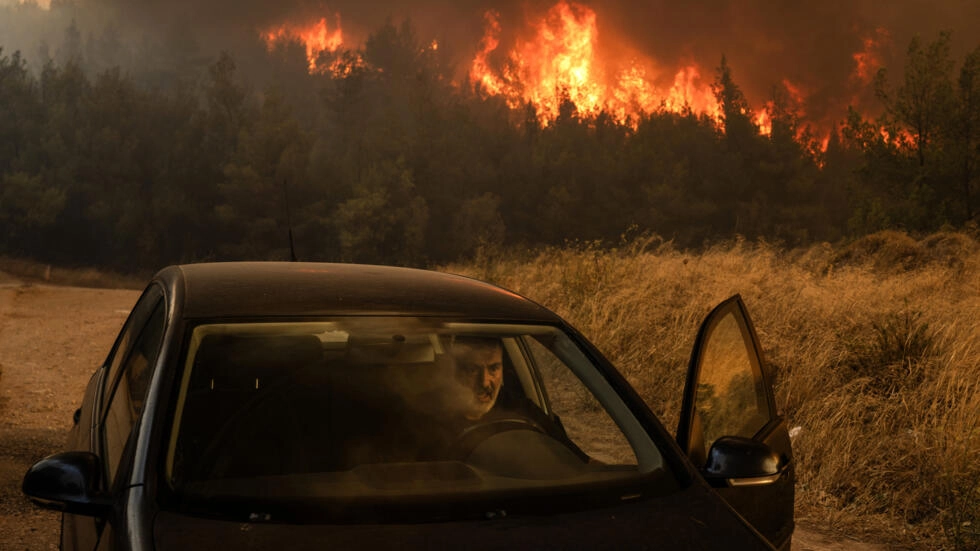
PENTELI, Greece, 12 August 2024 (AFP) – Thick grey smoke engulfed Mount Pentelicus that dominates Athens on Monday as the Greek capital battled the infernal fallout from what promises to be its hottest summer on record. A 30-kilometre (20-mile) long line of fires, some with flames more than 25 metres (80 feet) high, was moving […]
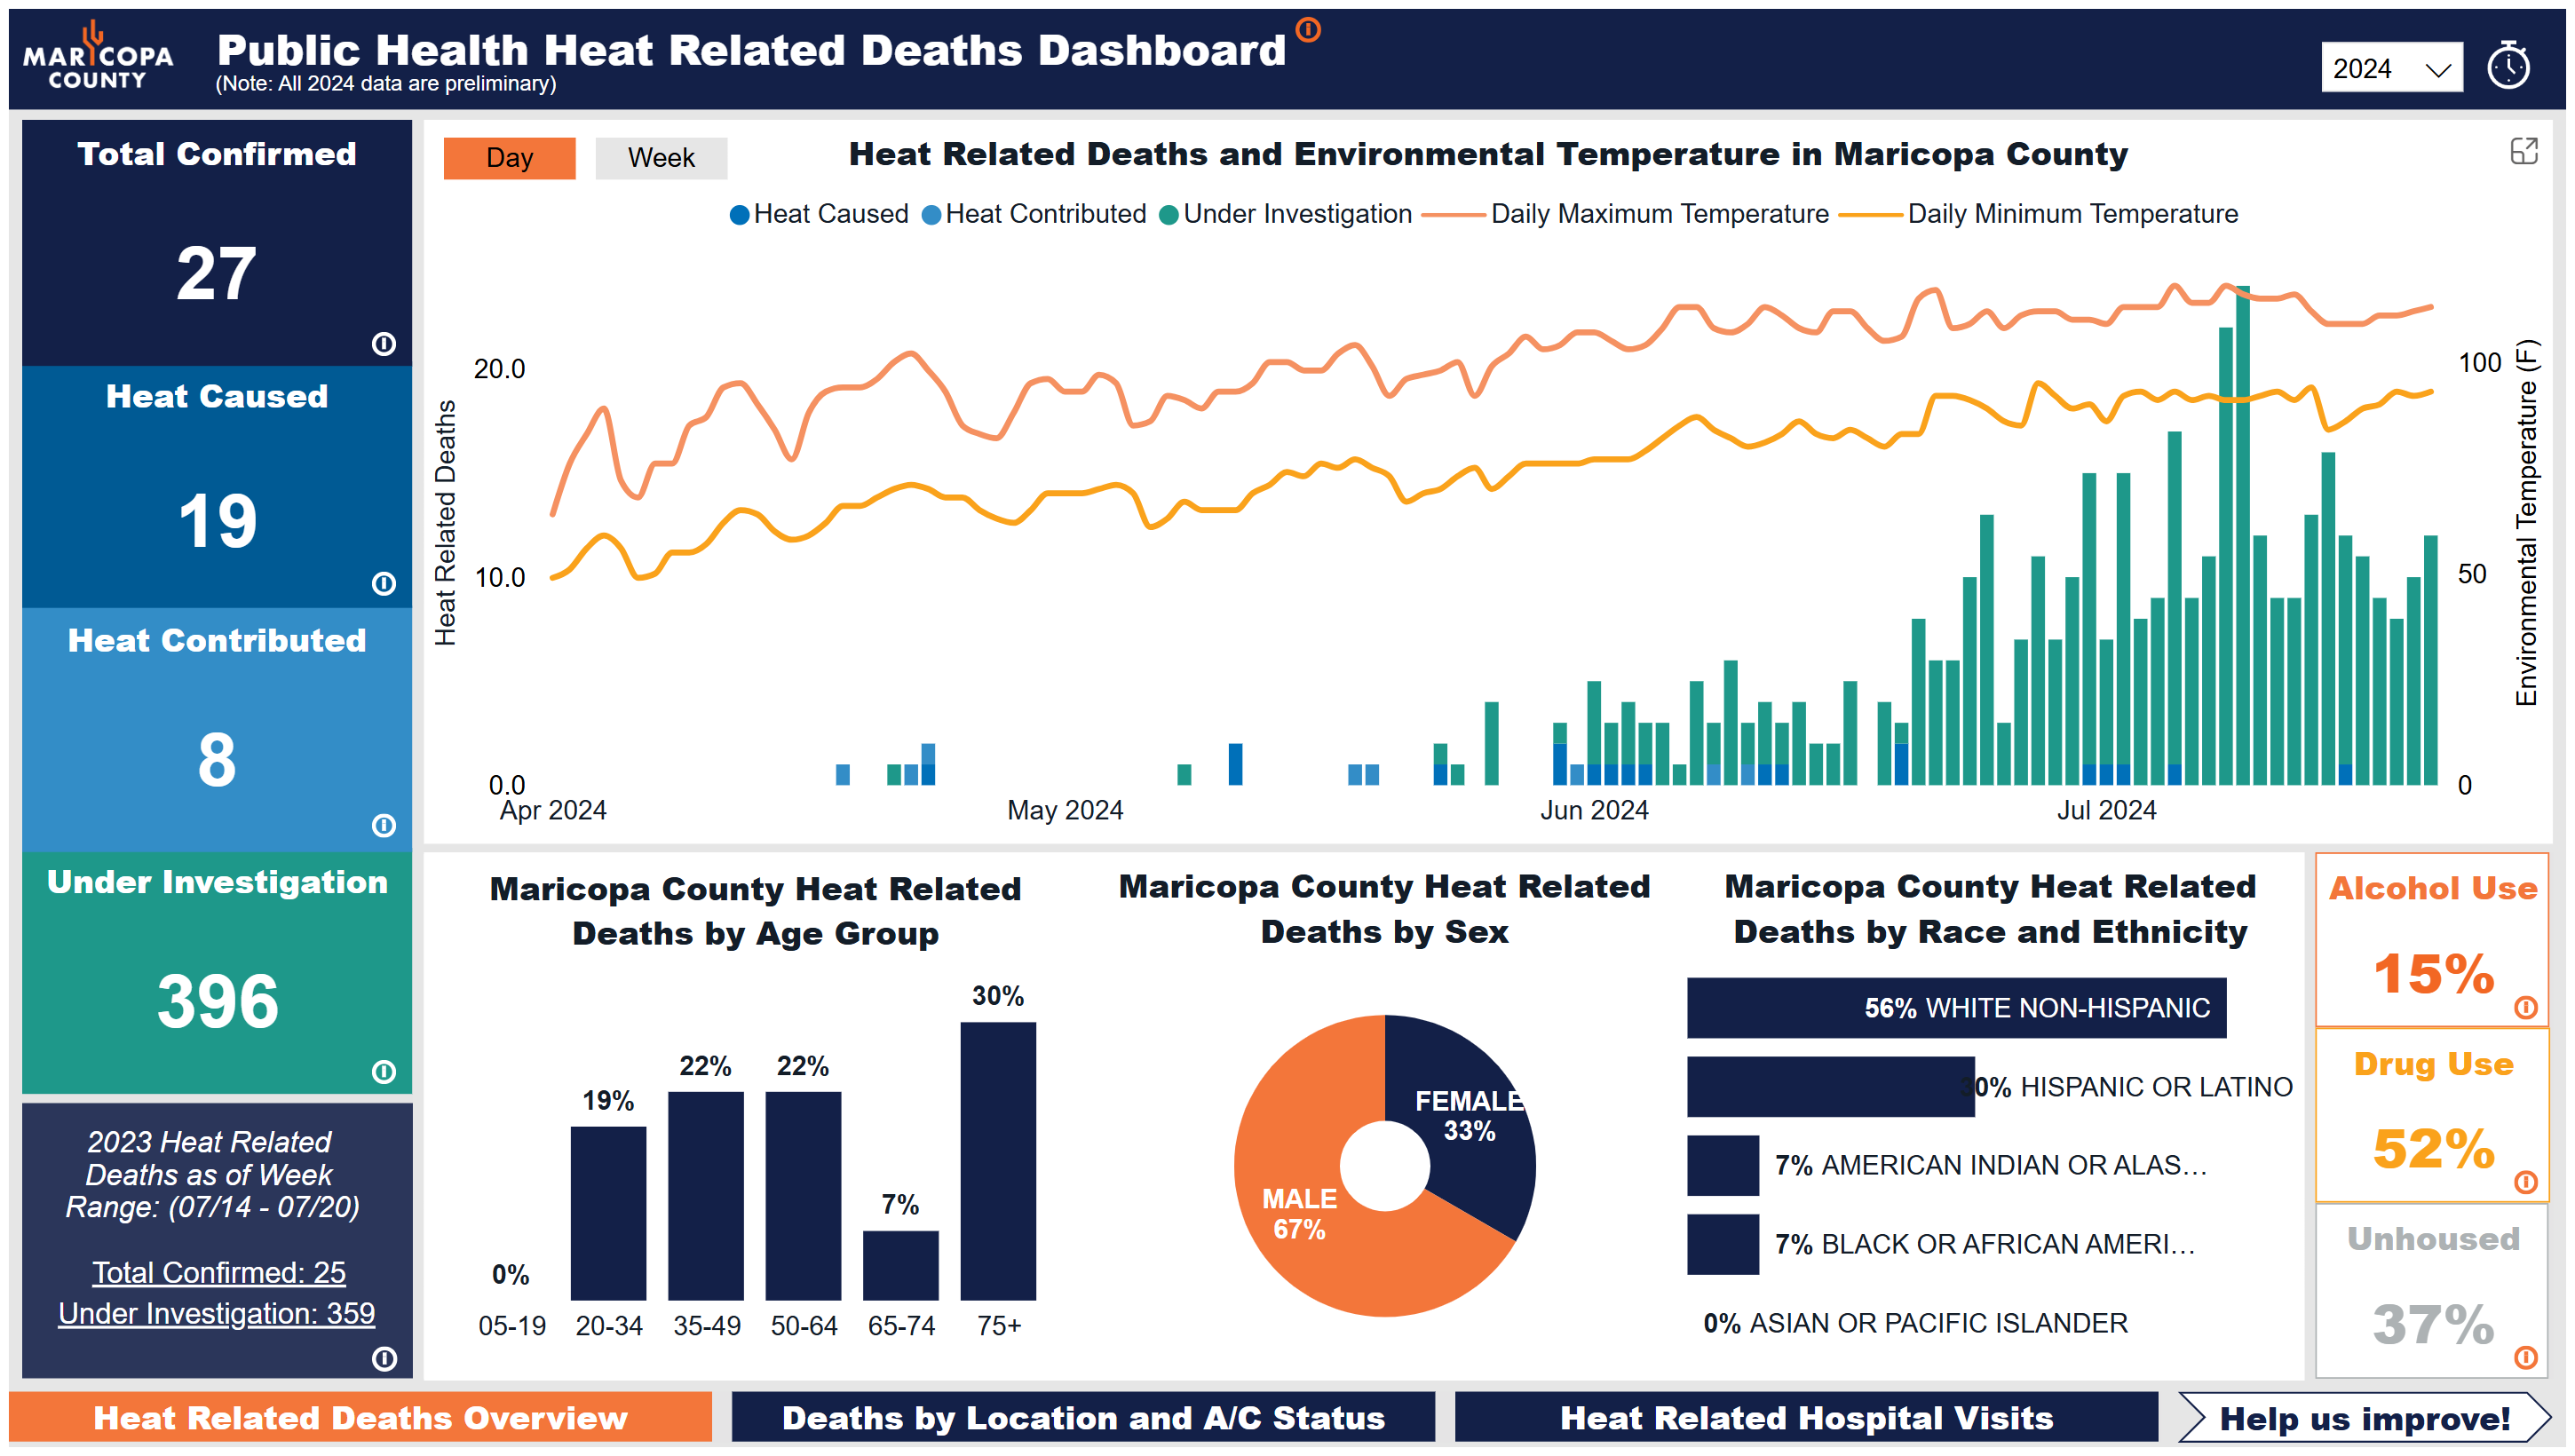
By Rachel Ramirez 24 July 2024 (CNN) – Hundreds of people may have died from heat in Arizona’s Maricopa County amid another record-breaking summer in the state. Heat has killed 27 people in the county, which is home to Phoenix, and is suspected as the cause of 396 other deaths so far this year, according to […]
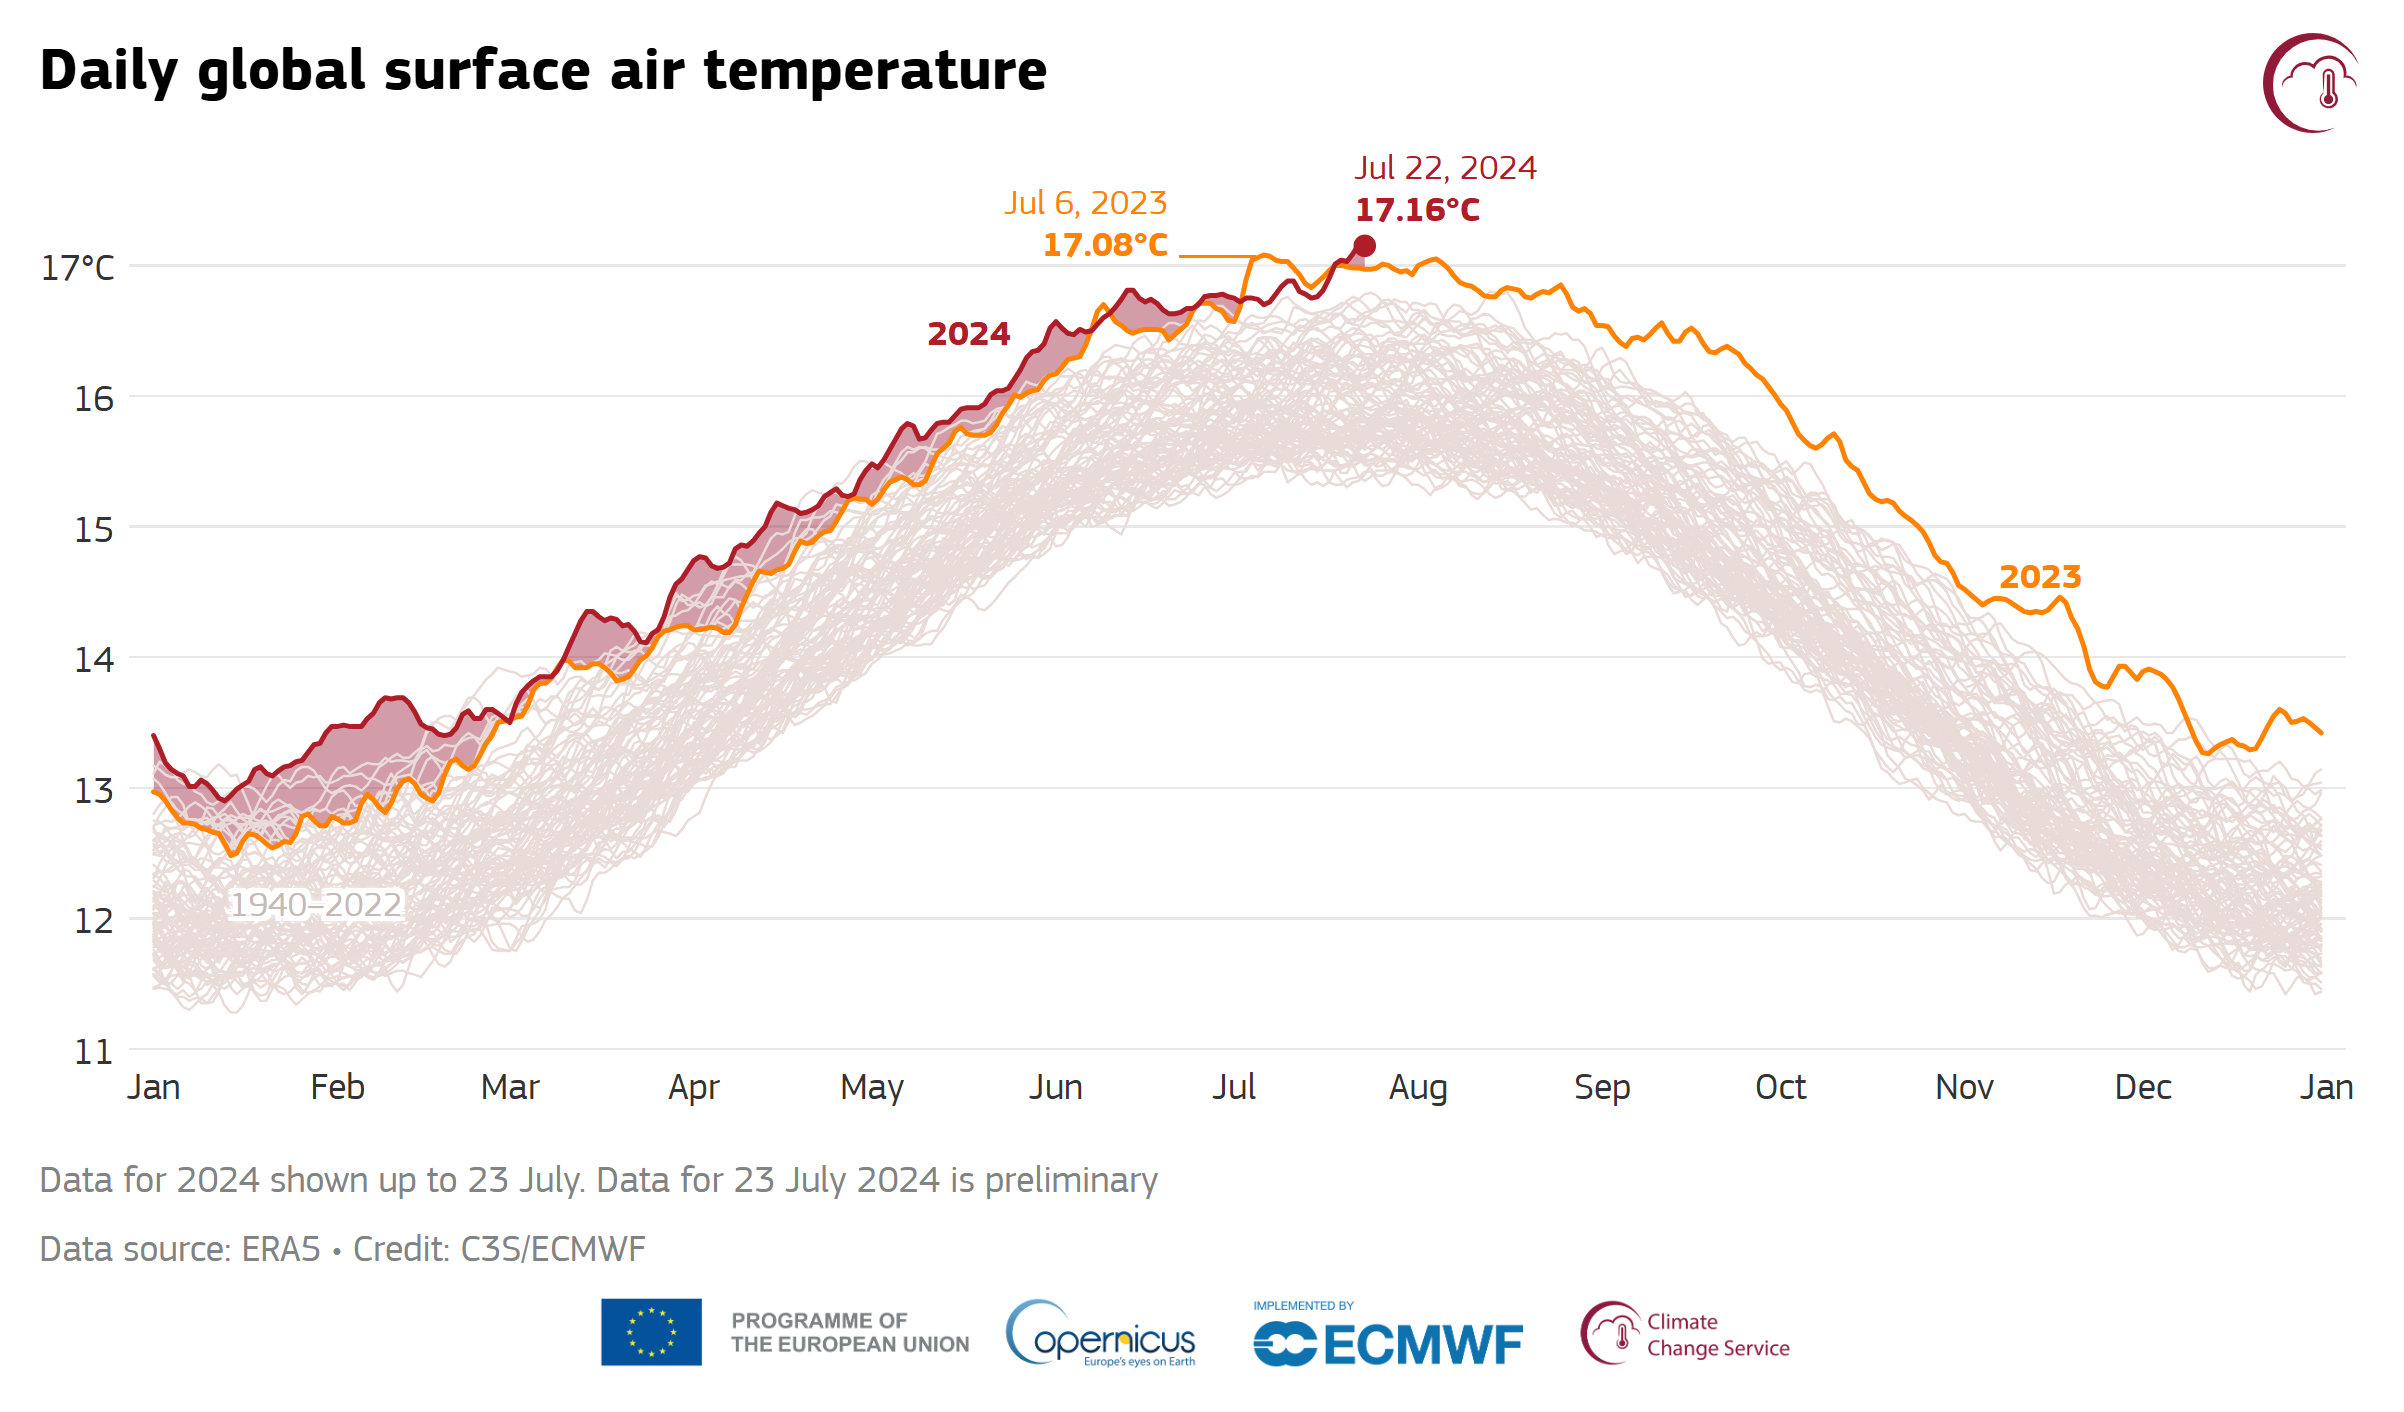
23 July 2024 (Copernicus Climate Change Service) – The Earth has just experienced its warmest day in recent history, according to the Copernicus Climate Change Service (C3S) data. On 22 July 2024, the daily global average temperature reached a new record high in the ERA5 dataset, at 17.16°C. This exceeds the previous records of 17.09°C, […]
By Jules Feeney 27 July 2024 LOS ANGELES (The Guardian) – Oregon’s wildfire season is off to an explosive start with more than 1 million acres charred in less than a month, as experts warn that extreme heat and unusual lightning strikes are creating “catastrophic conditions” for fires to ignite and spread. The state is currently […]
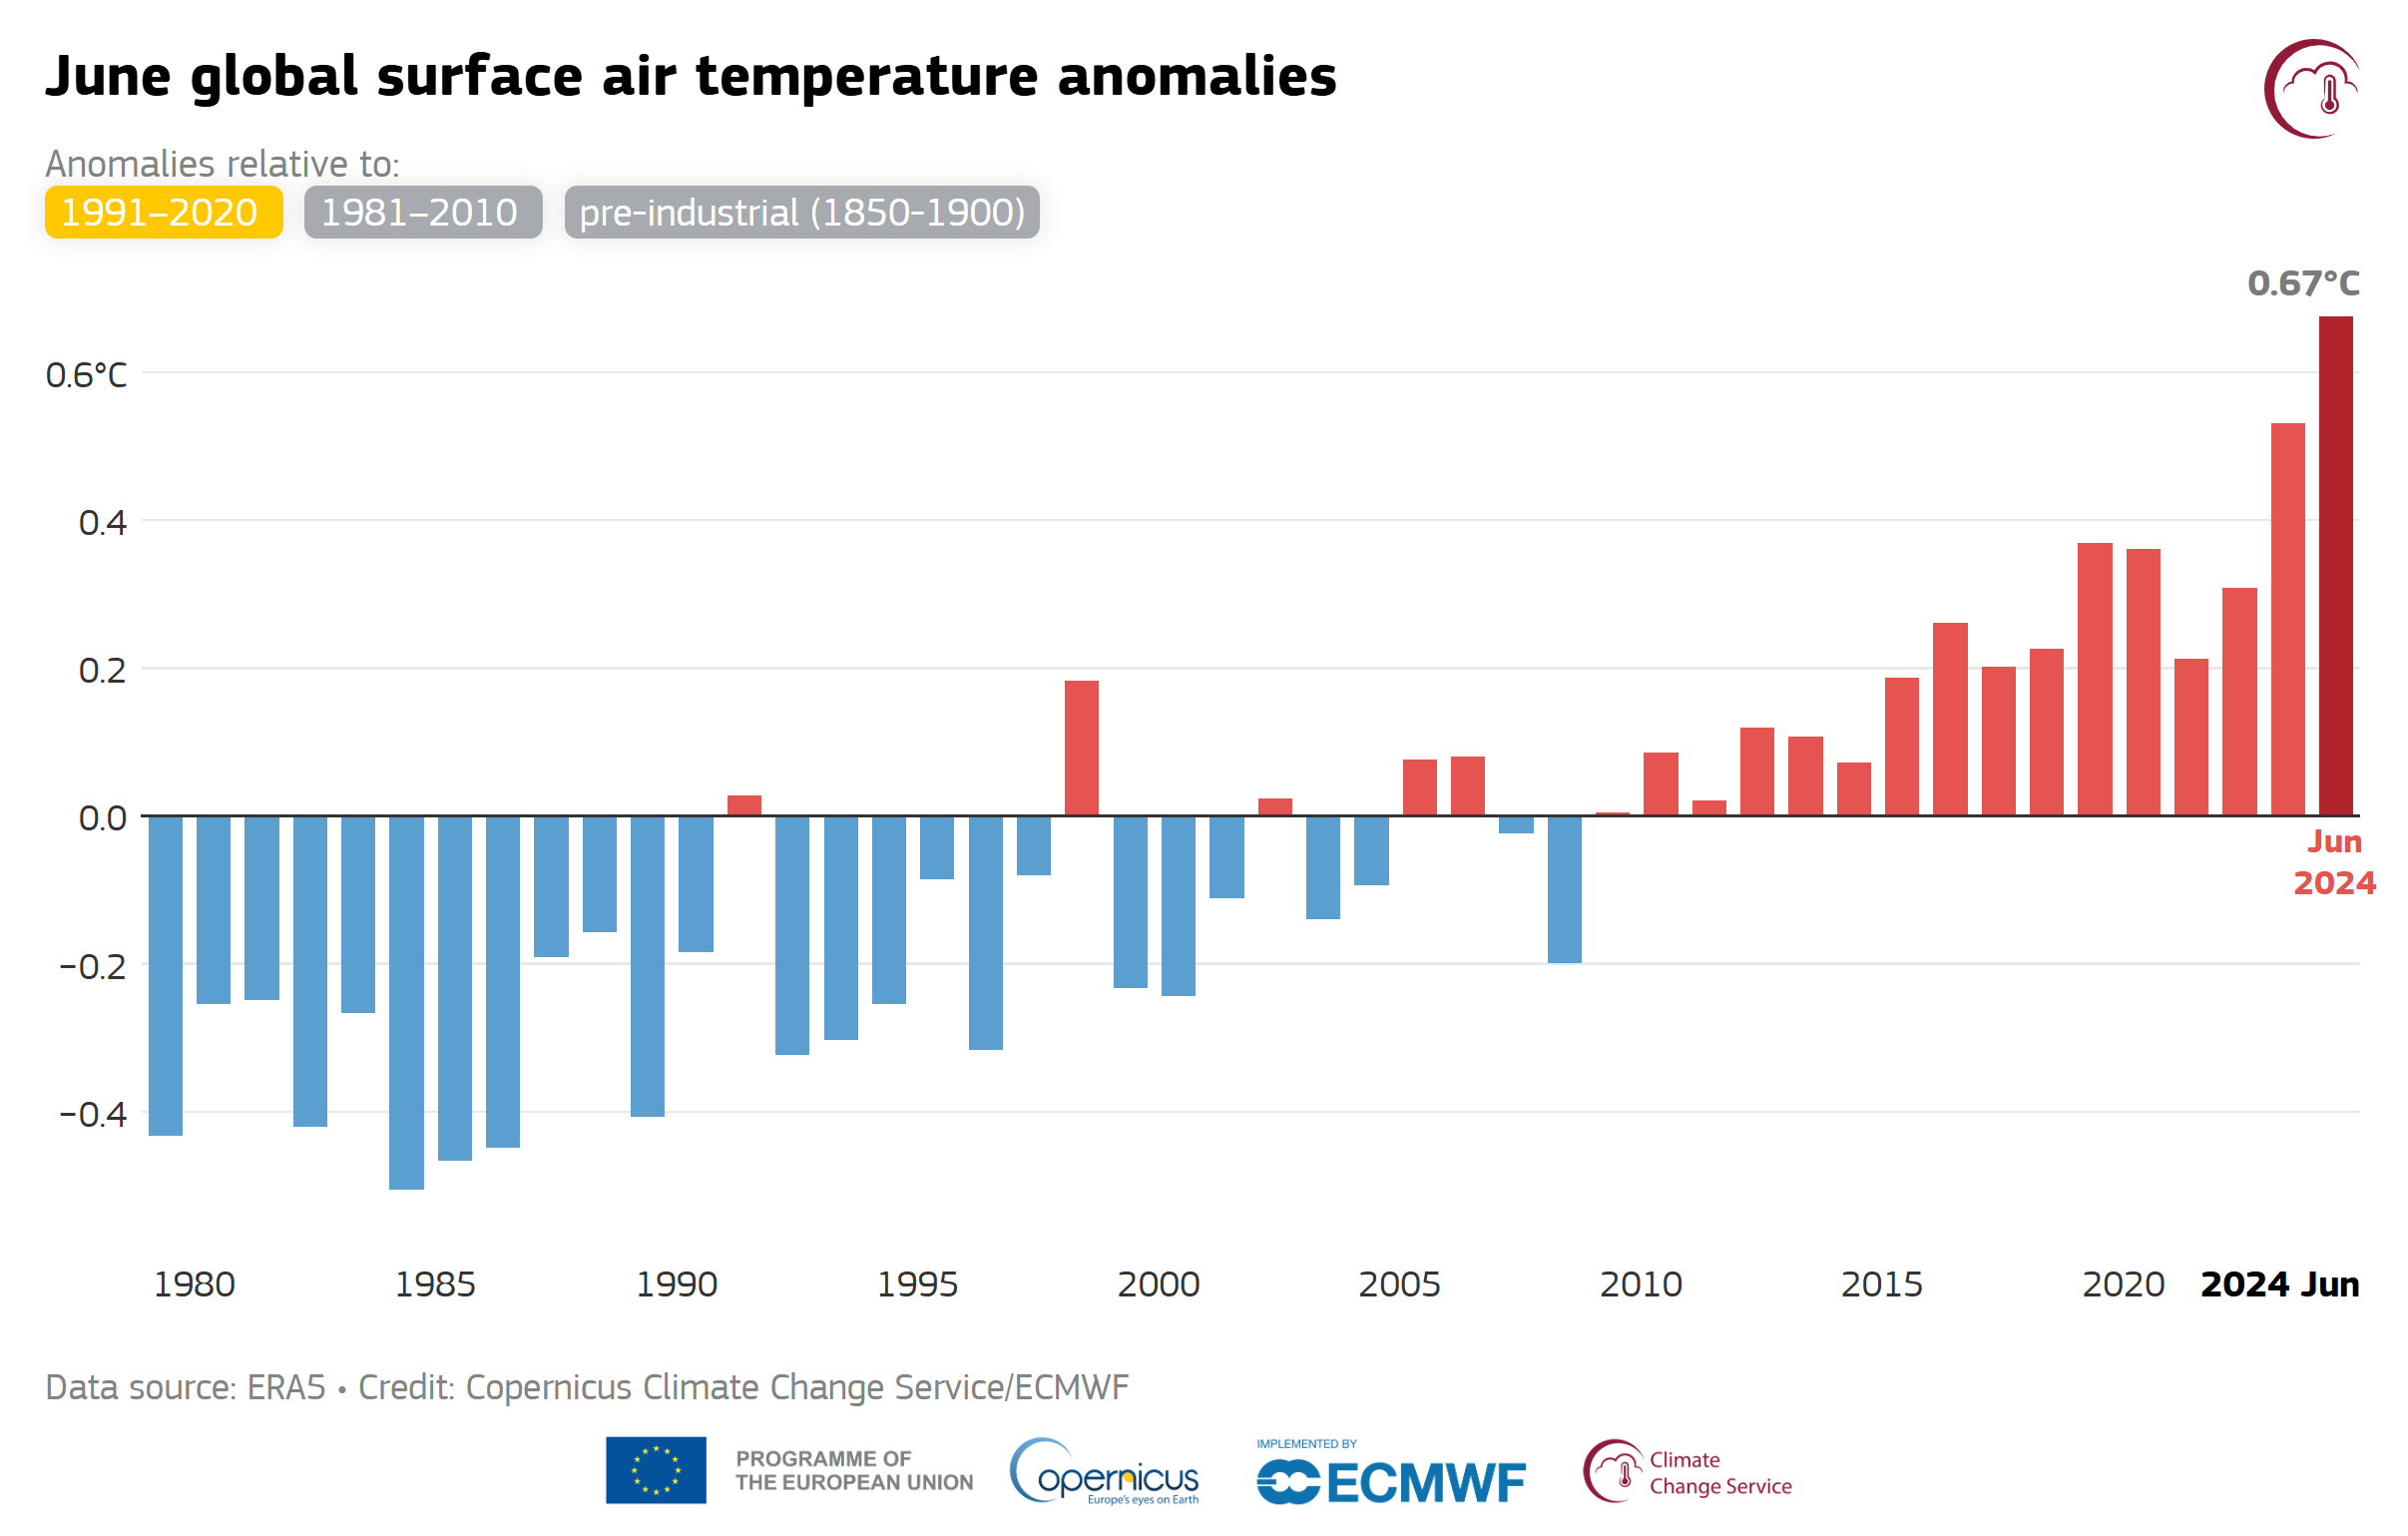
By Seth Borenstein 7 July 2024 (AP) – Earth’s more than year-long streak of record-shattering hot months kept on simmering through June, according to the European climate service Copernicus. There’s hope that the planet will soon see an end to the record-setting part of the heat streak, but not the climate chaos that has come […]
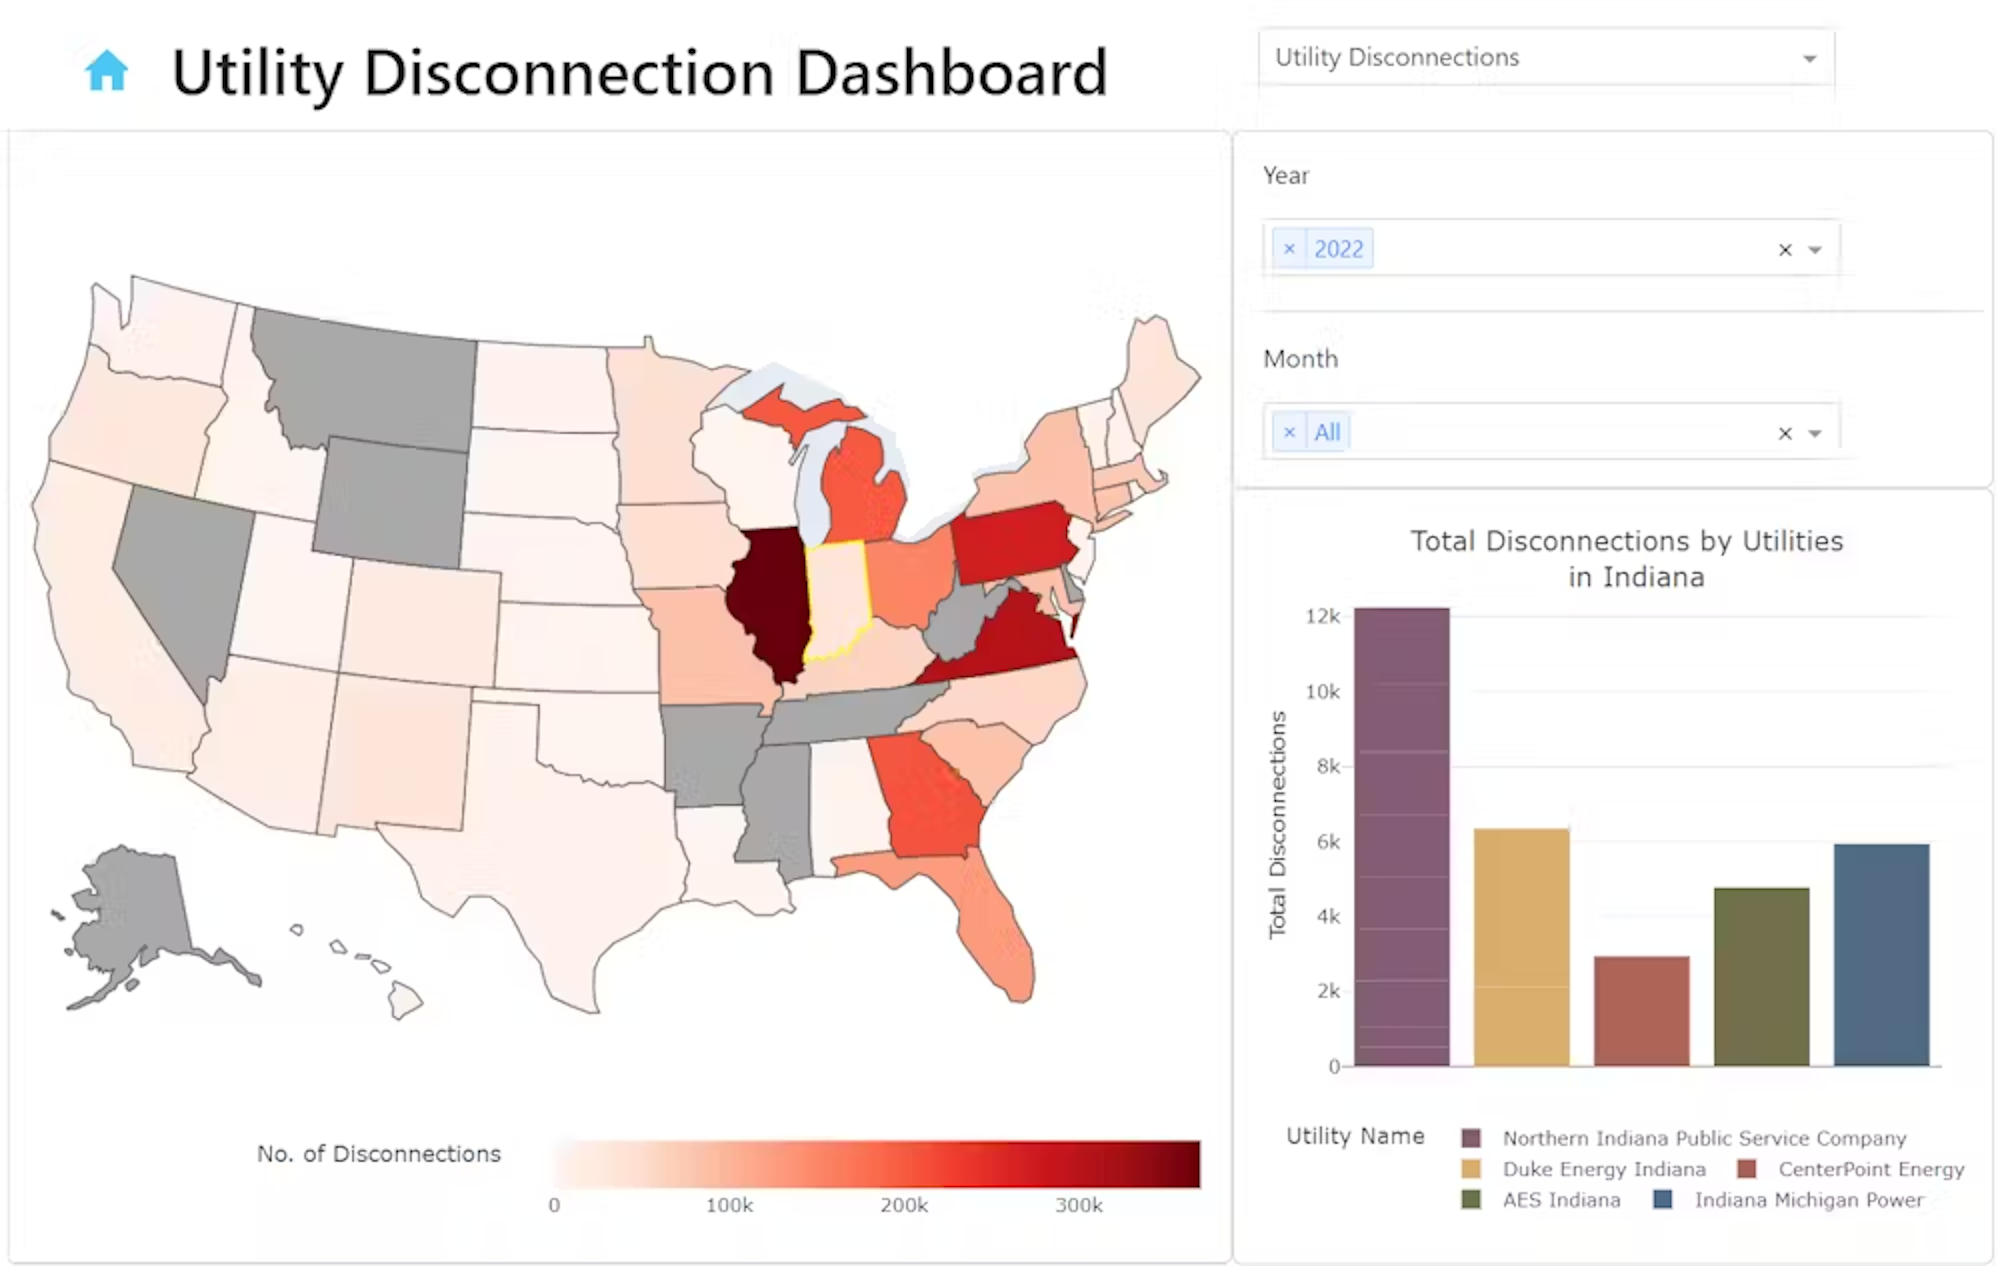
By Sanya Carley and David Konisky 5 July 2024 (The Conversation) – Millions of Americans have been sweltering through heat waves in recent weeks, and U.S. forecasters warn of a hot summer ahead. Globally, 2023 saw the warmest June on record, according to the European Union’s climate change service. That heat continued into July, with some of […]
By Andrea Valdez 12 July 2024 (The Atlantic) – For the 2.2 million people in Houston who lost power Monday after Hurricane Beryl swept through the city, the first question they had was When will the electricity be back on? The city’s utility, CenterPoint Energy, didn’t yet have an online outage map to monitor. There was, however, […]