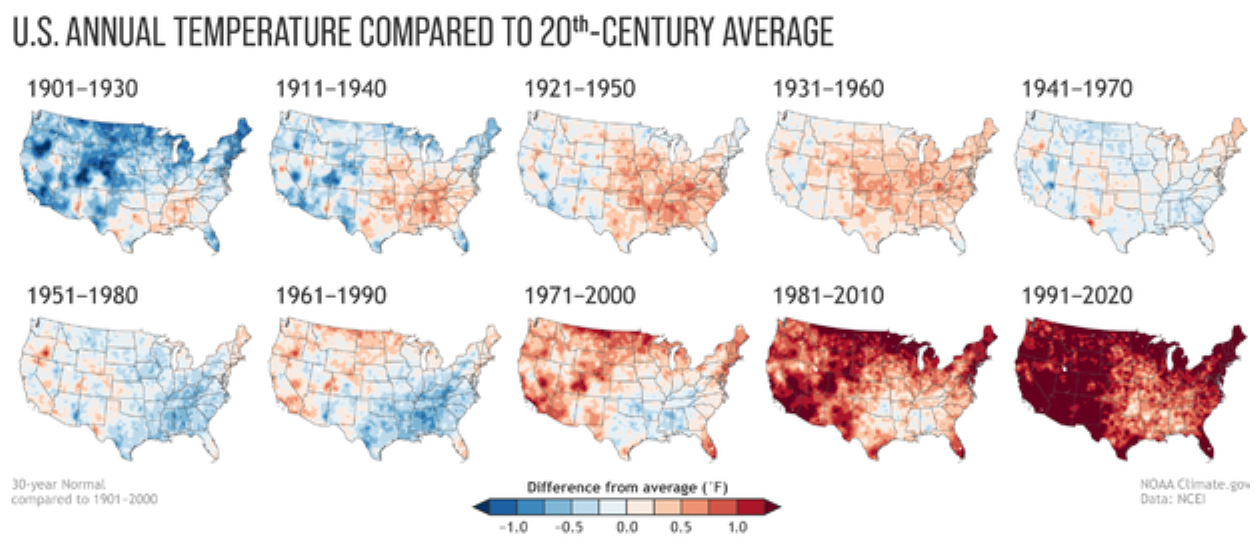
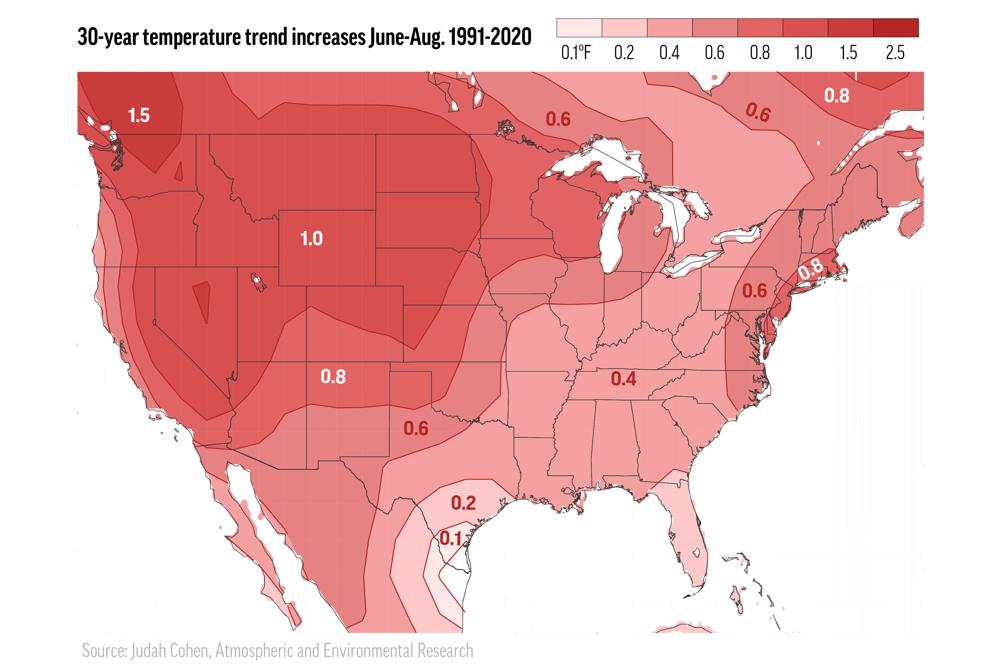
By Seth Borenstein 4 July 2021 (AP) – As outlandish as the killer heatwave that struck the Pacific Northwest was, it fits into a decades-long pattern of uneven summer warming across the United States. The West is getting roasted by hotter summer days while the East Coast is getting swamped by hotter and stickier summer […]
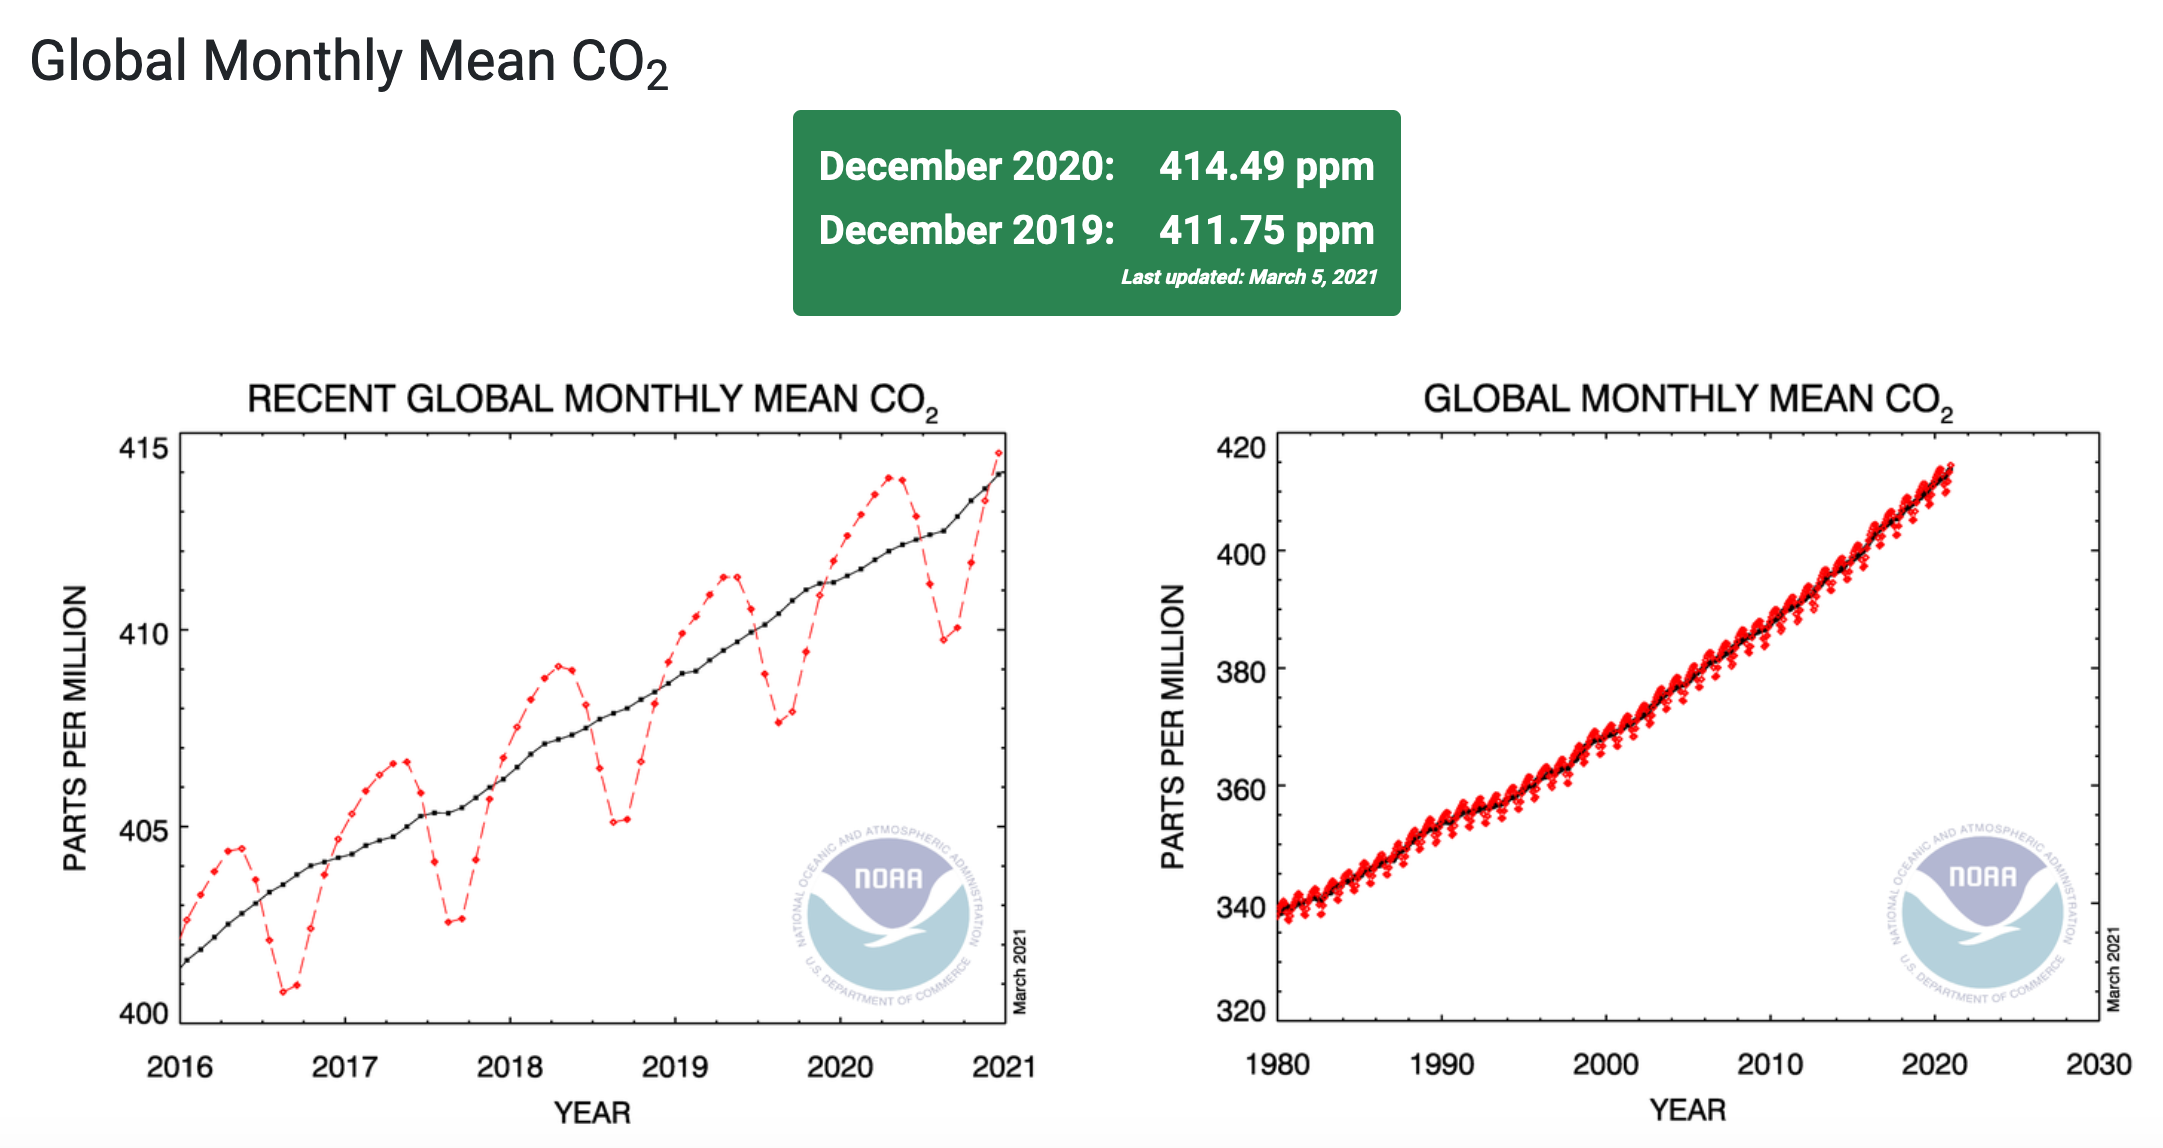
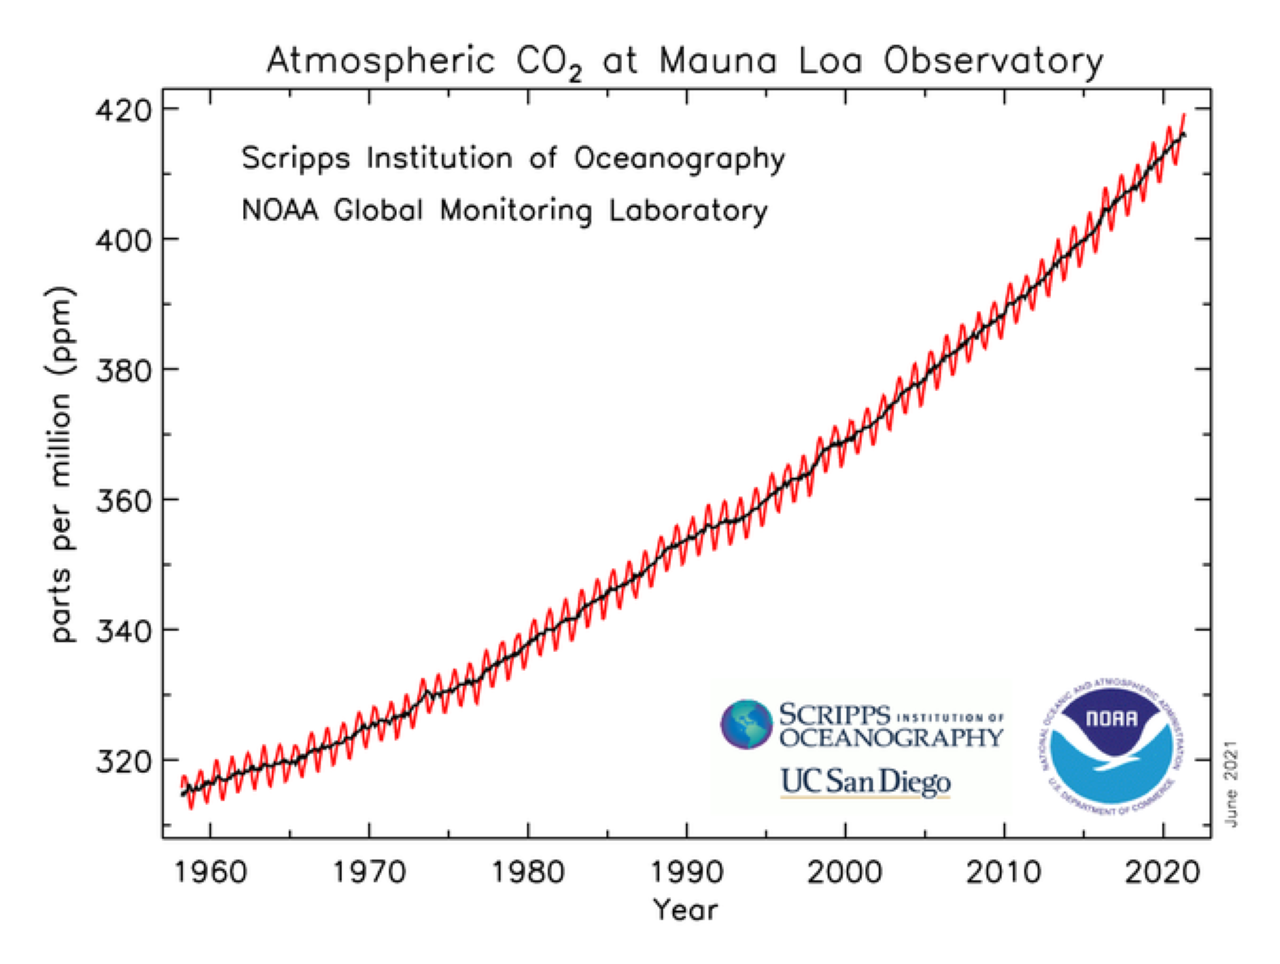
7 June 2021 (NOAA) – Atmospheric carbon dioxide measured at NOAA’s Mauna Loa Atmospheric Baseline Observatory peaked for 2021 in May at a monthly average of 419 parts per million (ppm), the highest level since accurate measurements began 63 years ago, scientists from NOAA and Scripps Institution of Oceanography at the University of California San Diego announced today. […]
26 May 2021 (NOAA) – […] The atmospheric abundance of CO2 has increased by an average of 1.85 ppm per year over the past 41 years (1979-2020). This increase in CO2 is accelerating — while it averaged about 1.6 ppm per year in the 1980s and 1.5 ppm per year in the 1990s, the growth rate increased to […]
By Jeff Berardelli 8 May 2021 (CBS News) – Just a quick glance at the new U.S. Climate Normals maps published by the National Oceanic and Atmospheric Administration (NOAA) on Tuesday is enough for most climate scientists to say, “I told you so.” And it’s not just because the maps show a warmer and wetter […]
7 April 2021 (NOAA) – Levels of the two most important anthropogenic greenhouse gases, carbon dioxide and methane, continued their unrelenting rise in 2020 despite the economic slowdown caused by the coronavirus pandemic response, NOAA announced today. The global surface average for carbon dioxide (CO2), calculated from measurements collected at NOAA’s remote sampling locations, was […]
CHICAGO, 25 January 2021 (Aon) – Aon plc (NYSE: AON), a leading global professional services firm providing a broad range of risk, retirement, and health solutions, today launches its global Weather, Climate & Catastrophe Insight: 2020 Annual Report. The report evaluates the impact of global natural disaster events to identify trends, manage volatility and enhance resilience. The report reveals […]
By Christopher Flavelle 1 January 2021 (The New York Times) – The National Climate Assessment, America’s premier contribution to climate knowledge, stands out for many reasons: Hundreds of scientists across the federal government and academia join forces to compile the best insights available on climate change. The results, released just twice a decade or so, […]
By Michael Benson 28 December 2020 (The New York Times) – I have a pastime, one that used to give me considerable pleasure, but lately it has morphed into a source of anxiety, even horror: earth-watching. Let me explain. The earth from space is an incomparably lovely sight. I mean the whole planet, pole to […]
8 December 2020 (NOAA) – NOAA’s 15th Arctic Report Card catalogs for 2020 the numerous ways that climate change continues to disrupt the polar region, with second-highest air temperatures and second-lowest summer sea ice driving a cascade of impacts, including the loss of snow and extraordinary wildfires in northern Russia. The Arctic Report Card is […]
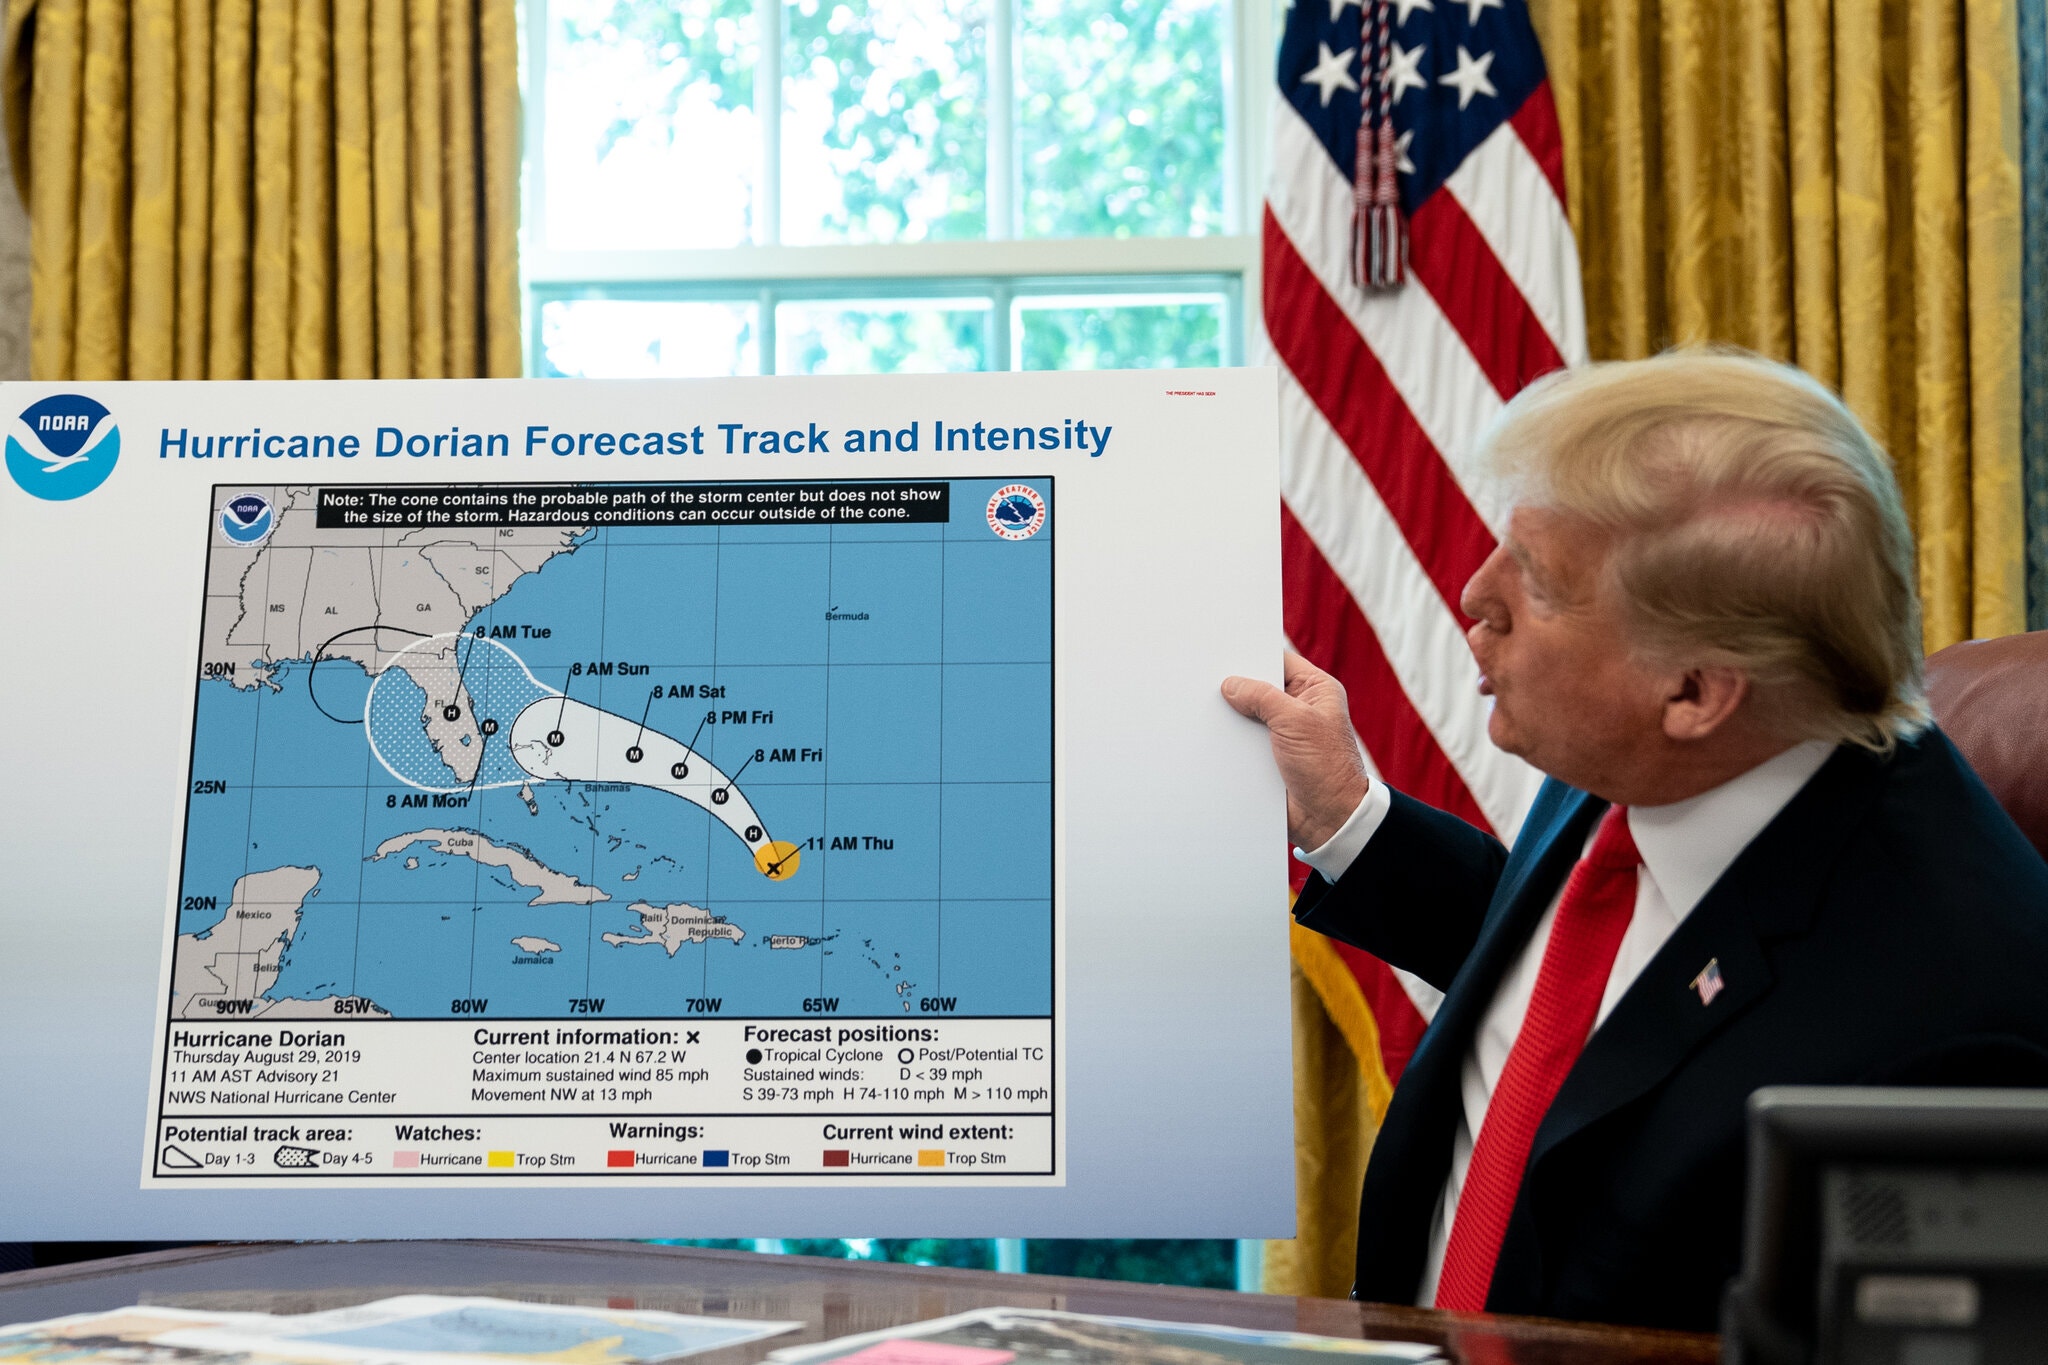
1 December 2020 (WMO) – The extremely active 2020 Atlantic hurricane season officially ended on 30 November with a record-breaking 30 named tropical storms, including 13 hurricanes and six major hurricanes. There were 12 landfalling storms in the continental United States. This is the most storms on record, surpassing the 28 from 2005, and the […]
![Annual Greenhouse Gas Index (AGGI), 1750-2020. For 2020, the AGGI was a record high 1.47, representing an increase in total direct radiative forcing of 47 percent since 1990. This increase in CO2 is accelerating — while it averaged about 1.6 ppm per year in the 1980s and 1.5 ppm per year in the 1990s, the growth rate increased to 2.4 ppm per year during the last decade (2009-2020). Pre-1978 changes in the CO2-equivalent abundance and AGGI based on the ongoing measurements of all greenhouse gases reported here, measurements of CO2 going back to the 1950s from C.D. Keeling [Keeling et al., 1958], and atmospheric changes derived from air trapped in ice and snow above glaciers [Machida et al., 1995, Battle et al., 1996, Etheridge, et al., 1996; Butler, et al., 1999]. Equivalent CO2 atmospheric amounts (in ppm) are derived with the relationship between CO2 concentrations and radiative forcing from all long-lived greenhouse gases. Graphic: Butler and Montzka, 2021 / NOAA](https://desdemonadespair.net/wp-content/uploads/2021/05/AGGI-1750-2020-Butler-and-Montzka-2021-NOAA.png)