Change Over Time in (a) US Life Expectancy and (b) US Life Expectancy Gap and Rank Relative to Populous Countries (Population>500000), 1950-2021. Phase 1=1950–1954; phase 2=1955–1973; phase 3=1974–1982; phase 4=1983–2009; phase 5=2010–2019; phase 6=2020–2021. Bars plot the difference in life expectancy between the United States and the populous country (population >500000) with the highest life expectancy in the given year. The country with the highest life expectancy was Norway in 1950–1962 and 1976–1977, Sweden in 1963 and 1965–1975, the Netherlands in 1964, Japan in 1978–2007, Macao in 2008–2010, and Japan in 2011–2021. The line graph plots US rank relative to other populous countries, with higher rank denoting lower US life expectancy. Source: Author’s calculations based on UN data. Graphic: Steven H. Woolf MD, MPH, 2023 / AJPH

U.S. has been falling behind on life expectancy for decades – Between 1933 and 2021, 56 countries achieved higher life expectancy than U.S. – “Americans are sicker and die earlier than people in dozens of countries”

By Olivia Trani 1 June 2023 (VCU) – When it comes to public health, the United States is at a disadvantage compared with other developed countries. Americans experience more illness, have less access to health care and pay more for health services than citizens in other high-income countries. Americans also die earlier – and have been doing so […]

Satellite view of the Iberian Peninsula on 11 May 2023 and 11 May 2023. These images, acquired by the Moderate Resolution Imaging Spectroradiometer (MODIS) on NASA’s Terra satellite, show where green vegetation in May 2022 turned brown by May 2023. The sparse rainfall further parched soils that were already unusually dry in 2022. According to a recent report by Copernicus Climate Change Services, soil moisture across all of Europe in 2022 was the second lowest in the past 50 years. Unseasonable heat exacerbated the prolonged drought. On 26 April 2023, hot air from North Africa swept over southern Spain and pushed the temperature at the Córdoba airport to 38.8°C (101.8°F), the highest April temperature recorded in continental Spain. Photo: Allison Nussbaum / NASA Earth Observatory

Drought in Spain spurs largest-ever claim for agricultural insurance – 2023 sees the highest number of fires and the most extensive burned area since 2006

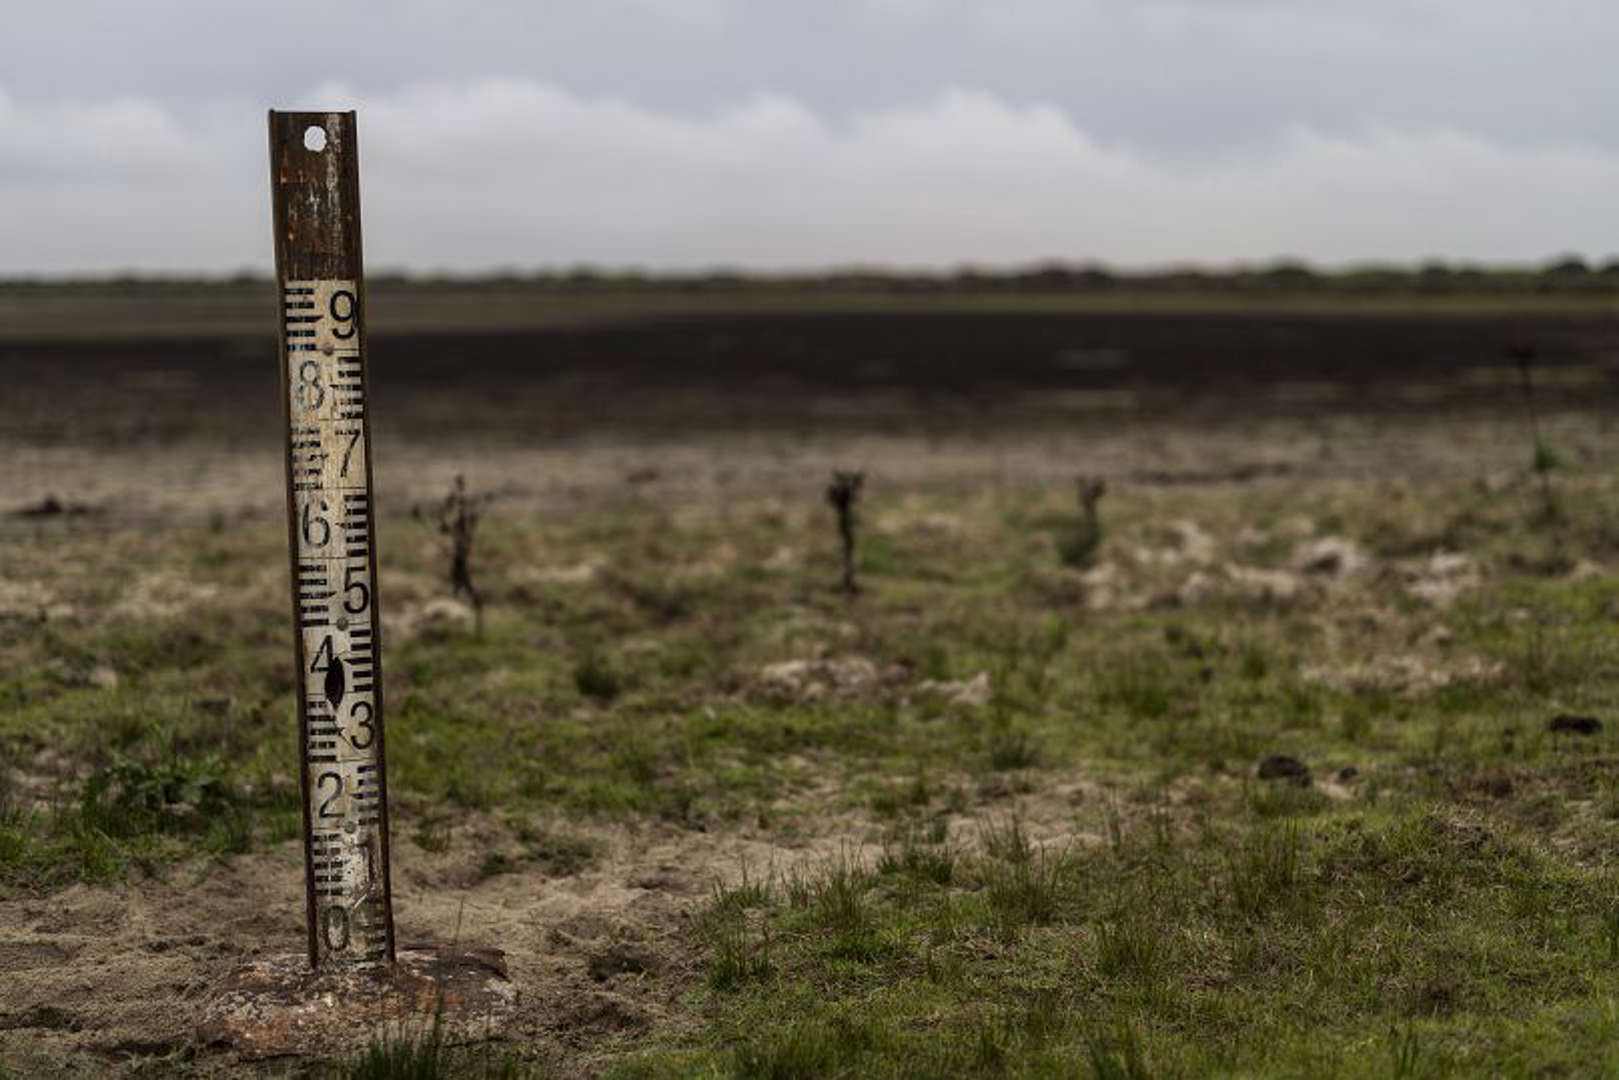
By Akankshita Mukhopadhyay 26 May 2023 (Reinsurance News) – The drought in Spain would be the largest claim ever paid by the Spanish agricultural insurance, according to professional services firm Aon. Agroseguro, the leading agricultural insurance provider in Spain, is bracing for an unprecedented payout of over €300 million ($325 million) in compensations due to […]

A water meter stands in dry wetland in Donana natural park, southwest Spain as unprecedented drought hits the nation in 2023. Photo: Bernat Armangue / Africanews / AP Photo

“Murderers” and “criminals”: Meteorologists face unprecedented harassment from conspiracy theorists – “It was one of the hardest experiences in social media in my life”

By Laura Paddison 27 May 2023 (CNN) – “Murderers.” “Criminals.” “We are watching you.” These are just a handful of the threats and abuse sent to meteorologists at AEMET, Spain’s national weather agency, in recent months. They come via social media, its website, letters, phone calls – even in the form of graffiti sprayed across […]

During the last week of April 2023, temperatures in parts of Spain, Portugal, Morocco and Algeria were up to 20°C higher than normal for the time of year. Graphic: Met Office

Western Mediterranean heatwave rare even for today’s warmed world – Extreme April 2023 heat in Spain, Portugal, Morocco, and Algeria almost impossible without climate change

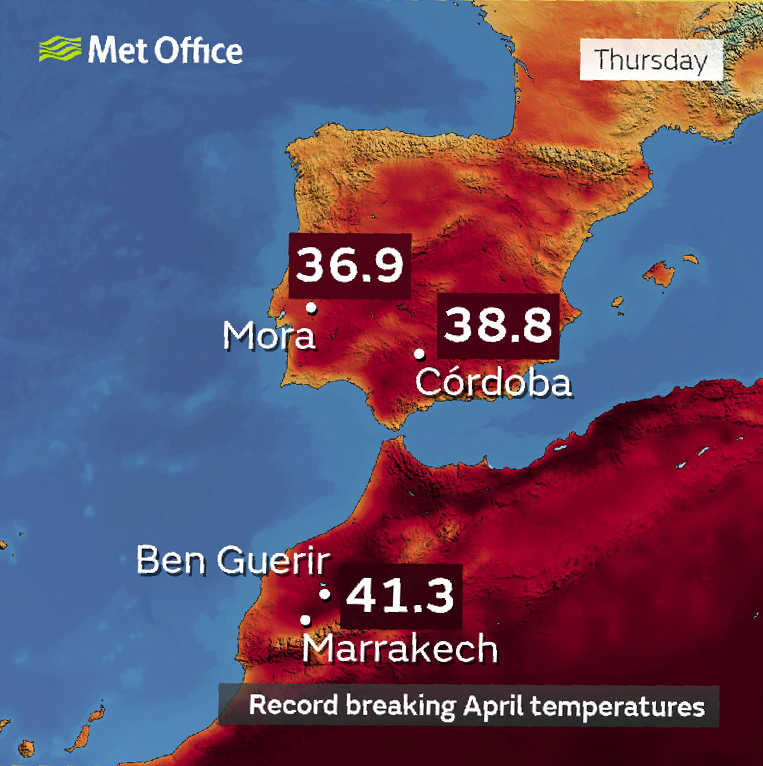
7 May 2023 (Climate Centre) – A rapid study of last month’s extraordinary heatwave in the western Mediterranean by World Weather Attribution scientists says that while Europe and North Africa have experienced more extreme heat in recent years, the April heatwave was “so extreme that it is also a rare event in today’s warmer climate”. During the […]

These two images show shrinking water reservoirs in the Catalonia region of Spain on 21 Mar 2021 and 12 Apr 2023. Photo: Allison Nussbaum / NASA

Spain records hottest and driest April on record – “This is the worst period that we have had for the last 100 years”

MADRID, 8 May 2023 (AP) – Drought-stricken Spain says last month was the hottest and driest April since records began in 1961. The State Meteorological Agency, known by the Spanish acronym AEMET, said Monday the average daily temperature in April was 14.9 degrees Celsius (58.8 Fahrenheit), that is 3 degrees Celsius above the average. AEMET […]

Global annual mean temperature anomalies with respect to pre-industrial conditions (1850-1900) for six global temperature data sets (1850-2022). Graphic: WMO

WMO annual report highlights continuous advance of climate change – “While greenhouse gas emissions continue to rise and the climate continues to change, populations worldwide continue to be gravely impacted by extreme weather and climate events”

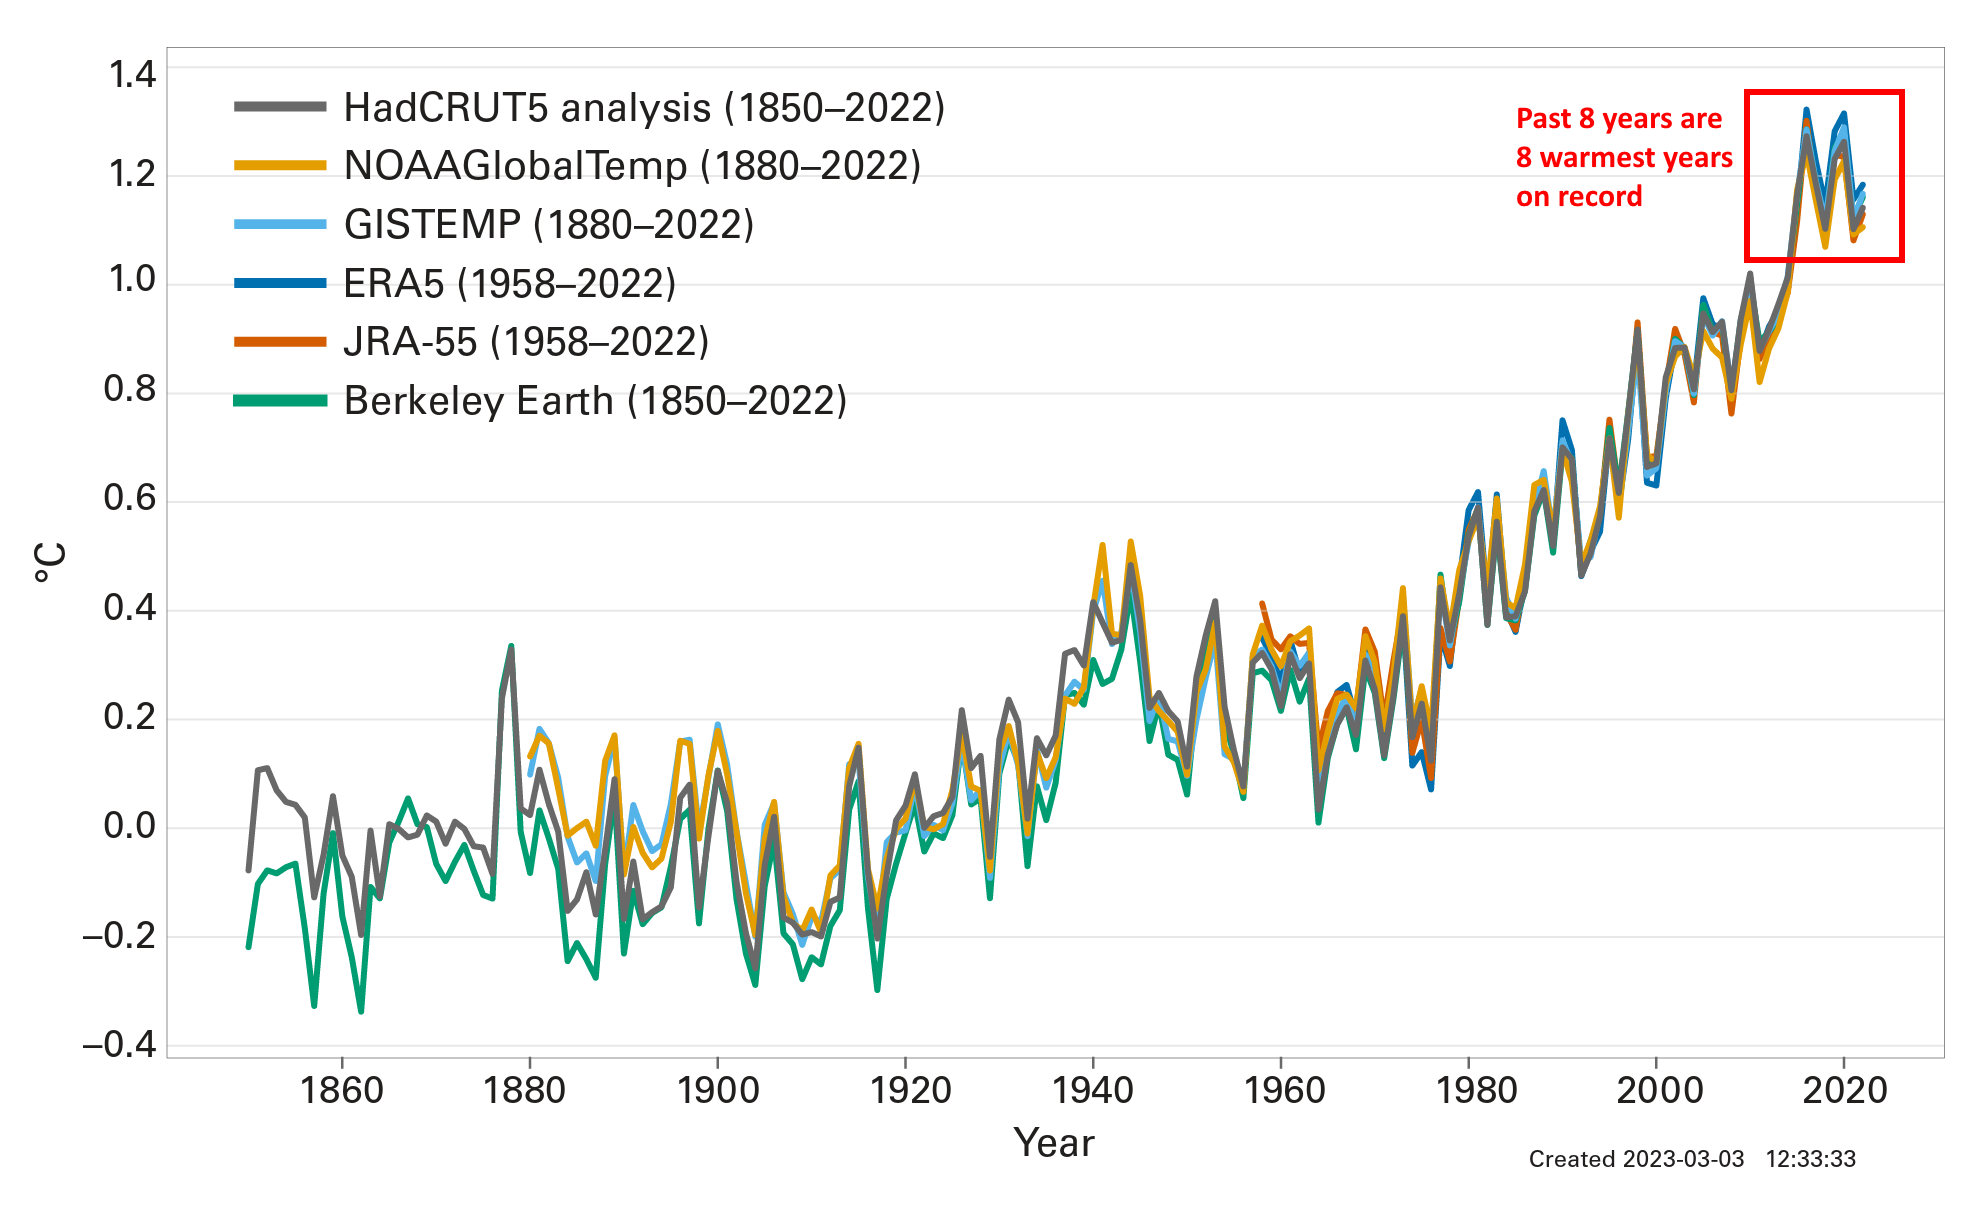
Geneva, 21 April 2023 (WMO) – From mountain peaks to ocean depths, climate change continued its advance in 2022, according to the annual report from the World Meteorological Organization (WMO). Droughts, floods, and heatwaves affected communities on every continent and cost many billions of dollars. Antarctic sea ice fell to its lowest extent on record […]

EIU Democracy Index 2022, global map by regime type. The average global index score stagnated in 2022. Despite expectations of a rebound after the lifting of pandemic-related restrictions, the score was almost unchanged, at 5.29 (on a 0-10 scale), compared with 5.28 in 2021. The positive effect of the restoration of individual freedoms was cancelled out by negative developments globally. The scores of more than half of the countries measured by the index either stagnated or declined. Western Europe was a positive outlier, being the only region whose score returned to pre-pandemic levels. Graphic: EIU

EIU Democracy Index 2022: Frontline democracy and the battle for Ukraine – “Overall the story is one of stagnation. This is a dismal result given that in 2022 the world started to move on from the pandemic-related suppression of individual liberties that persisted through 2020 and 2021”

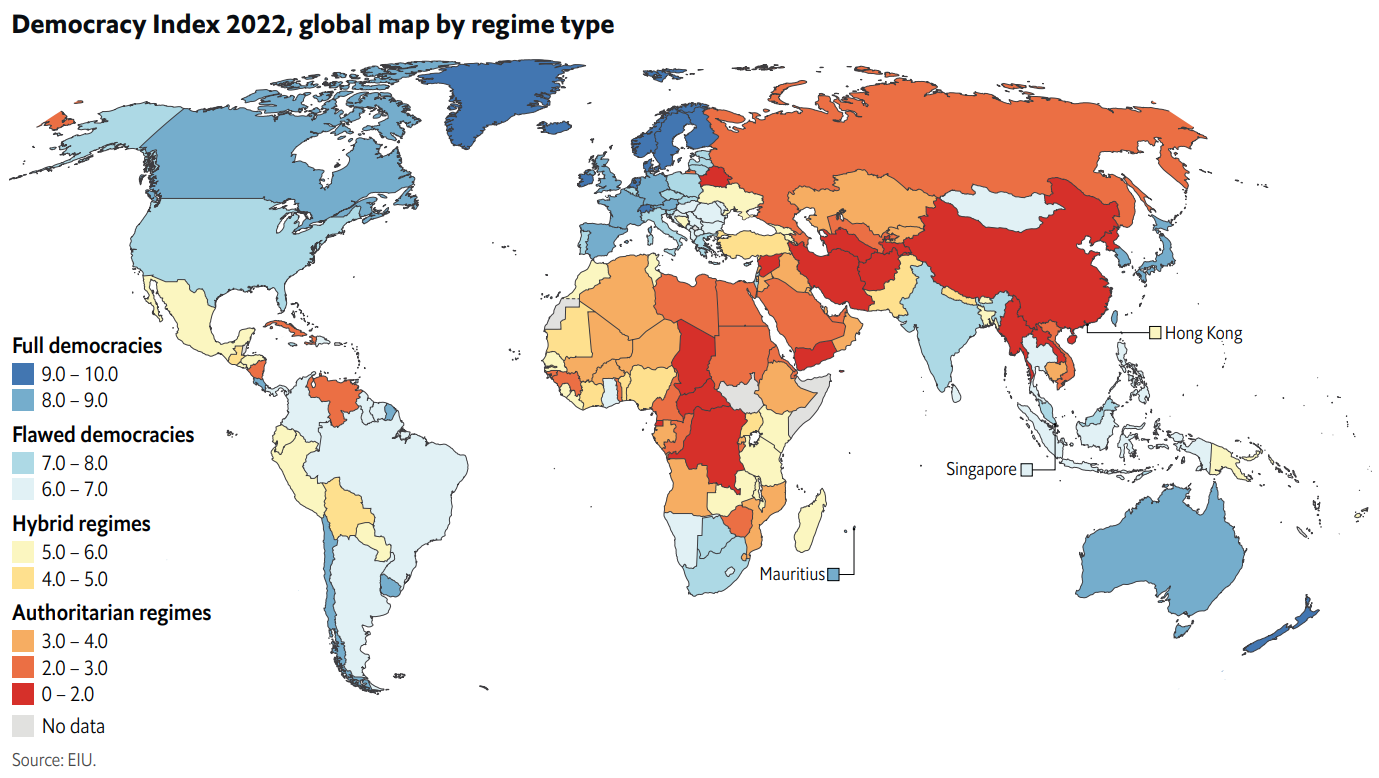
1 February 2023 (EIU) – The Democracy Index, which began in 2006, provides a snapshot of the state of democracy worldwide in 165 independent states and two territories. This covers almost the entire population of the world and the vast majority of the world’s states (microstates are excluded). The Democracy Index is based on five […]

Map showing natural catastrophe loss events in 2022. Natural catastrophes caused overall losses of US$270 billion worldwide. Data: Munich Re, NatCatSERVICE, 2023. Graphic: Munich Re

Munich Re: Climate change and La Niña driving losses – “Climate change is taking an increasing toll. The natural disaster figures for 2022 are dominated by events that, according to the latest research findings, are more intense or are occurring more frequently.”

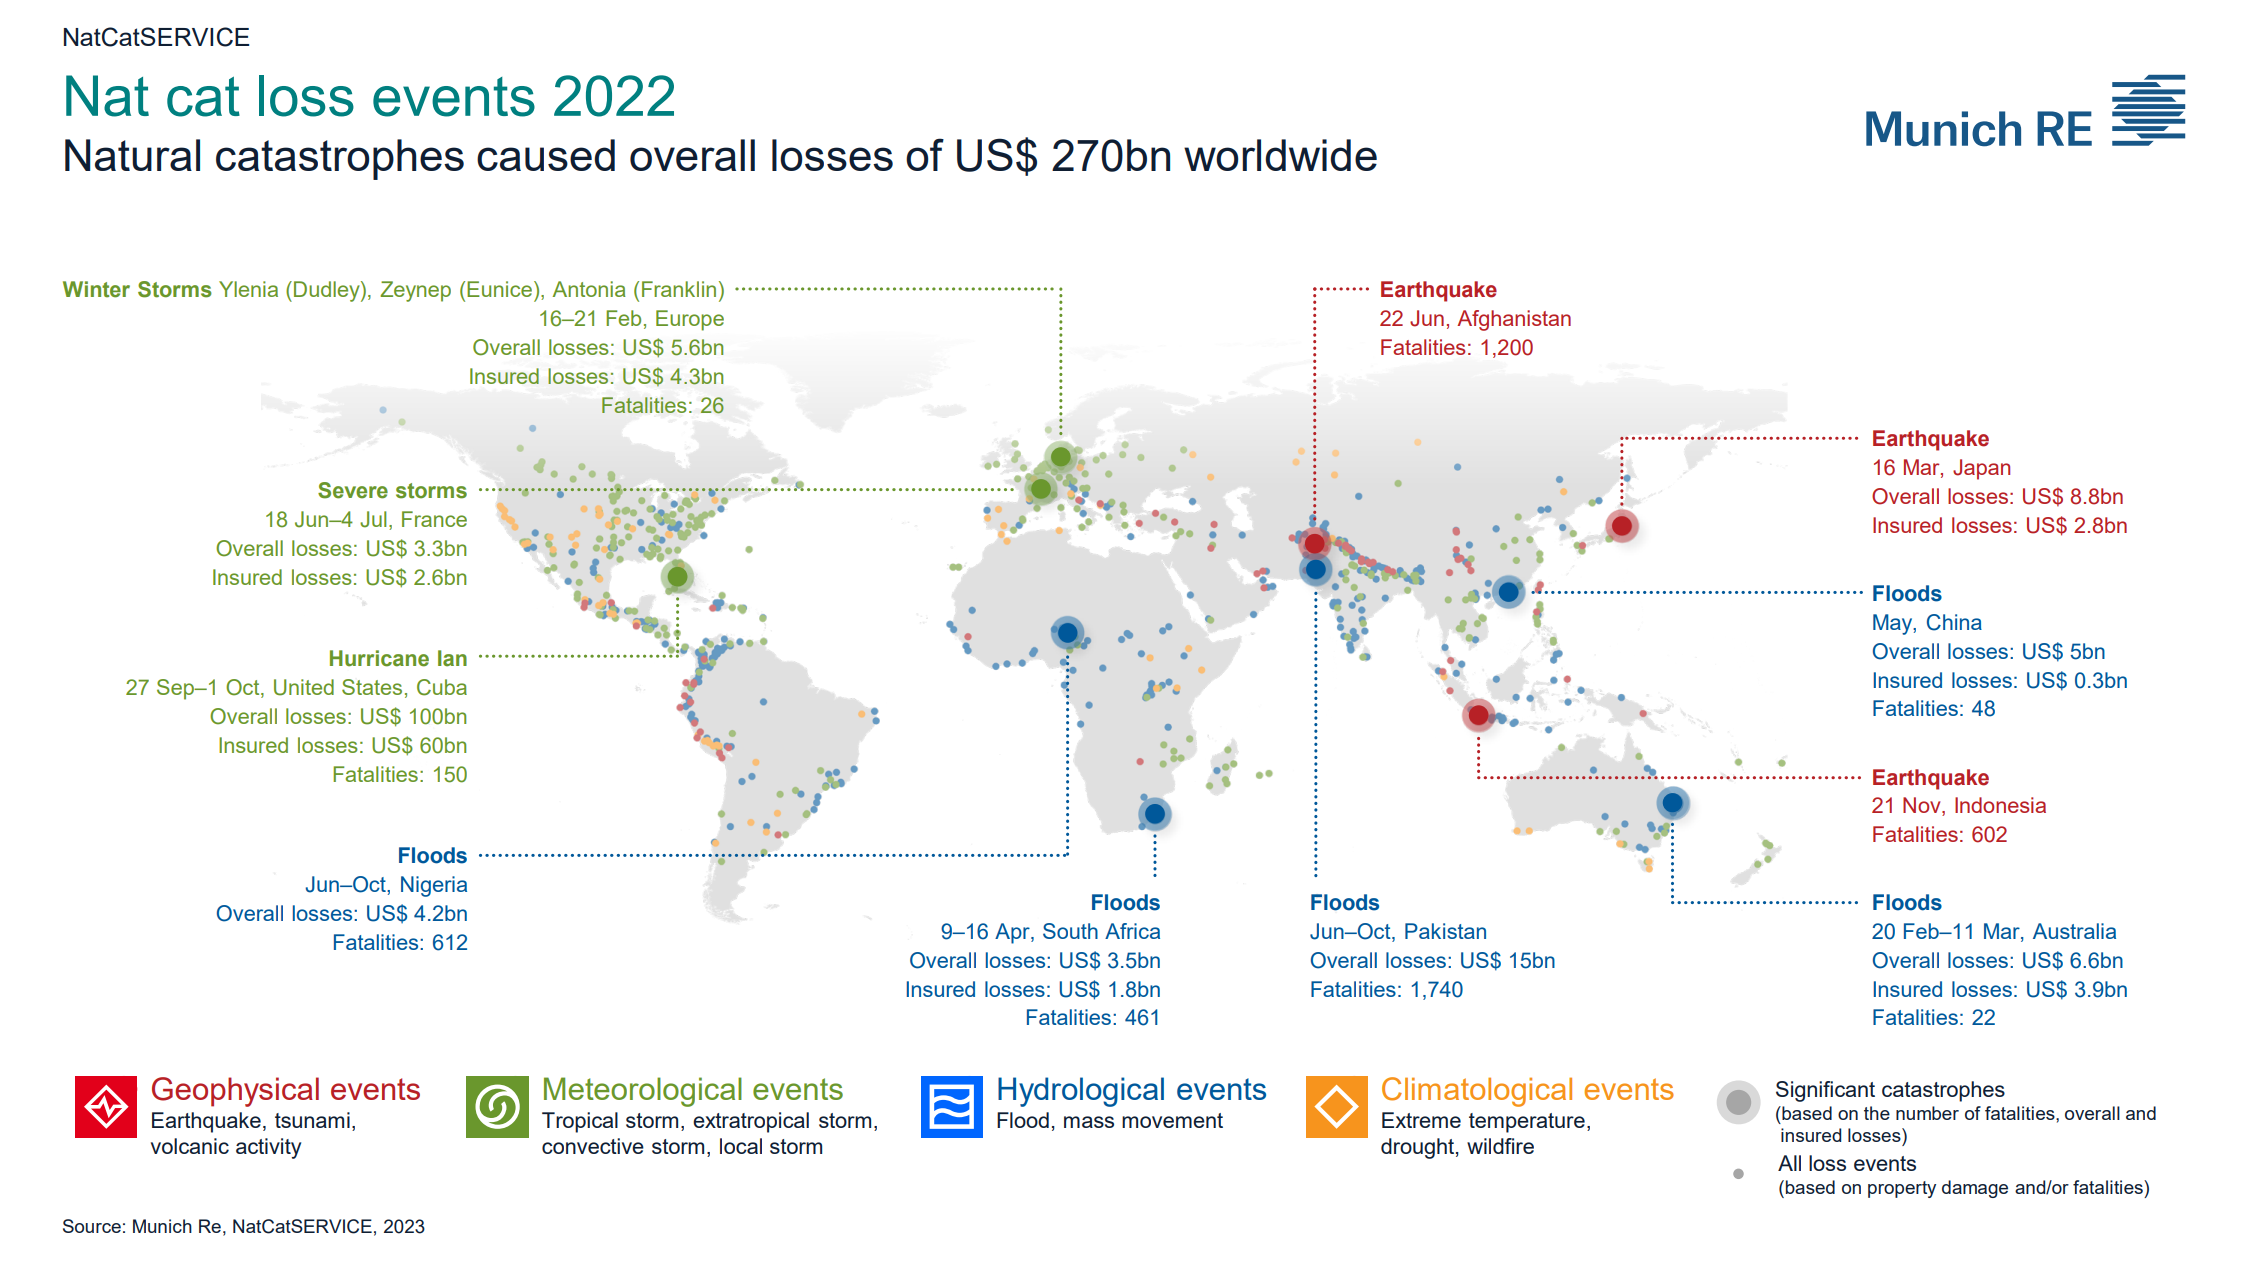
10 January 2023 (Munich Re) – With overall losses of around US$ 270bn (previous year US$ 320bn) and insured losses of roughly US$ 120bn (previous year US$ 120bn), 2022 joins the recent run of years with high losses. Overall losses were close to the average for the last five years, while insured losses were significantly […]

Yearly change in life expectancy in the U.S. and 30 other countries, 1901-2022. Data: Schöley, et al., 2022. Graphic: Fortune

The first global decline in life expectancy since World War II poses a major threat to the economy

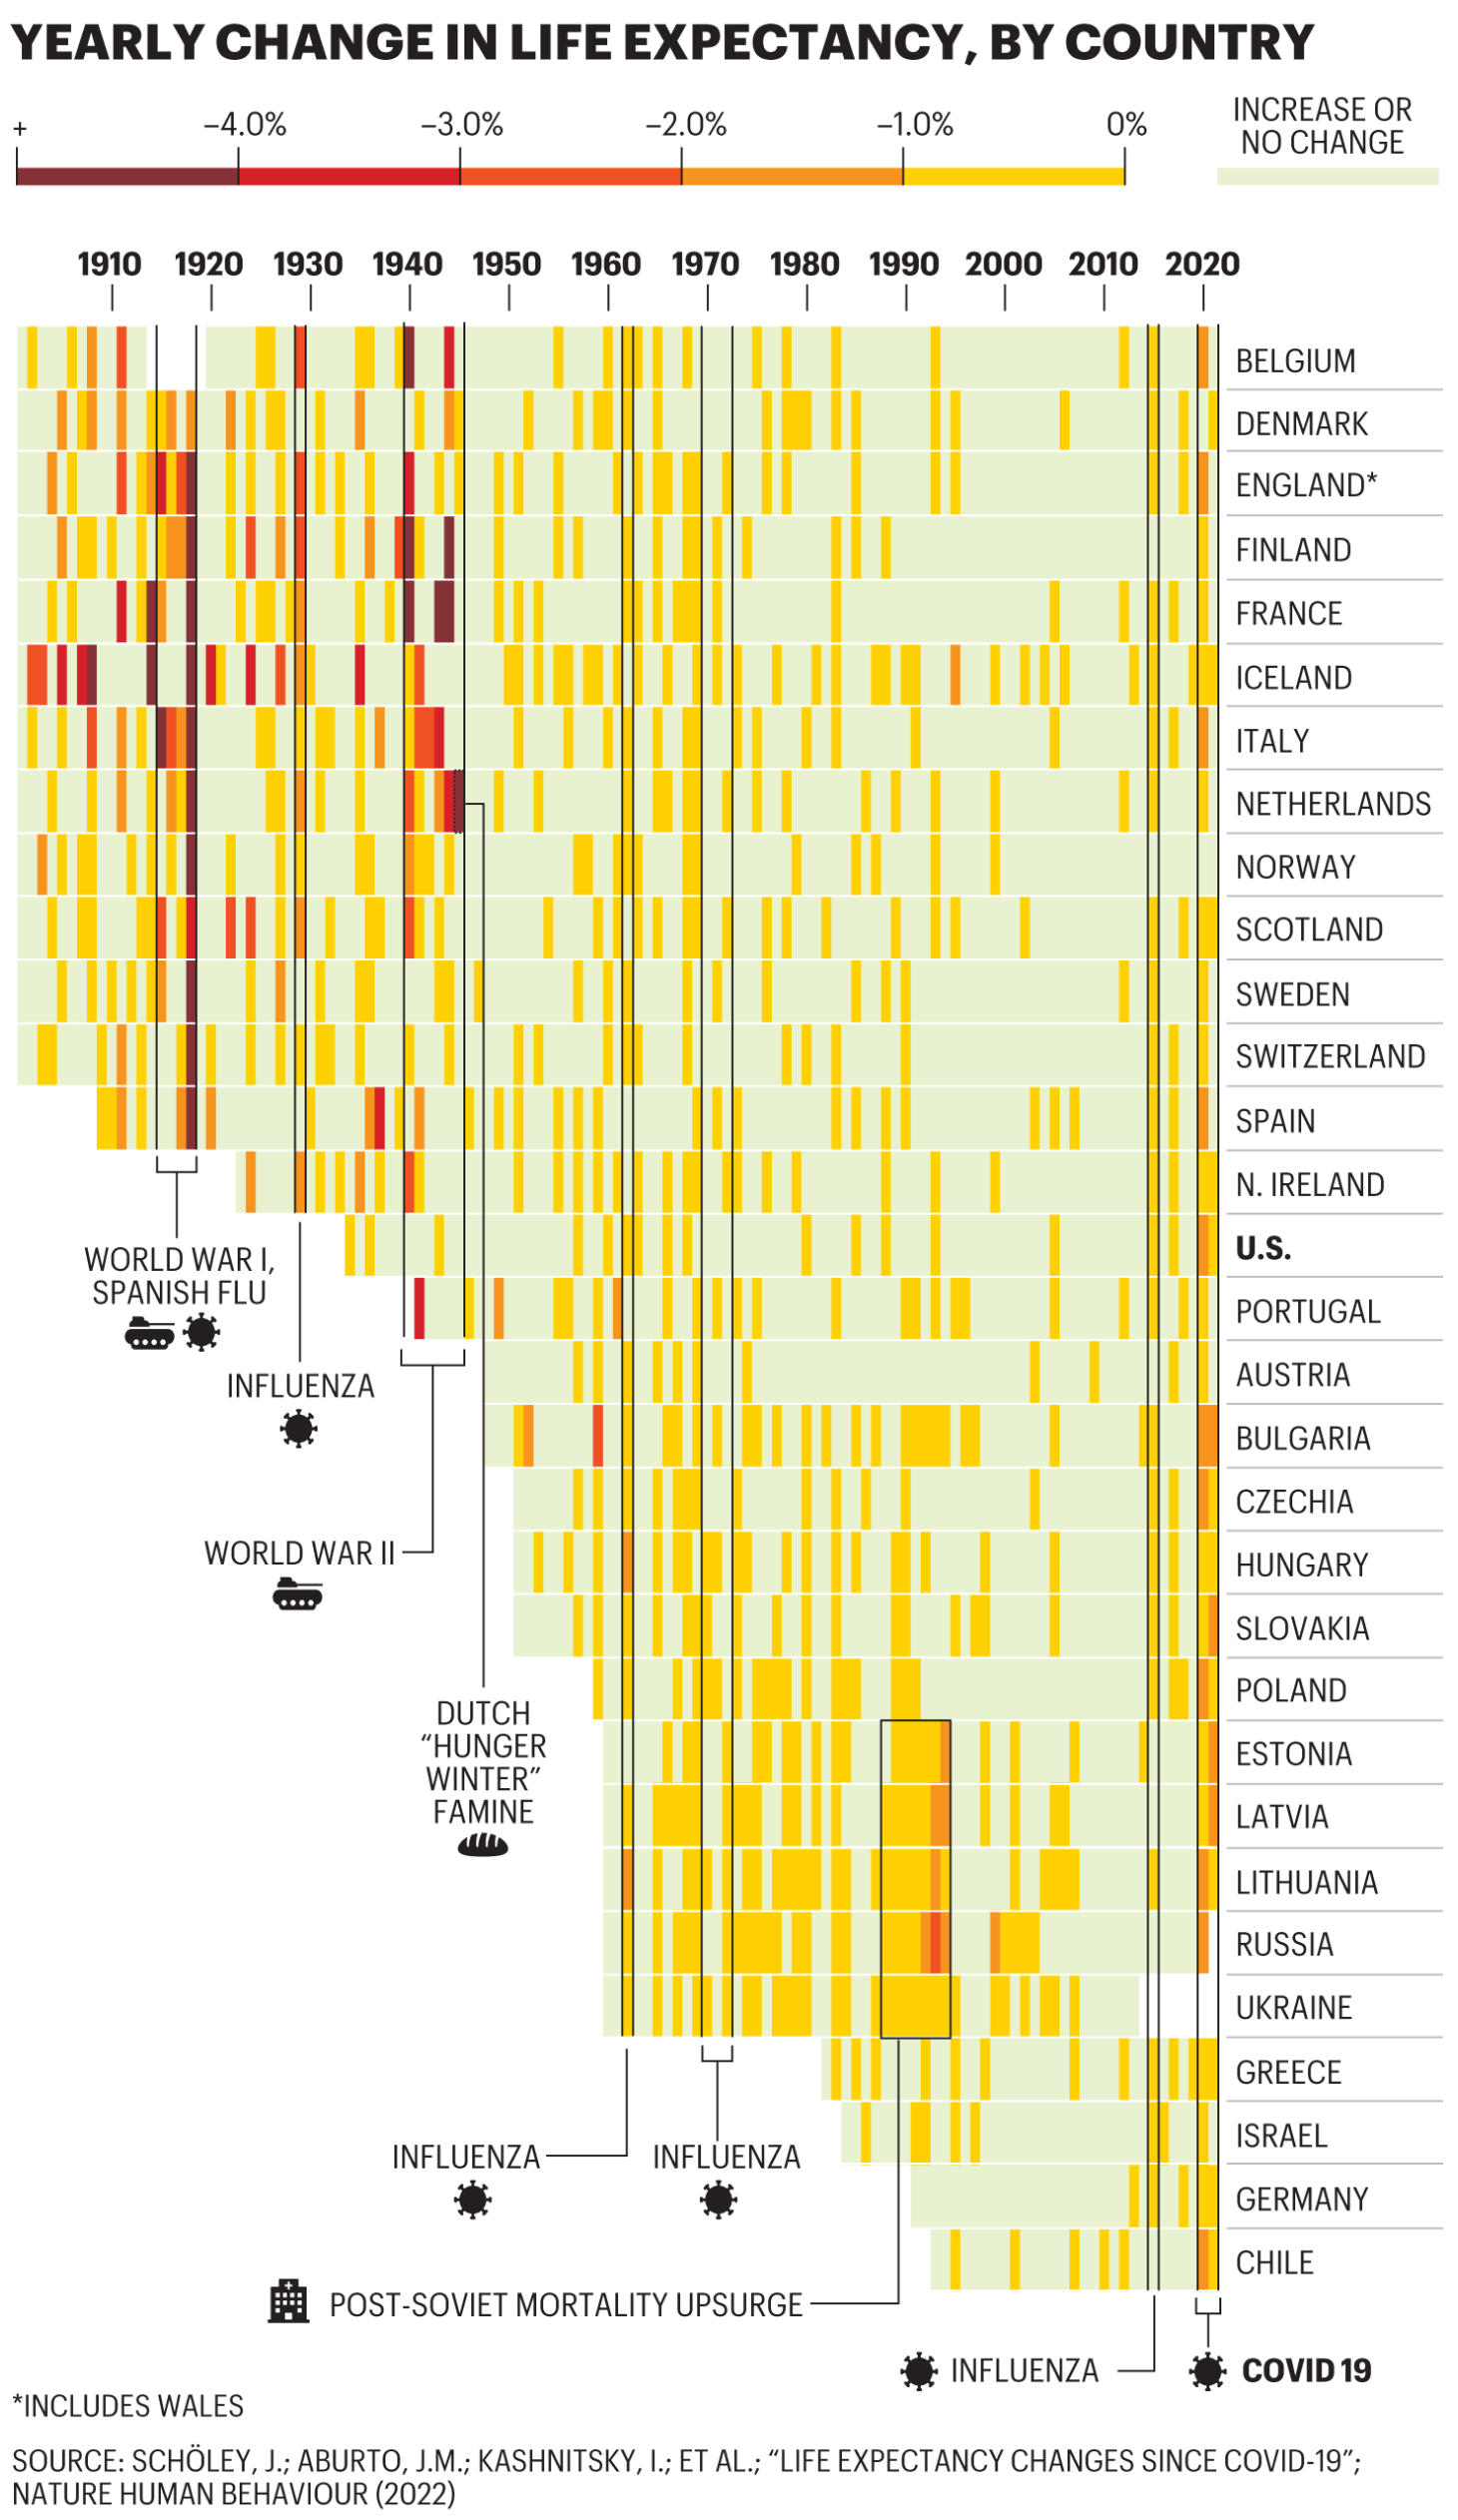
By Matthew Heimer and Nicolas Rapp6 December 2022 (Fortune) – COVID’s devastation shows up starkly in life expectancy data: The pandemic’s peak marked the first time since World War II that LE (as demographers call it) declined across the globe. The graphic above is based on a data set that focuses mostly on Europe, but similar […]

Regional glacier mass change and contributions to sea level rise from 2015 to 2100. Discs show global and regional projections of glacier mass remaining by 2100 relative to 2015 for global mean temperature change scenarios. Discs are scaled based on each region’s contribution to global mean sea level rise from 2015 to 2100 for the +2°C scenario by 2100 relative to preindustrial levels, and nested rings are colored by temperature change scenarios showing normalized mass remaining in 2100. Regional sea level rise contributions >1 mm SLE for the +2°C scenario are printed in the center of each disc. The horizontal bars below each disc show time series of area-averaged annual mass balance from 2015 to 2100 for +1.5°C (top bar) and +3°C (bottom bar) scenarios. The colorbar is saturated at −2.5 m w.e., but minimum annual values reach −4.2 m w.e. in Scandinavia. Graphic: Rounce, et al., 2022 / Science

Half of glaciers will be gone by 2100 even under Paris 1.5C accord, study finds

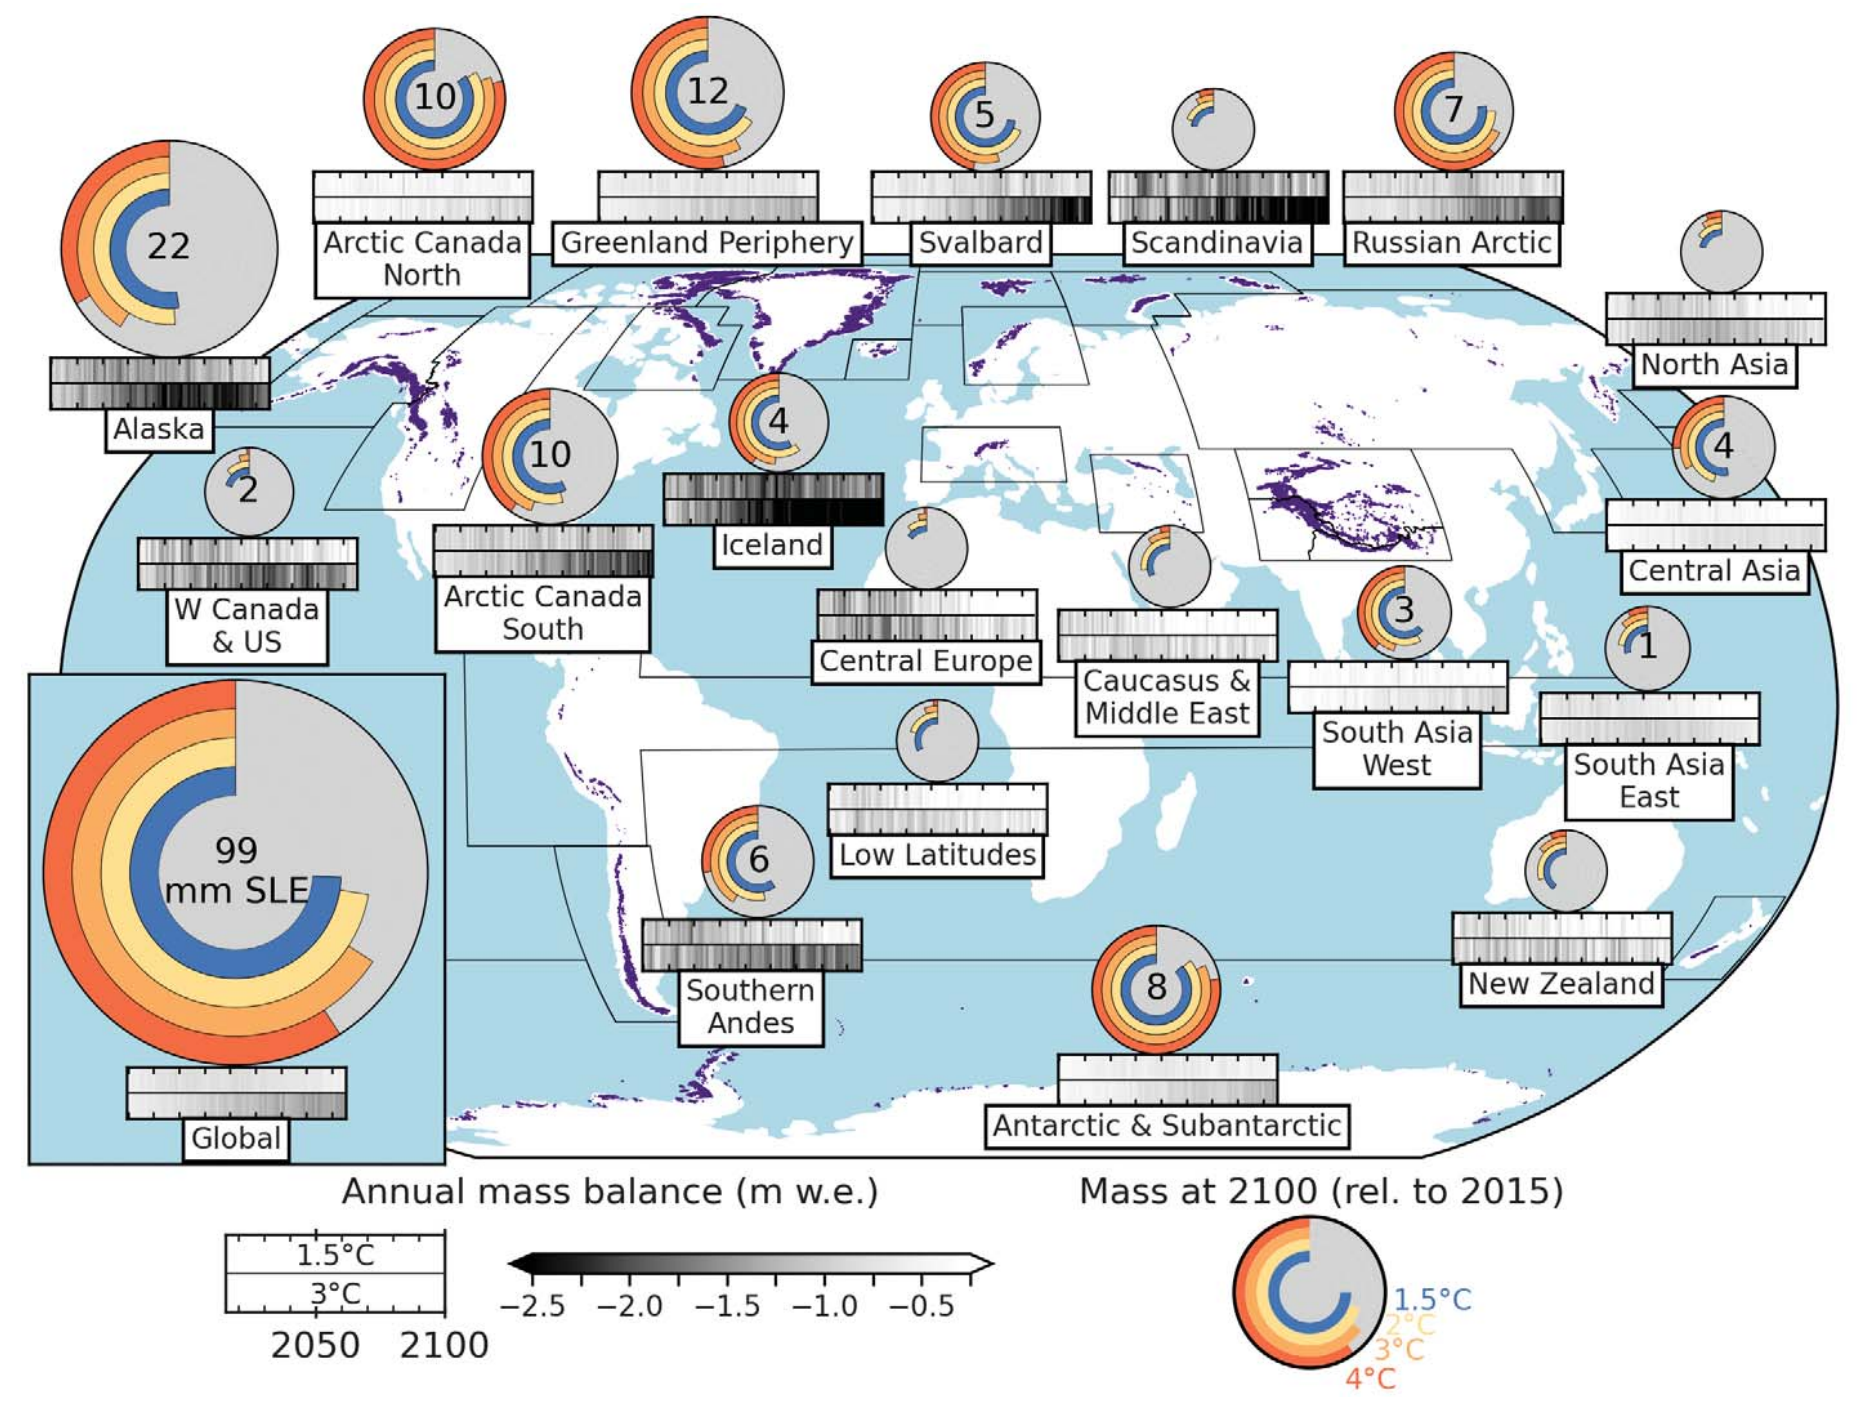
By Phoebe Weston 5 January 2023 (The Guardian) – Half the planet’s glaciers will have melted by 2100 even if humanity sticks to goals set out in the Paris climate agreement, according to research that finds the scale and impacts of glacial loss are greater than previously thought. At least half of that loss will happen […]

Social media & sharing icons powered by UltimatelySocial