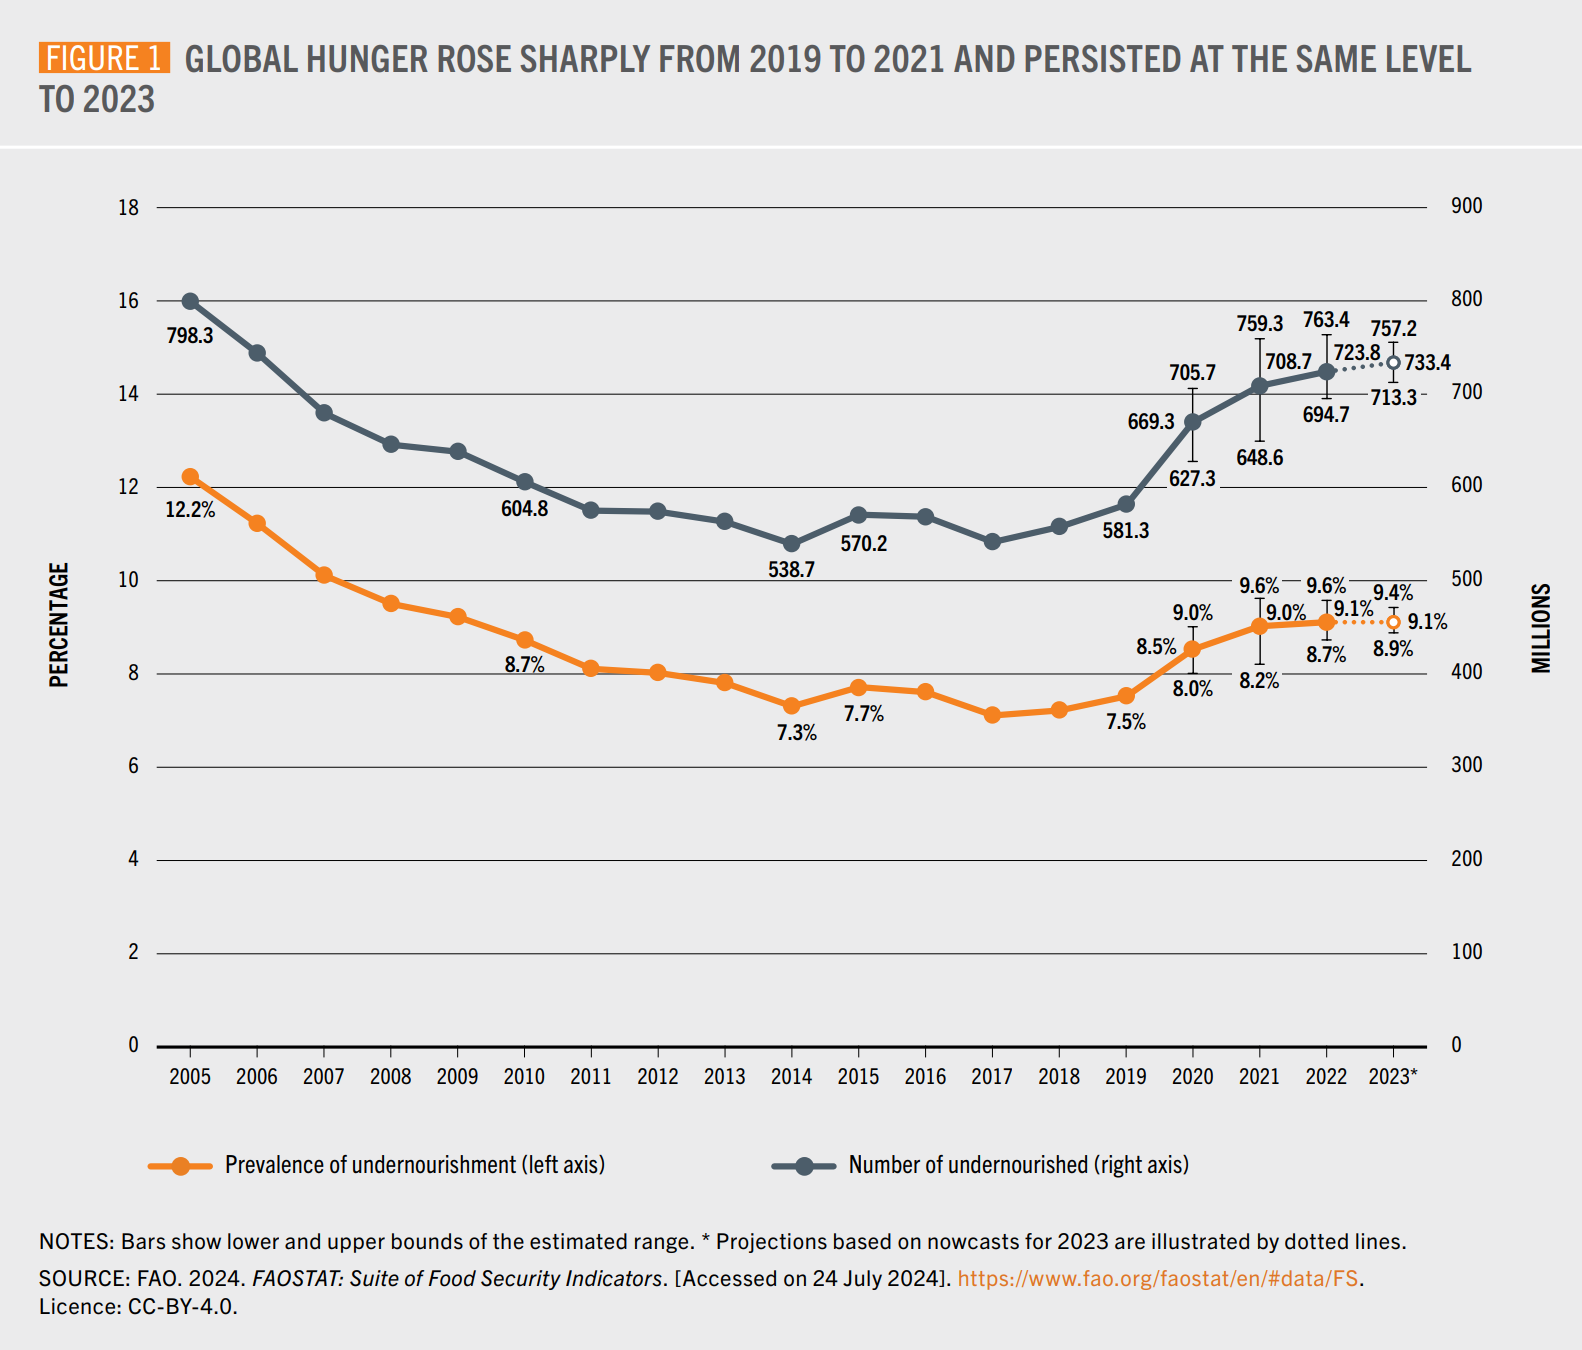
30 September 2024 (World Bank) – Domestic food price inflation remains high in many low- and middle-income countries. Inflation higher than 5 percent is experienced in 77.3 percent of low-income countries (18.2 percentage points higher since the last Update on June 27, 2024), 54.3 percent of lower-middle-income countries (8.7 percentage points lower), 44% of upper-middle-income […]
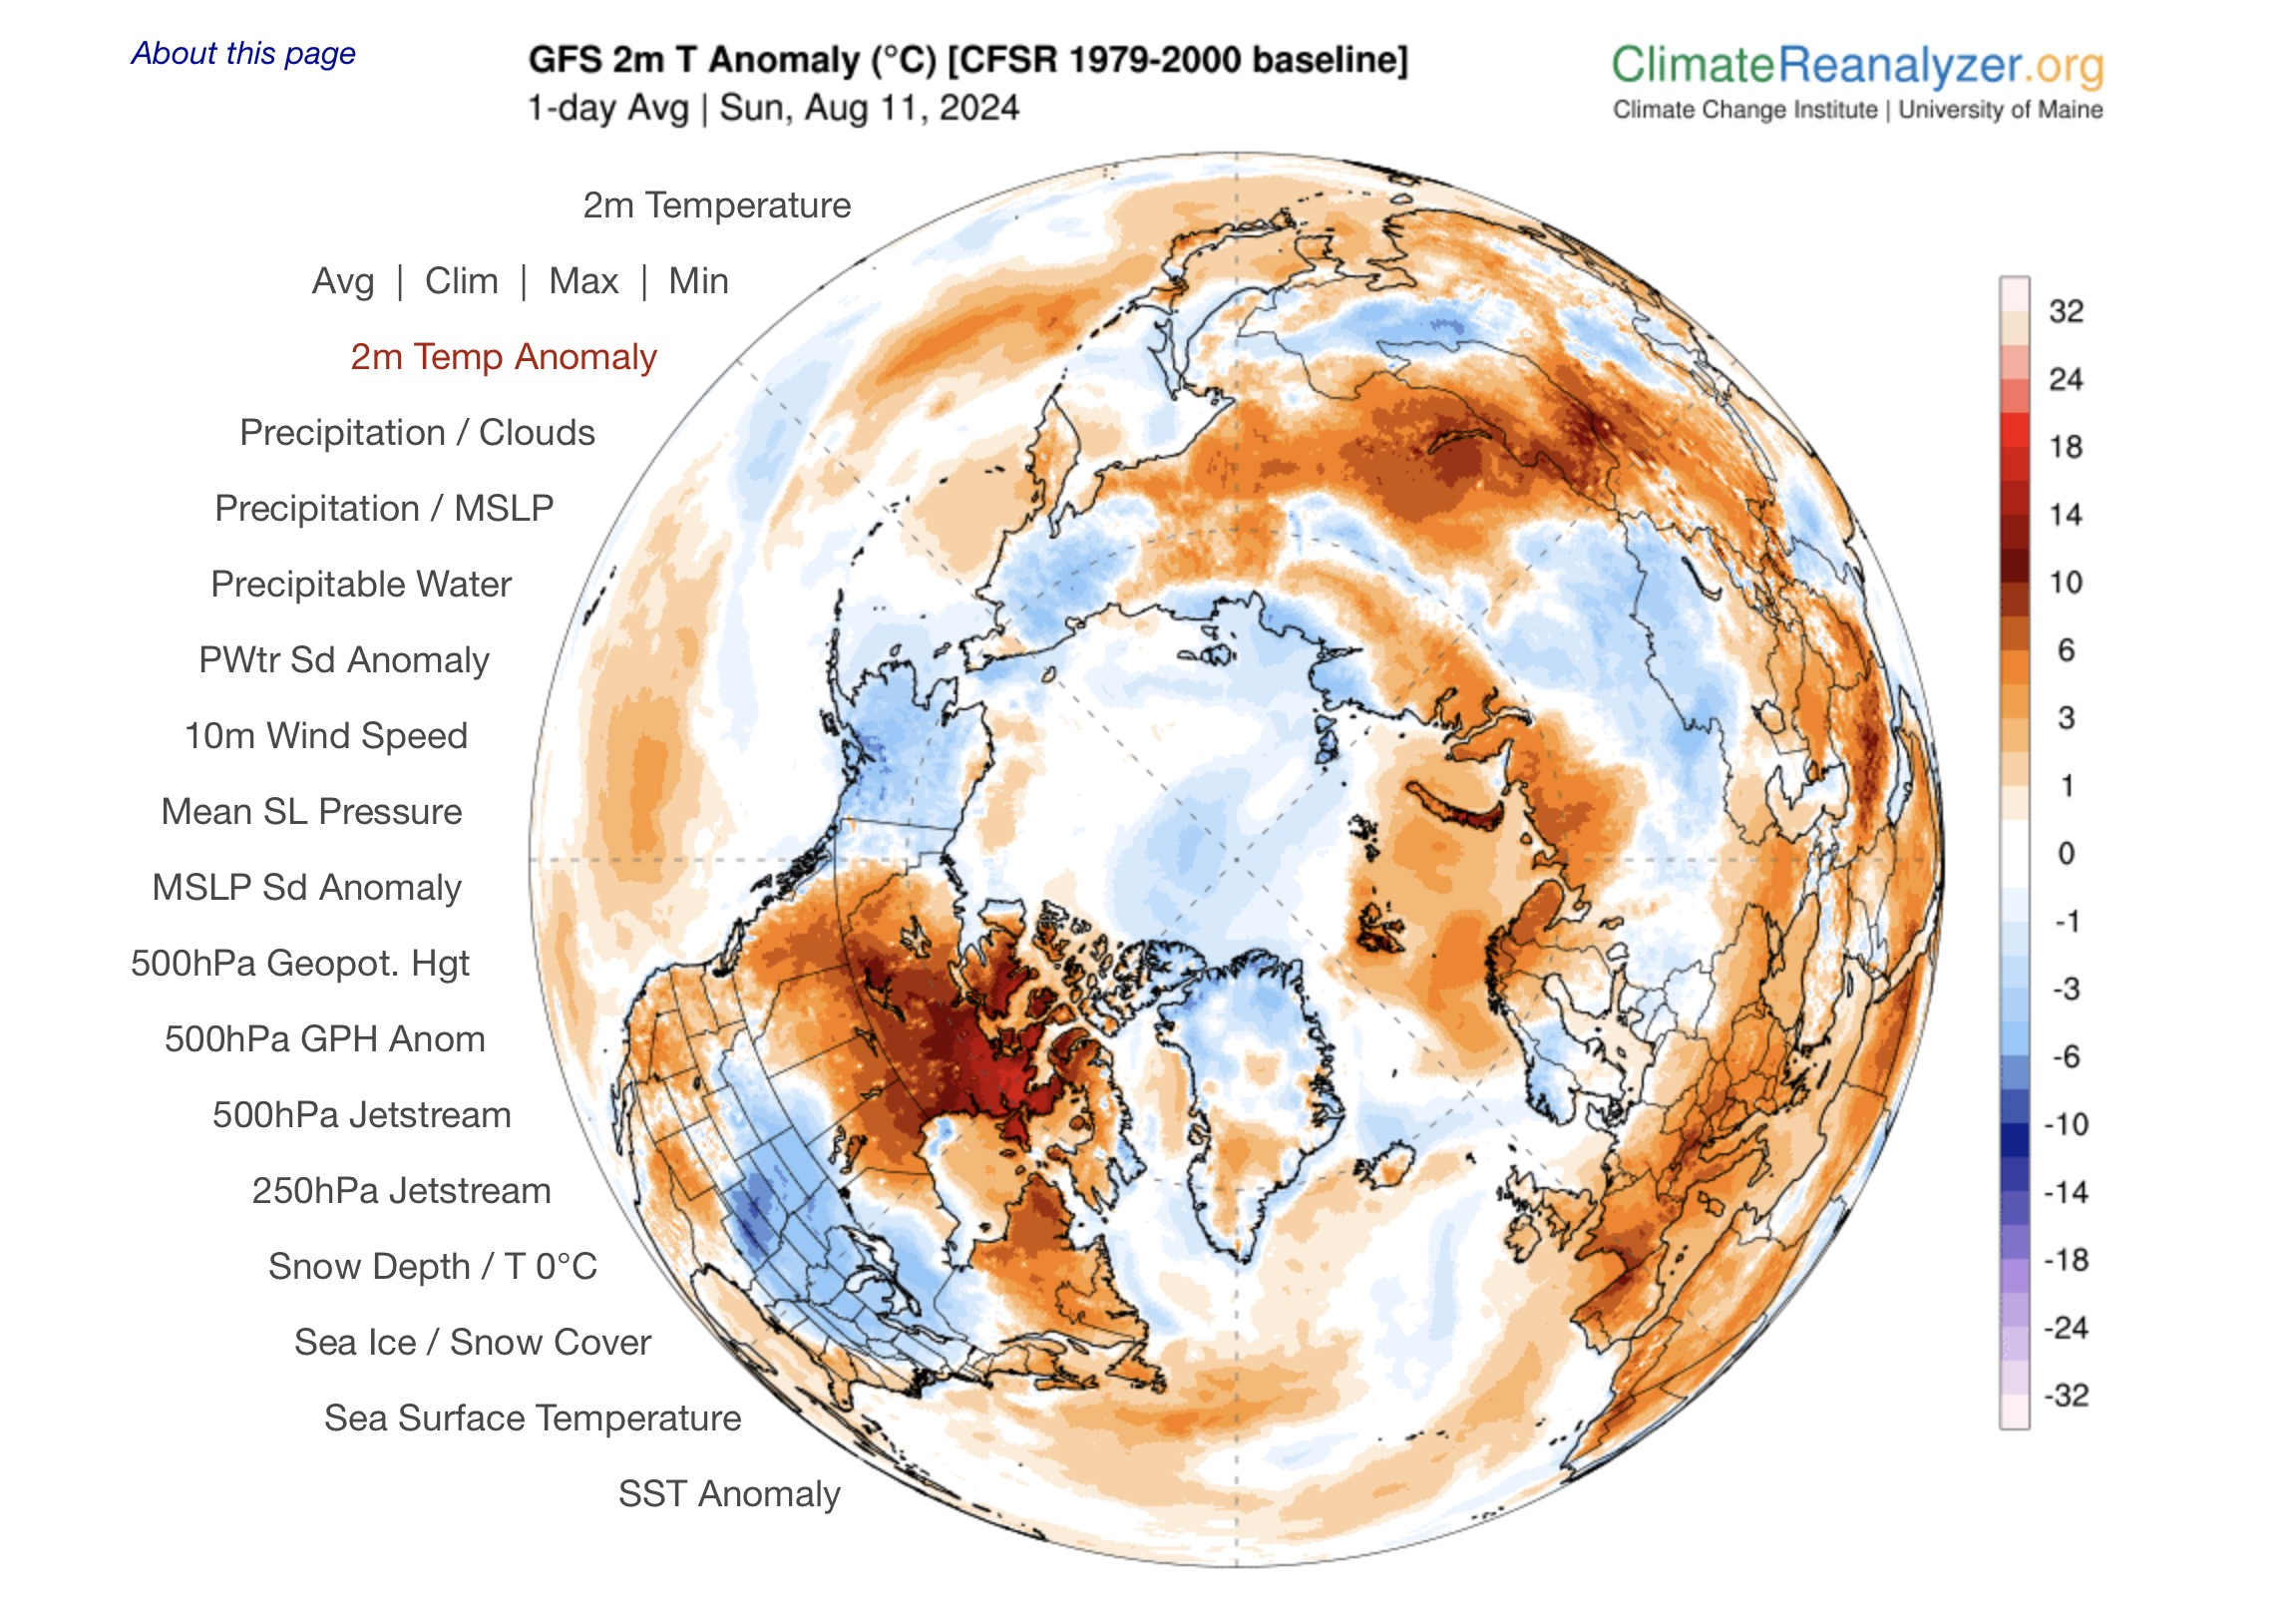
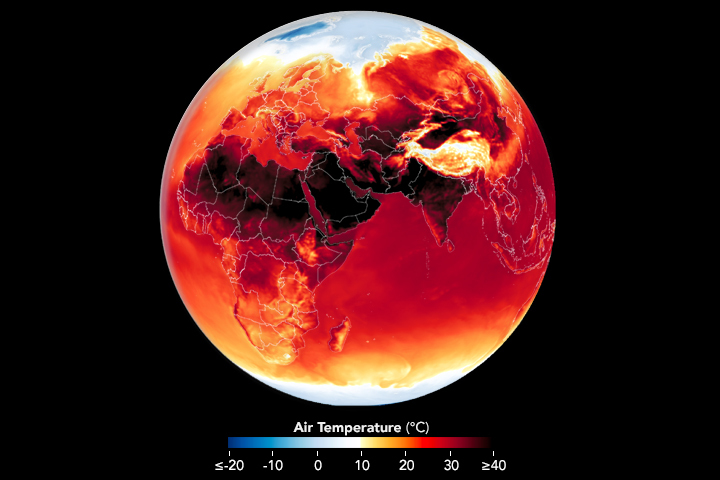
By Jonathan Watts 14 August 2024 (The Guardian) – A record 15 national heat records have been broken since the start of this year, an influential climate historian has told the Guardian, as weather extremes grow more frequent and climate breakdown intensifies. An additional 130 monthly national temperature records have also been broken, along with […]
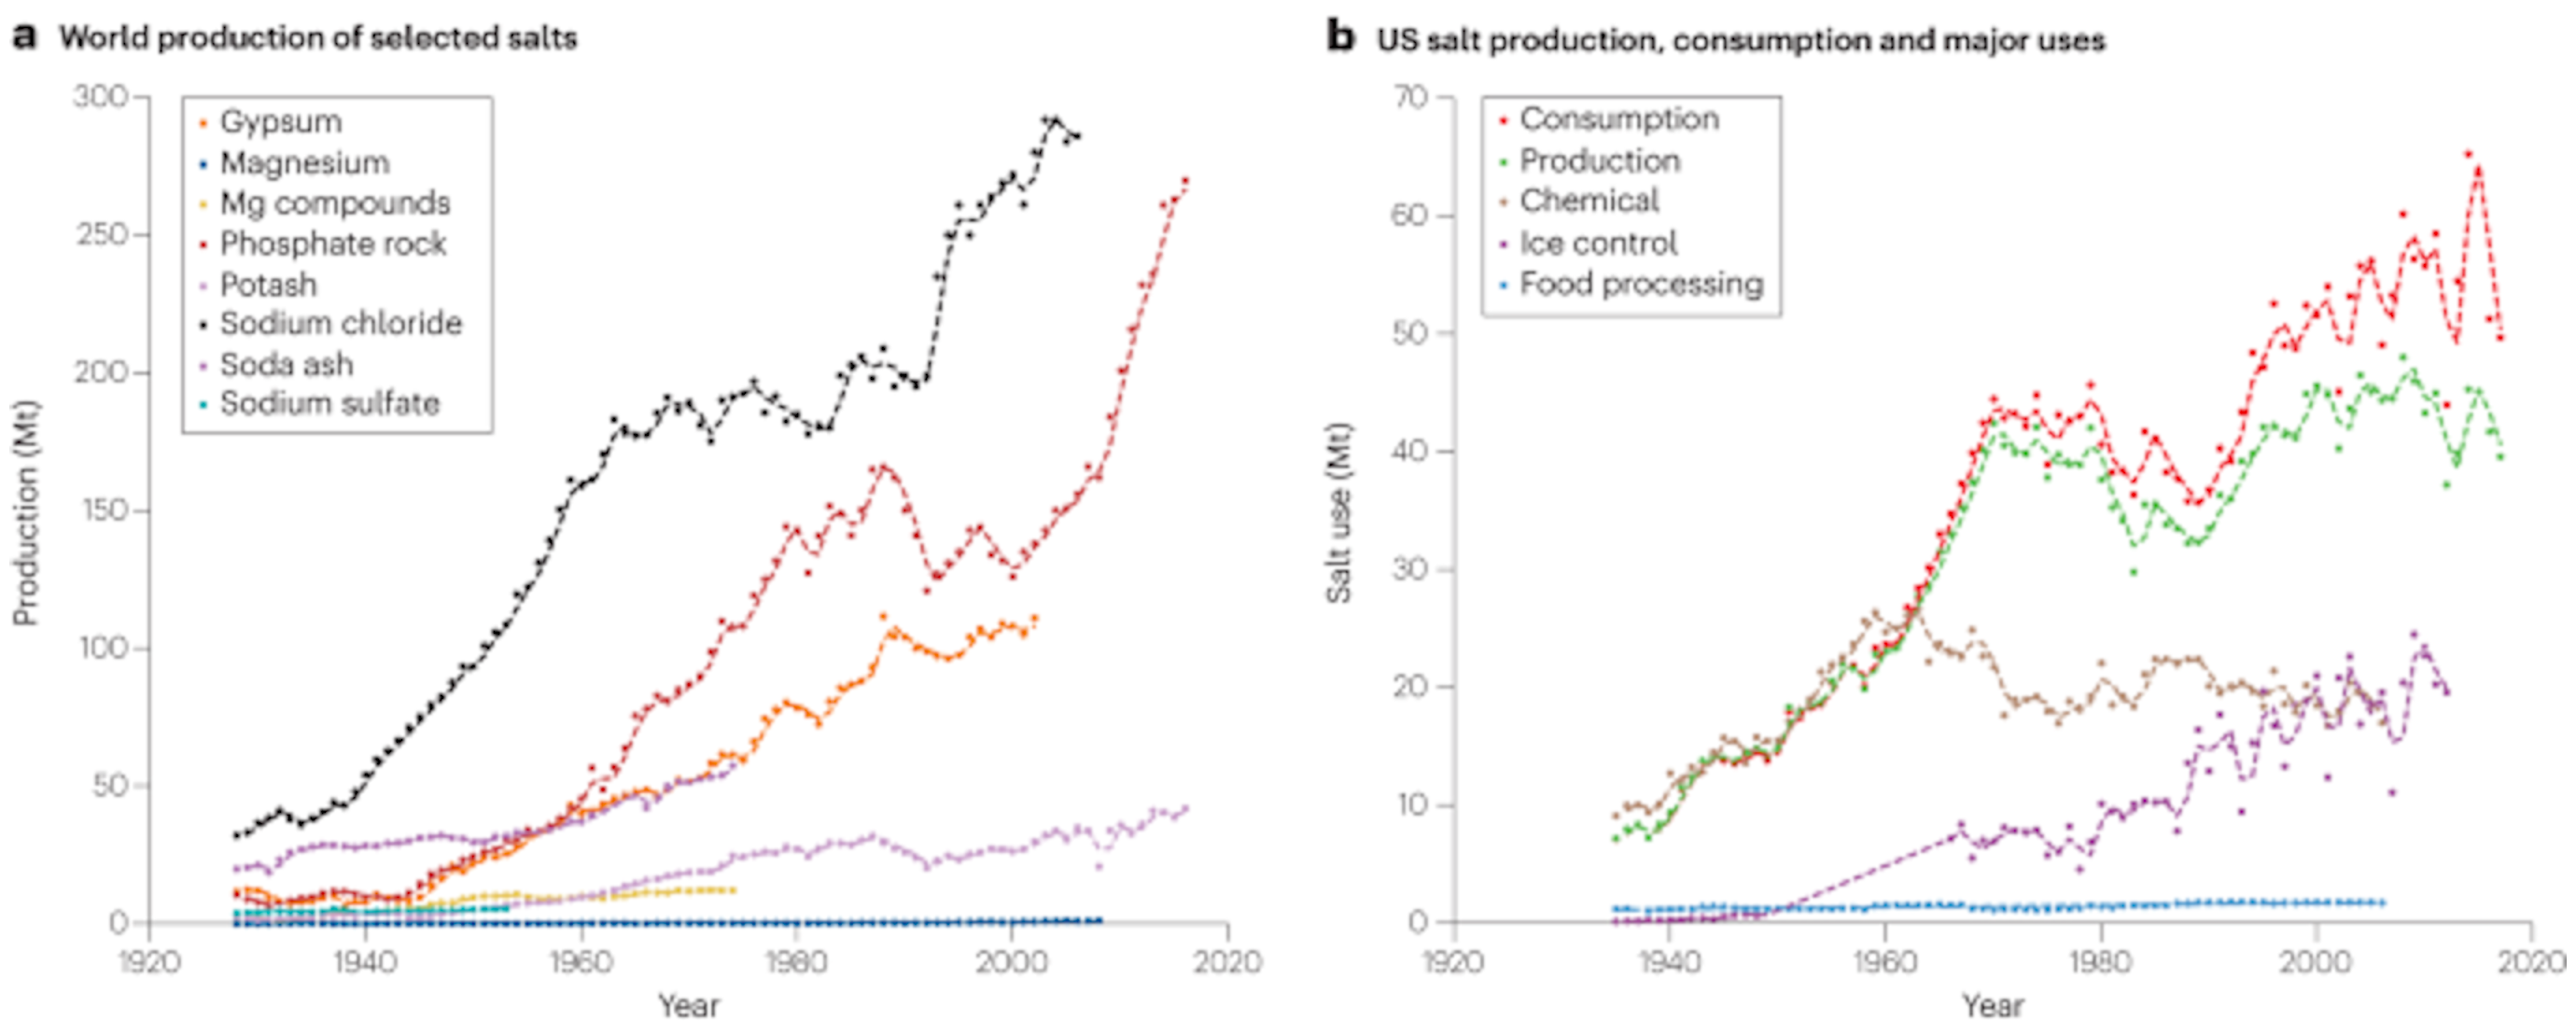
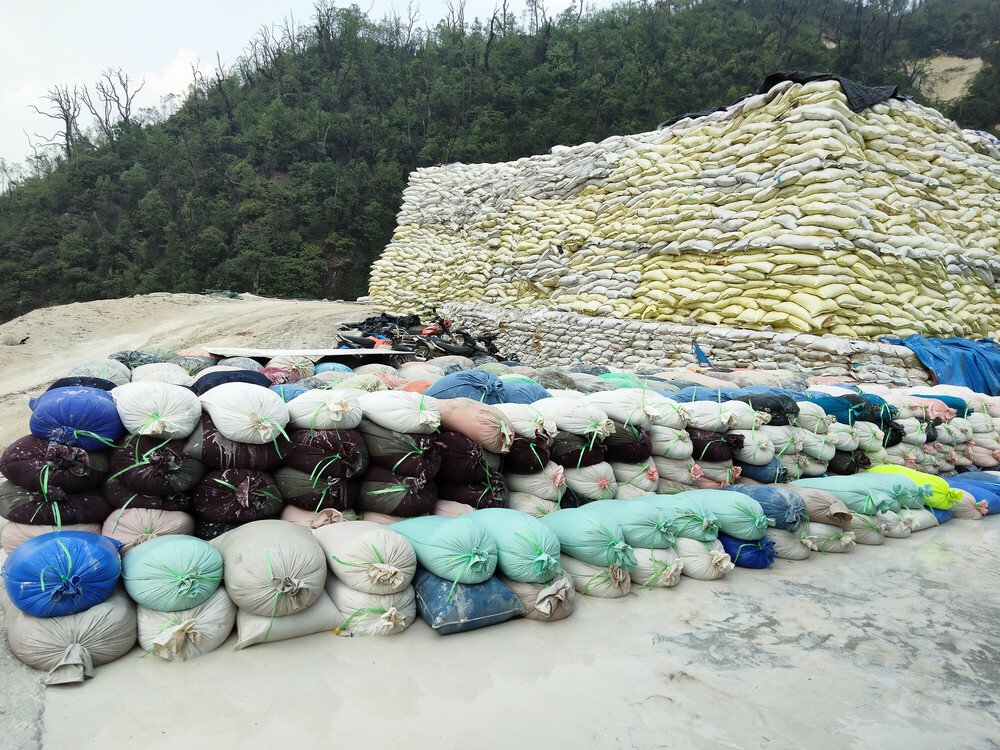
31 October 2023 (University of Maryland) – The influx of salt in streams and rivers is an ‘existential threat,’ according to a research team led by a UMD geologist. The planet’s demand for salt comes at a cost to the environment and human health, according to a new scientific review led by University of Maryland Geology Professor Sujay Kaushal. Published […]
10 July 2024 (Global Witness) – Renewable energy is often hailed as a panacea for the energy crisis. But without better consultation and regulation, plans to expand mining for minerals central to the energy transition could be disastrous for people and the planet. To tackle the climate crisis, we need to transition away from fossil […]
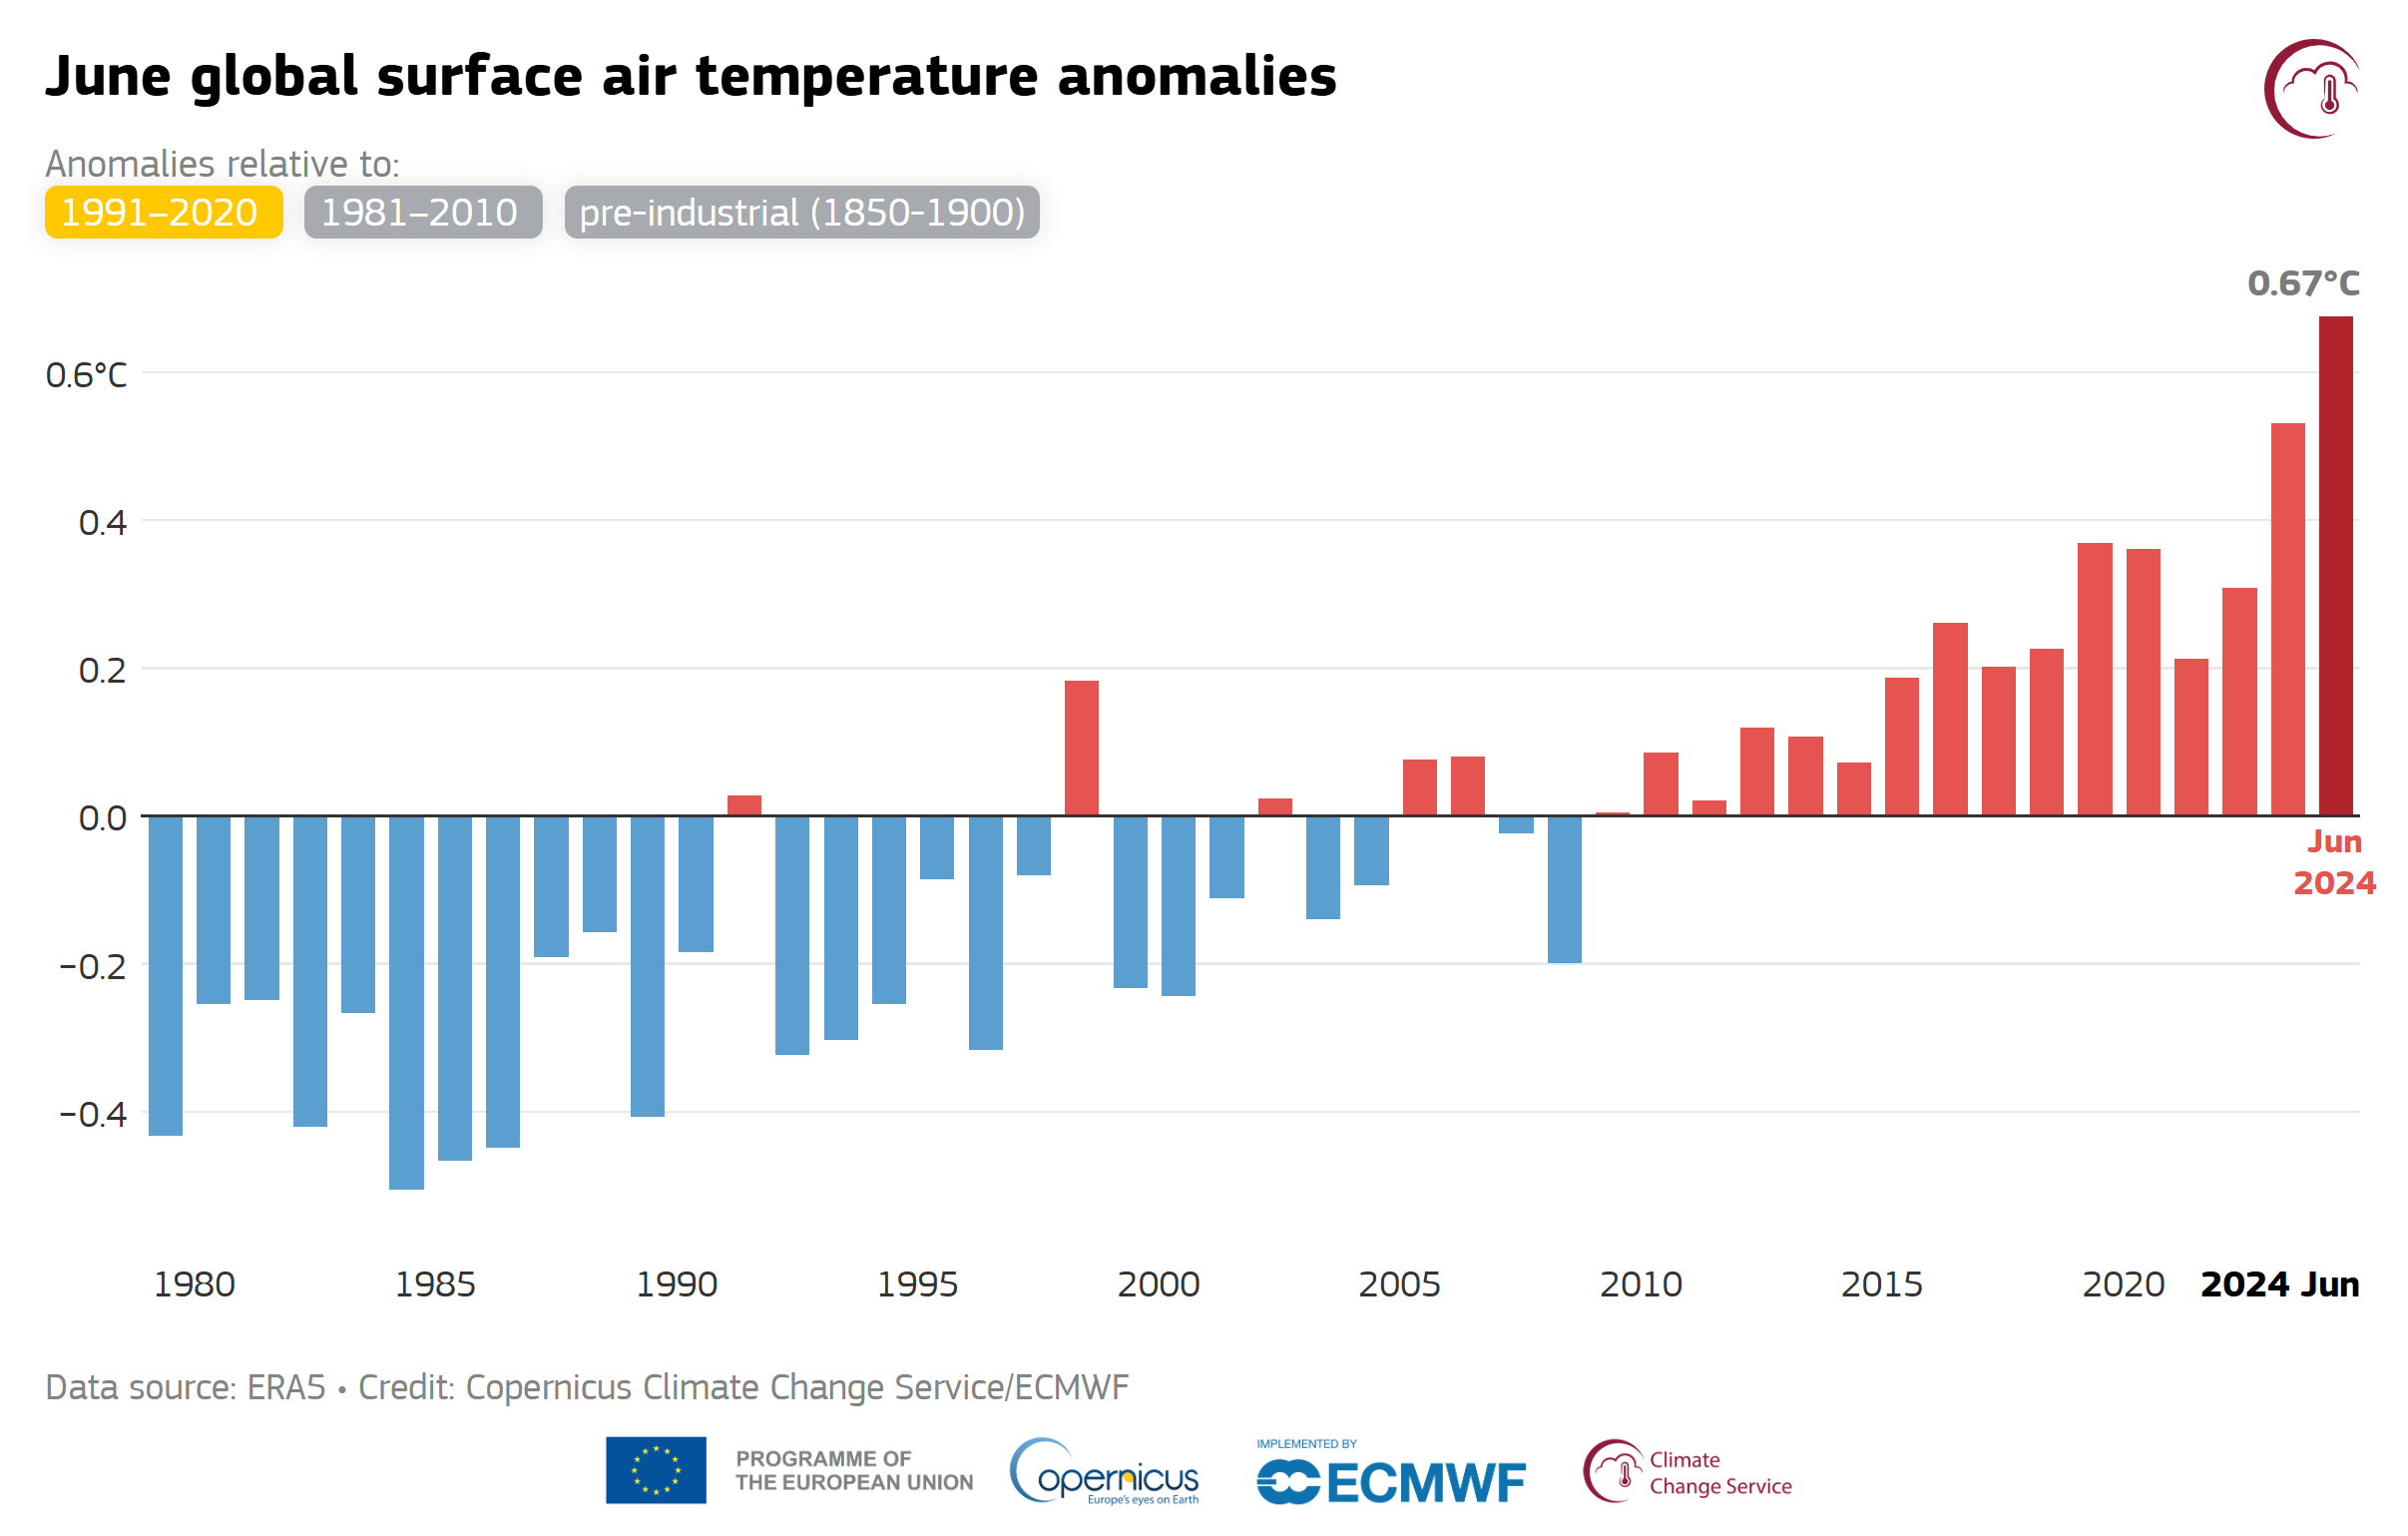
By Seth Borenstein 7 July 2024 (AP) – Earth’s more than year-long streak of record-shattering hot months kept on simmering through June, according to the European climate service Copernicus. There’s hope that the planet will soon see an end to the record-setting part of the heat streak, but not the climate chaos that has come […]
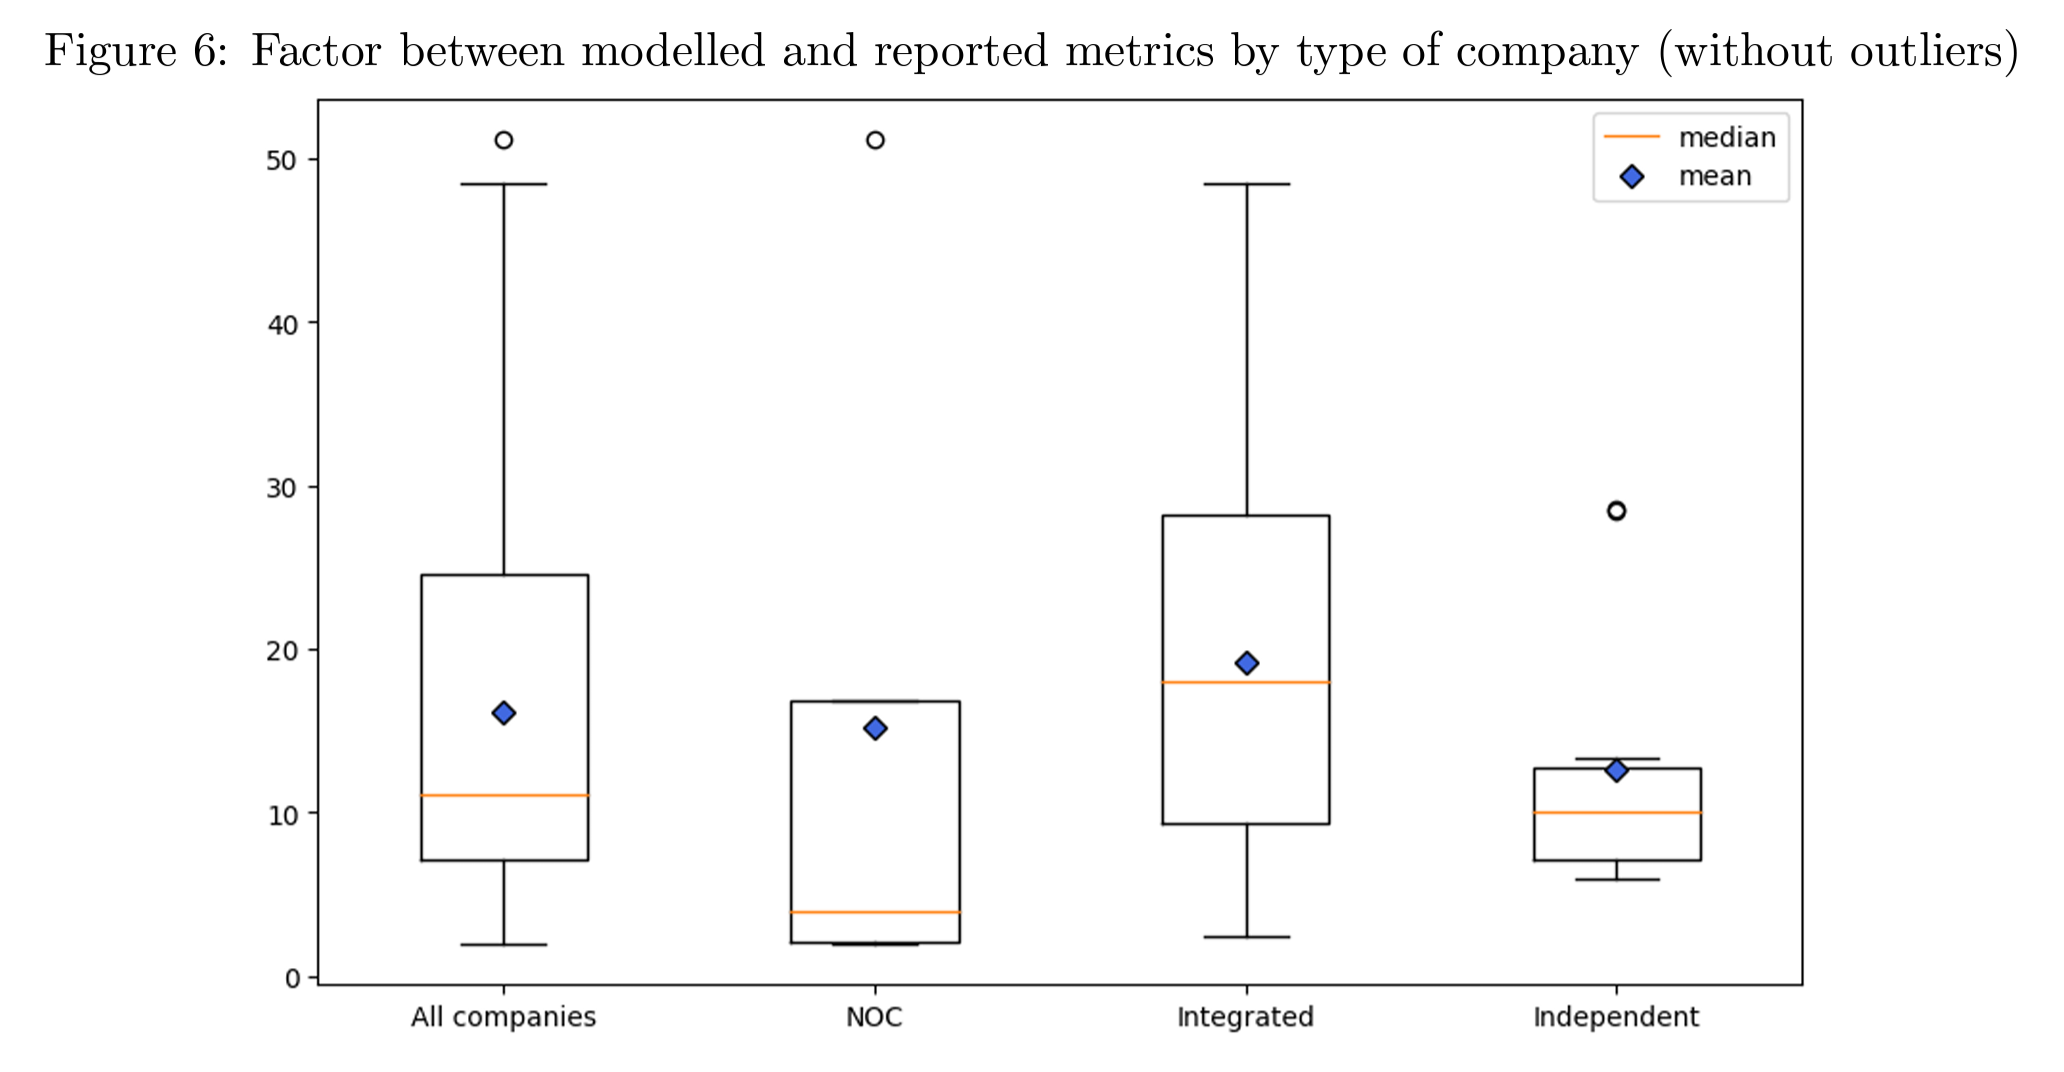
By Antoine Rostand 17 July 2024 (Fortune) – Committing countries or companies to climate pledges doesn’t guarantee that those pledges will be honored. After all, the planet is getting a great deal hotter every year, with the record-breaking temperature in India in May just the latest example. If companies and countries were fully honoring their […]
By Adam Voiland 28 June 2024 (NASA) – It’s only the beginning of the summer season in the Northern Hemisphere, but Earth is already roasting. Scientists from NASA’s Goddard Institute for Space Studies recently reported that May 2024, the hottest May in NASA’s global surface temperature analysis, marked a full year of record-high monthly temperatures. Likewise, NOAA recently reported that January through […]
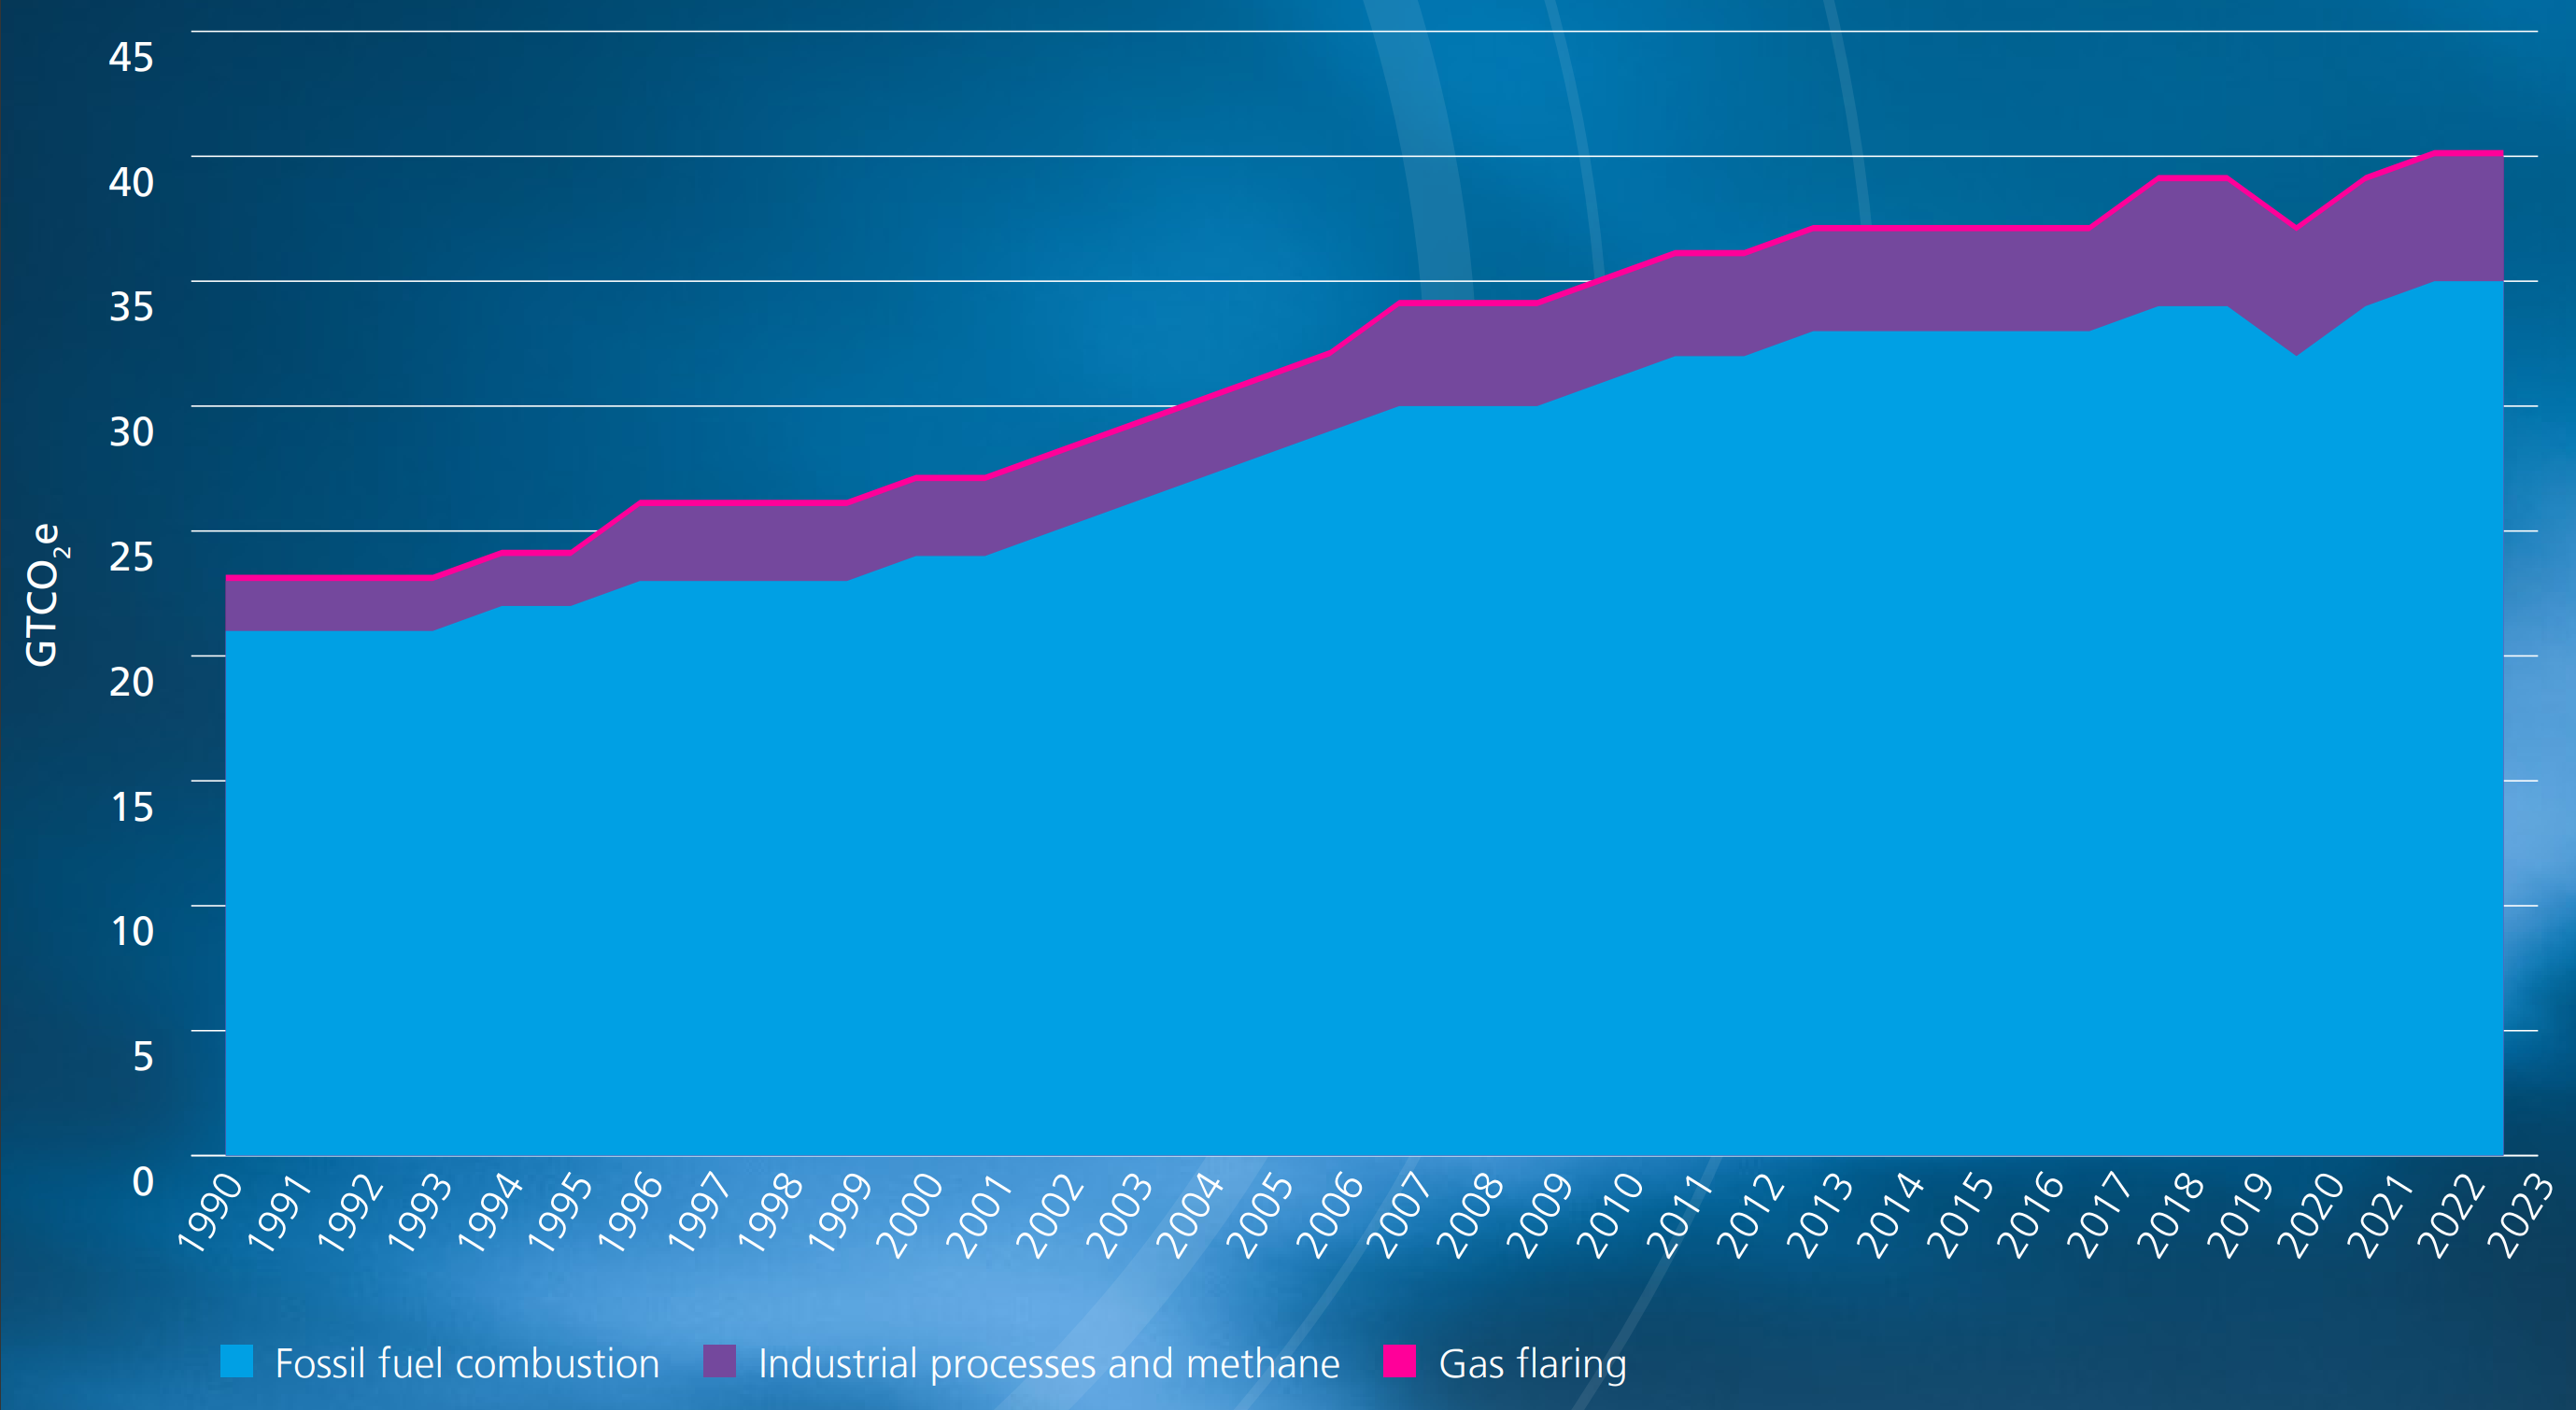
20 June 2024 (Energy Institute) – The Energy Institute (EI) and co-authors KPMG and Kearney today released the 73rd annual edition of the Statistical Review of World Energy, presenting for the first time full global energy data for 2023. Five key stories emerge from the 2023 data: EI President Juliet Davenport OBE HonFEI said: “Energy is central […]
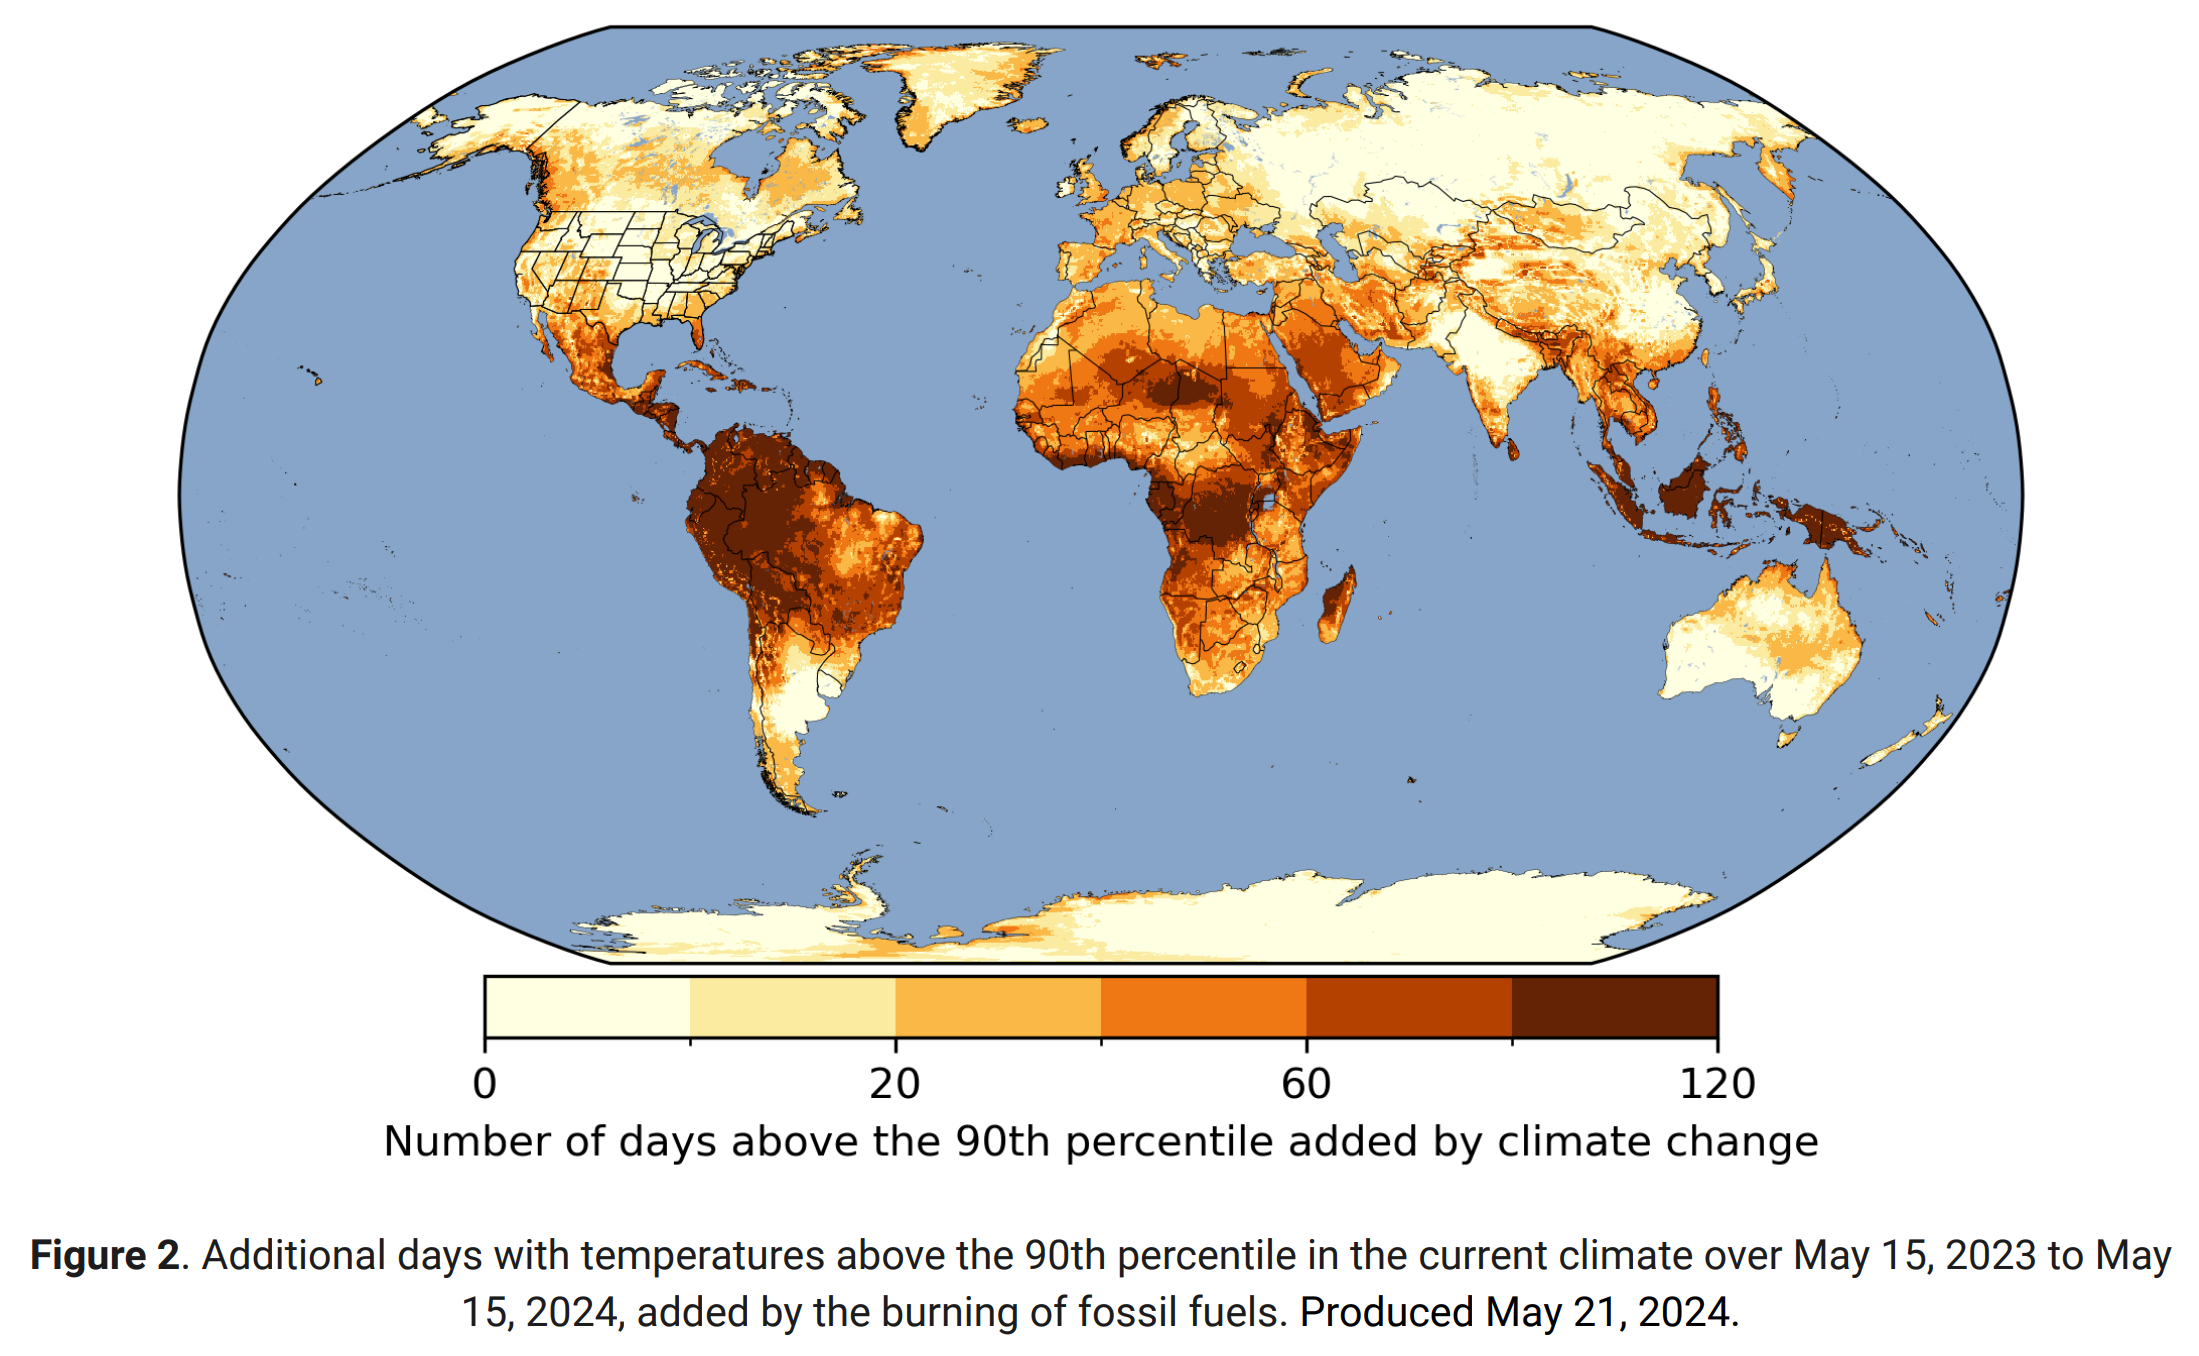
By Raymond Zhong 28 May 2024 (The New York Times) – Over the past year of record-shattering warmth, the average person on Earth experienced 26 more days of abnormally high temperatures than they otherwise would have, were it not for human-induced climate change, scientists said Tuesday [Climate change and the escalation of global extreme heat […]
By Carlos Mureithi 23 May 2024 NAIROBI, Kenya (AP) – The impact of the calamitous rains that struck East Africa from March to May was intensified by a mix of climate change and rapid growth of urban areas, an international team of climate scientists said in a study published Friday. The findings come from World Weather Attribution, […]