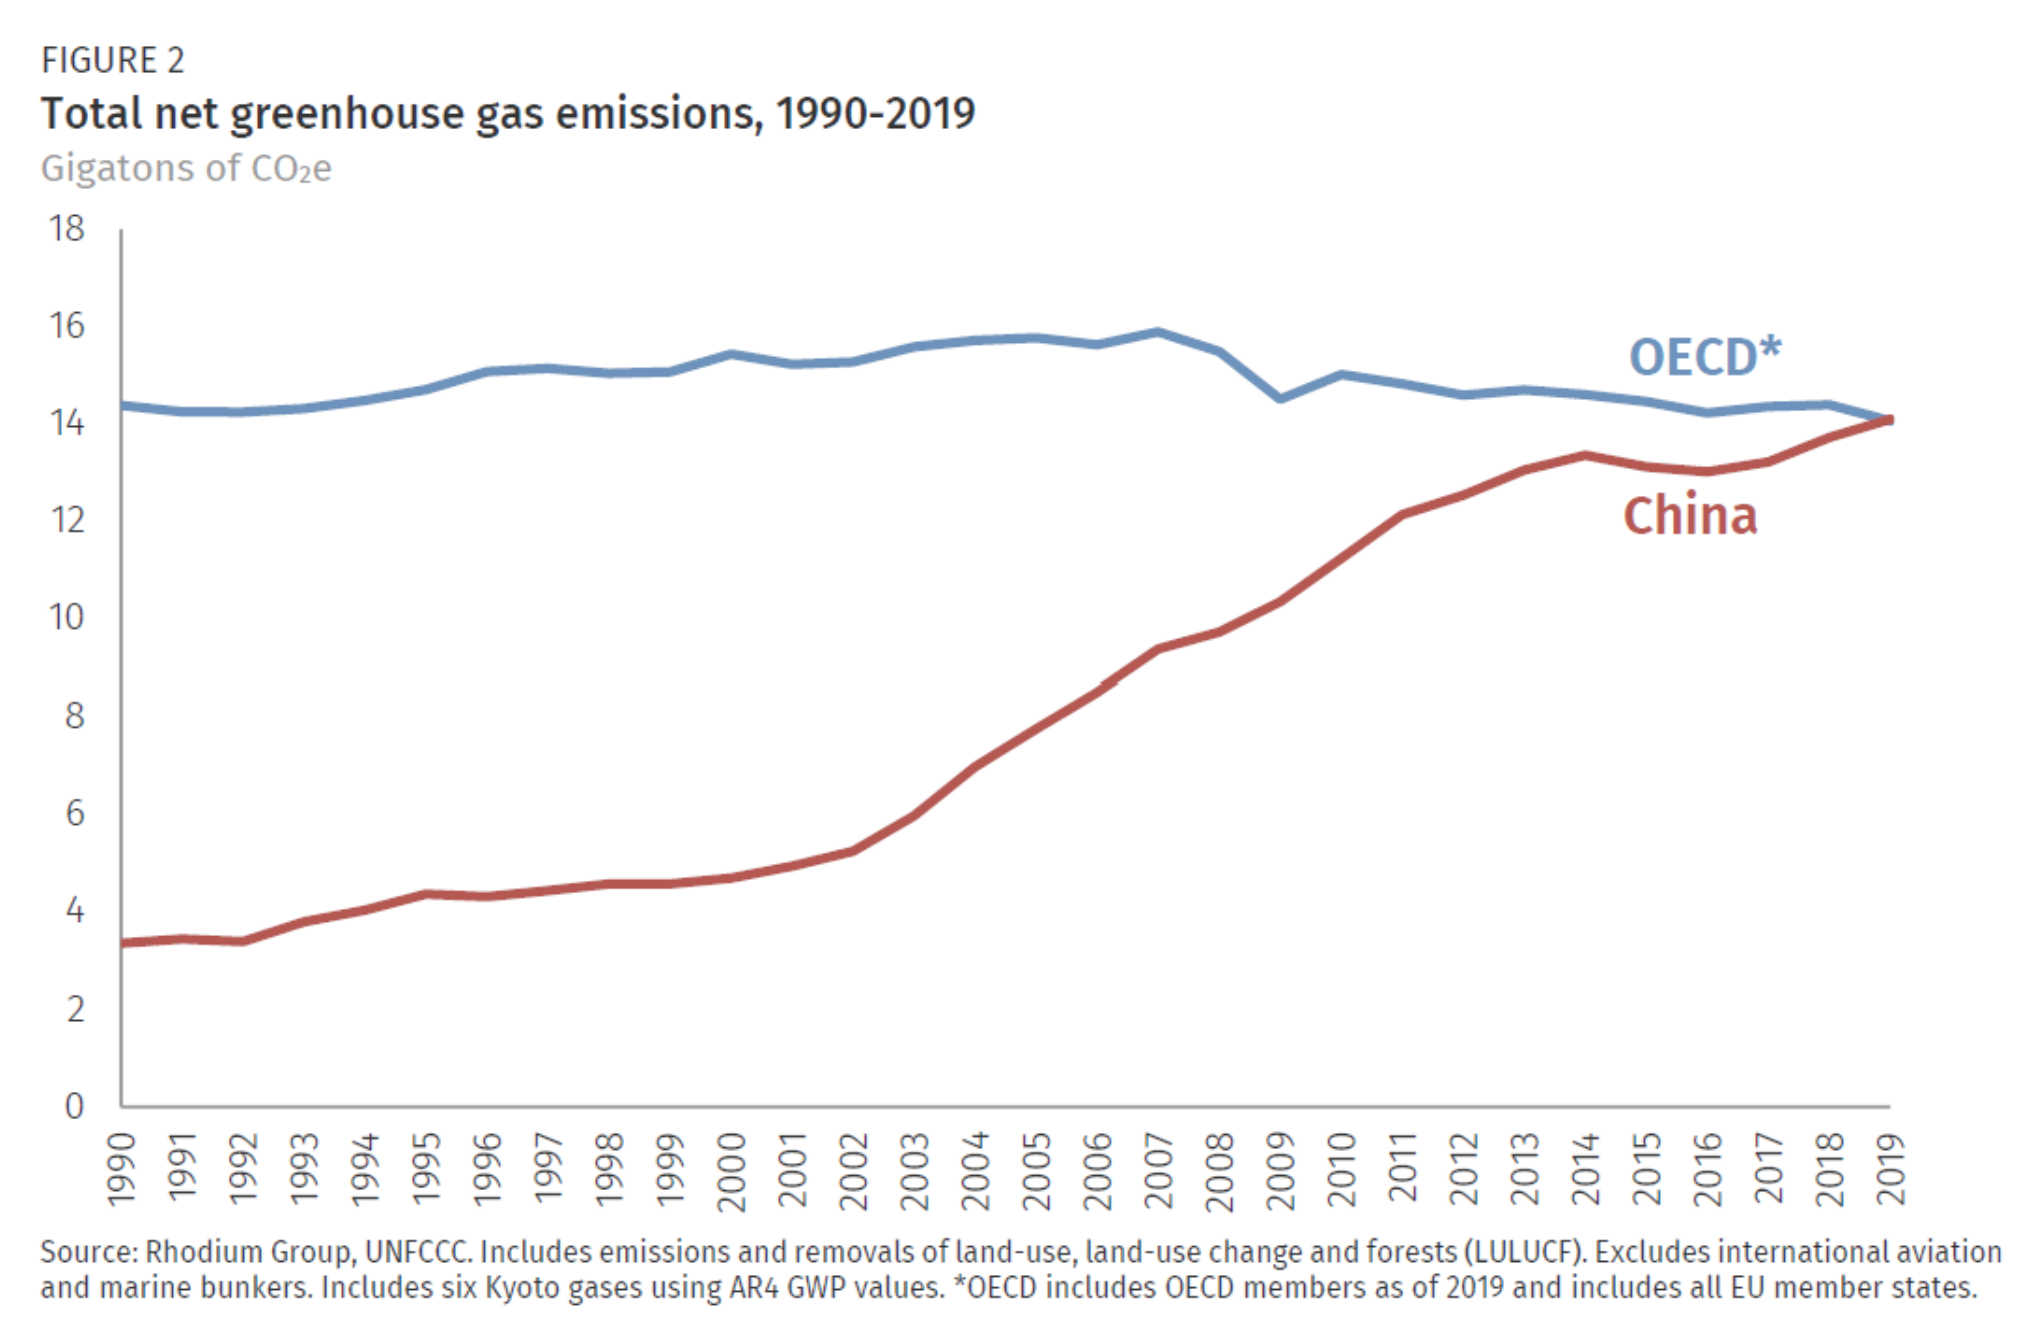
A Geiger counter shows a radiation level of 231 microsieverts per hour near the damaged No. 3 reactor building at the tsunami-crippled Fukushima Daiichi nuclear power plant in Okuma town, Fukushima prefecture, Japan, 1 March 2021. Photo: Sakura Murakami / REUTERS

Ten years on, Japan mourns victims of earthquake and “profoundly man-made” Fukushima disaster

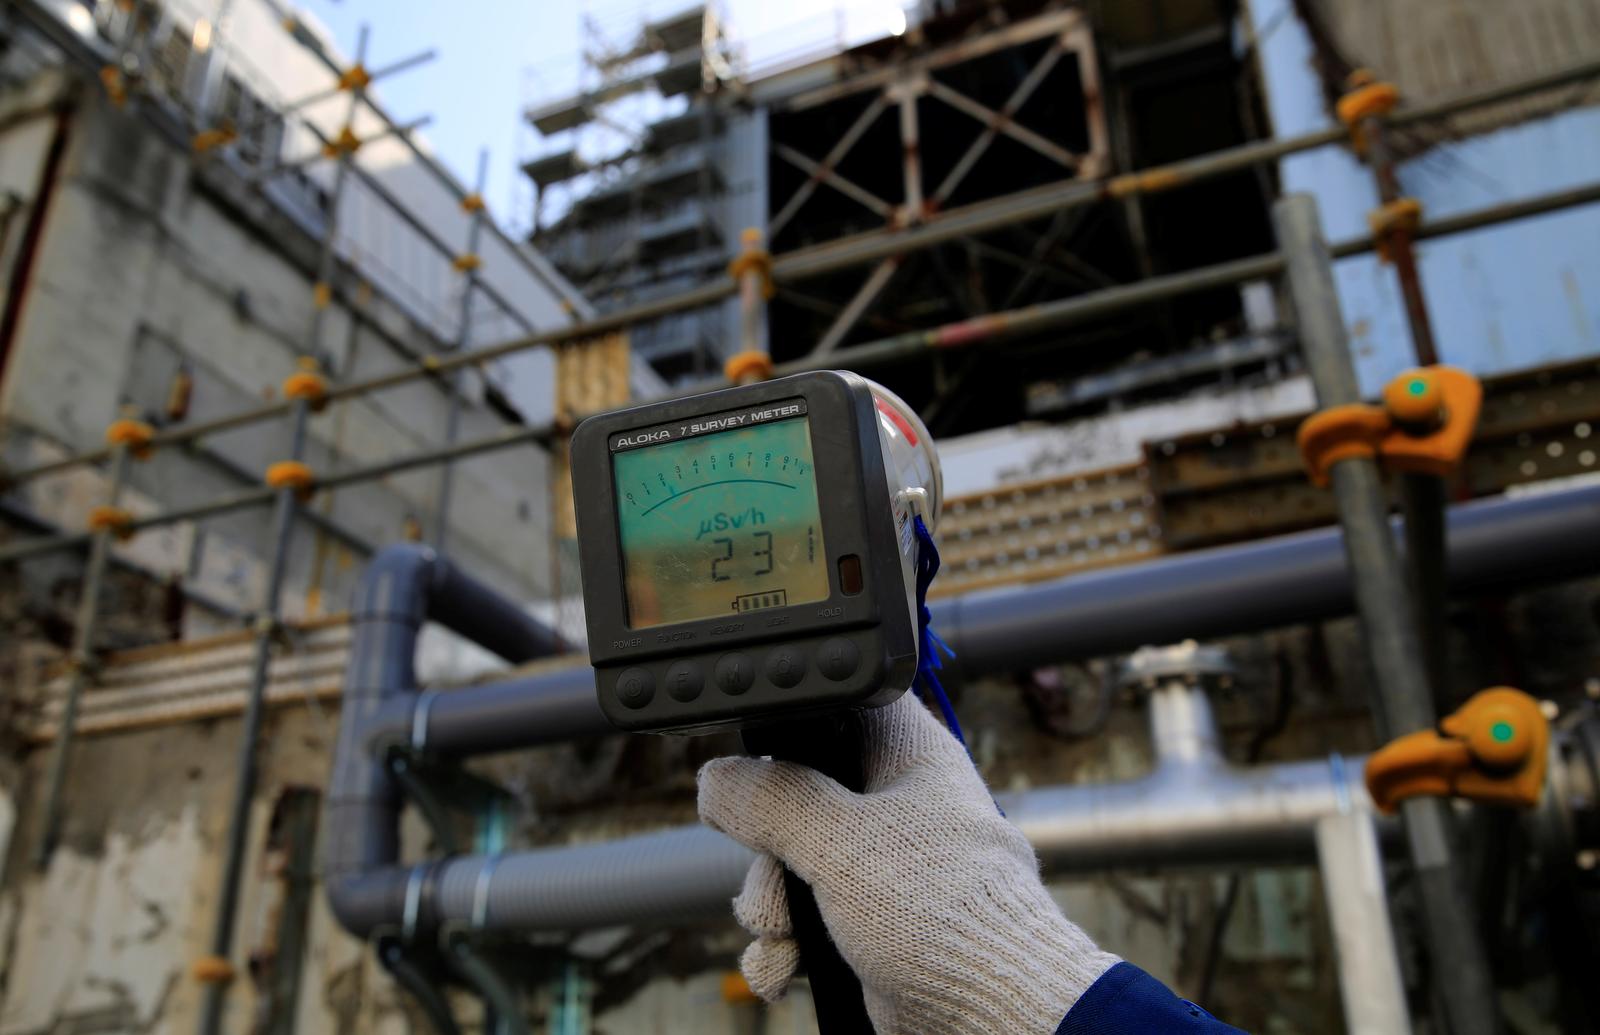
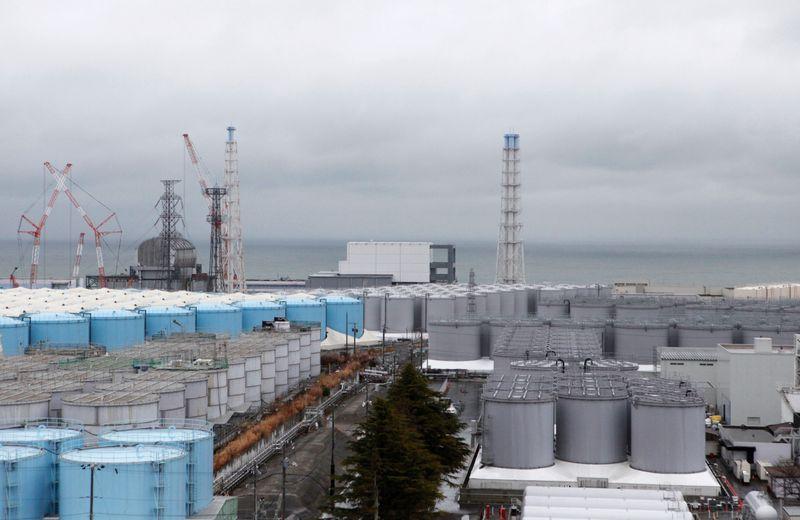
By Eimi Yamamitsu 10 March 2021 IWAKI, Japan (Reuters) – With a moment of silence, prayers, and anti-nuclear protests, Japan on Thursday mourned about 20,000 victims of the massive earthquake and tsunami that struck Japan 10 years ago, destroying towns and triggering nuclear meltdowns in Fukushima. Huge waves triggered by the 9.0-magnitude quake – one […]

Video clip showing a cloudburst and flooding, shown in Aon’s “Weather, Climate and Catastrophe Insight: 2020 Annual Report”. Video: Aon

2020 was costliest year on record for severe convective storms – U.S. hit by record-breaking 12 named storm landfalls – China saw most widespread Yangtze River floods since 1998

CHICAGO, 25 January 2021 (Aon) – Aon plc (NYSE: AON), a leading global professional services firm providing a broad range of risk, retirement, and health solutions, today launches its global Weather, Climate & Catastrophe Insight: 2020 Annual Report. The report evaluates the impact of global natural disaster events to identify trends, manage volatility and enhance resilience.   The report reveals […]

Infographic showing costs of natural disasters in 2020. Global losses from natural disasters in 2020 came to US$210 billion. The hurricane season in the North Atlantic was hyperactive, with a record-setting 30 storms, 13 of which reached hurricane status. Graphic: Munich Re

Global natural disaster figures for 2020 – “The hurricane season in the North Atlantic was hyperactive”

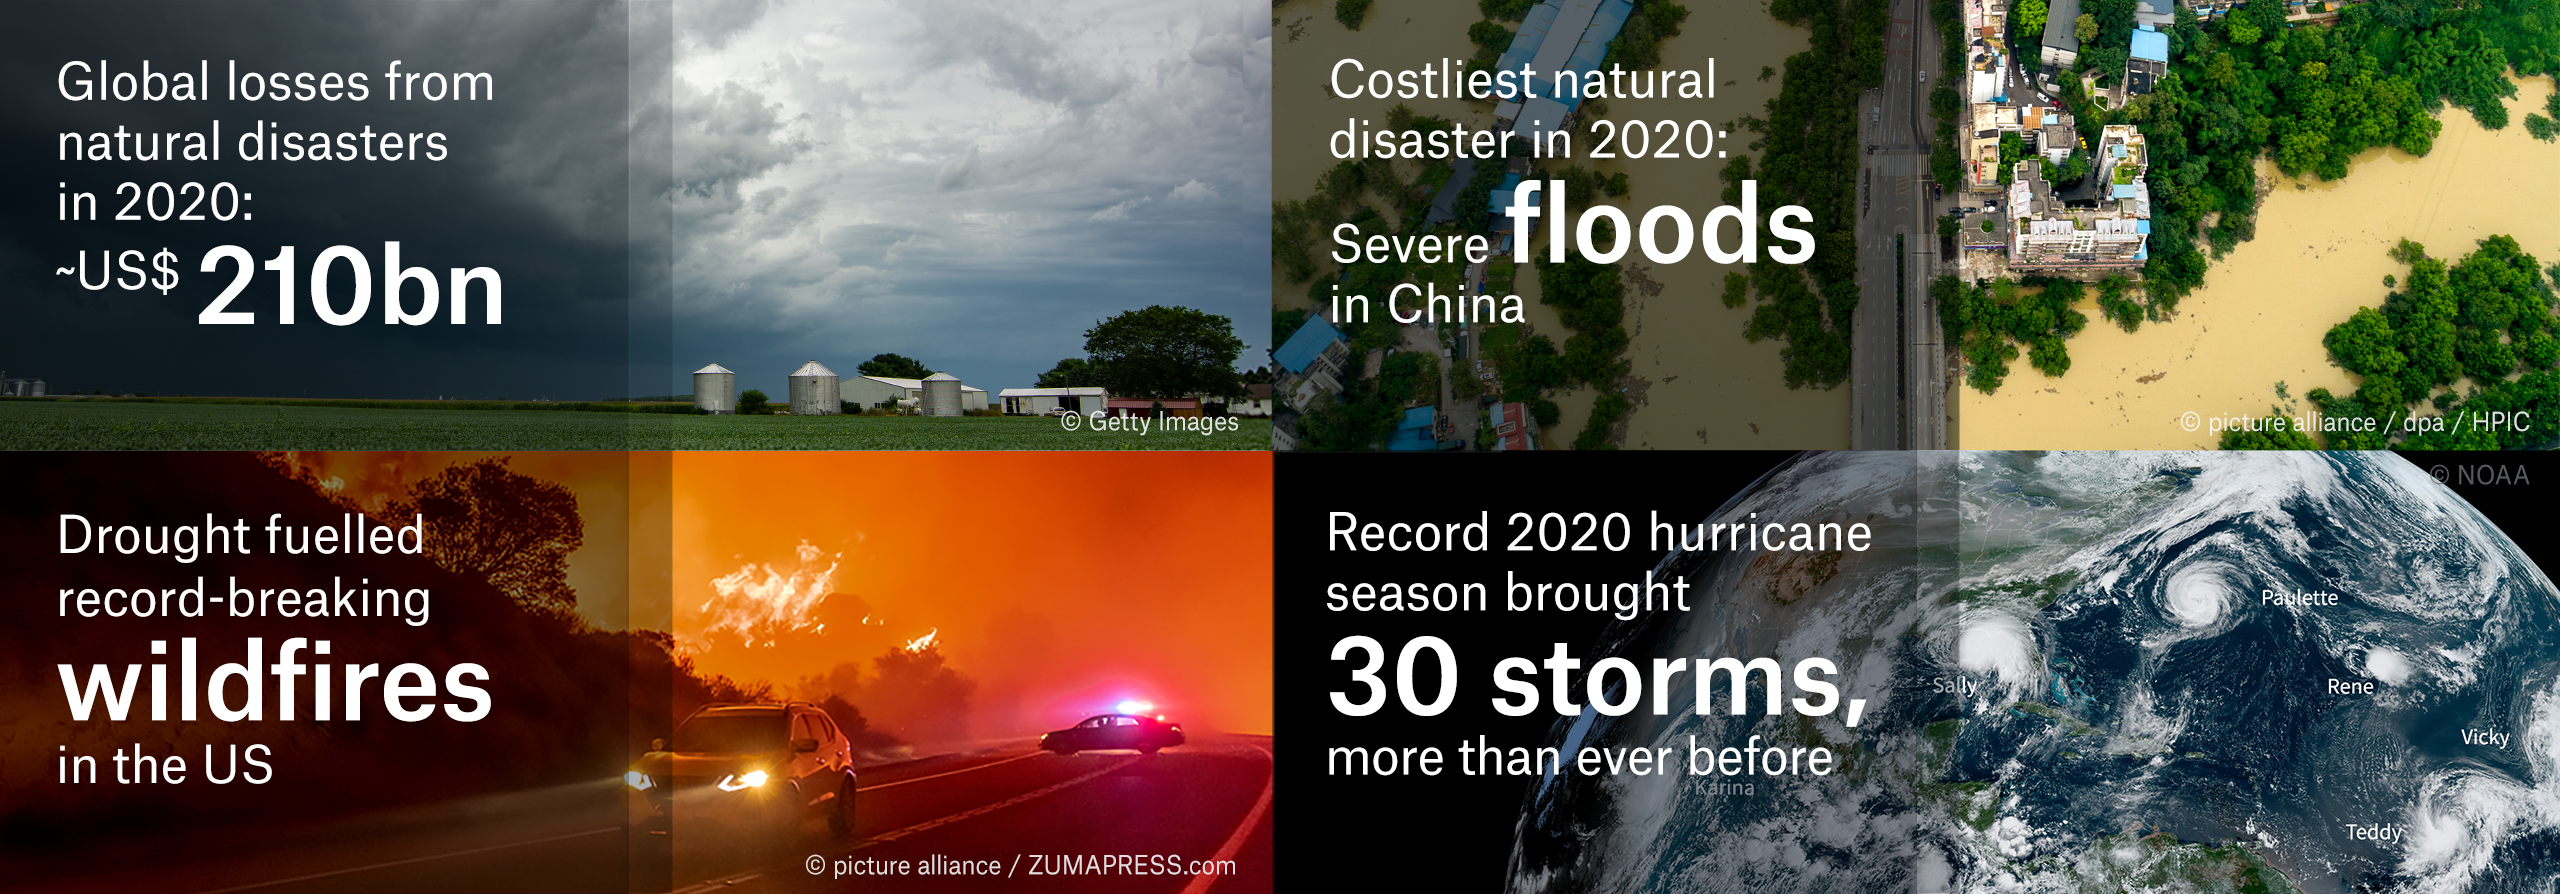
7 January 2021 (Munich Re) – Global losses from natural disasters in 2020 came to US$ 210bn, of which some US$ 82bn was insured. Both overall losses and insured losses were significantly higher than in the previous year (2019: US$ 166bn and US$ 57bn respectively).  The US share of losses was rather high: Natural disasters in the […]

Distribution of major tax cuts for the rich across OECD nations, 1965-2015. This figure visualizes the resulting binary variable that picks out years in which taxes on the rich were reduced substantially. In total, we identify 30 country-year observations where taxes on the rich were significantly reduced. Governments enacted major tax reforms in all countries in our sample and across the whole observation period. Many countries implemented major tax cuts for the rich in the late 1980s. Furthermore, the identification of tax cuts is also in line with previous studies that have focused on income tax progressivity (Rubolino and Waldenström, 2020) or on overall tax progressivity single specific countries (Saez and Zucman, 2019). For instance, echoing these authors’ findings, we find two major reforms that reduced taxes on the rich in the US: 1982 (First Reagan Tax Cut) and 1986/1987 (Second Reagan Tax Cut). Graphic: Hope and Limberg, 2020 / LSE

Tax breaks for the rich don’t boost the economy – “Our research shows that the economic case for keeping taxes on the rich low is weak”

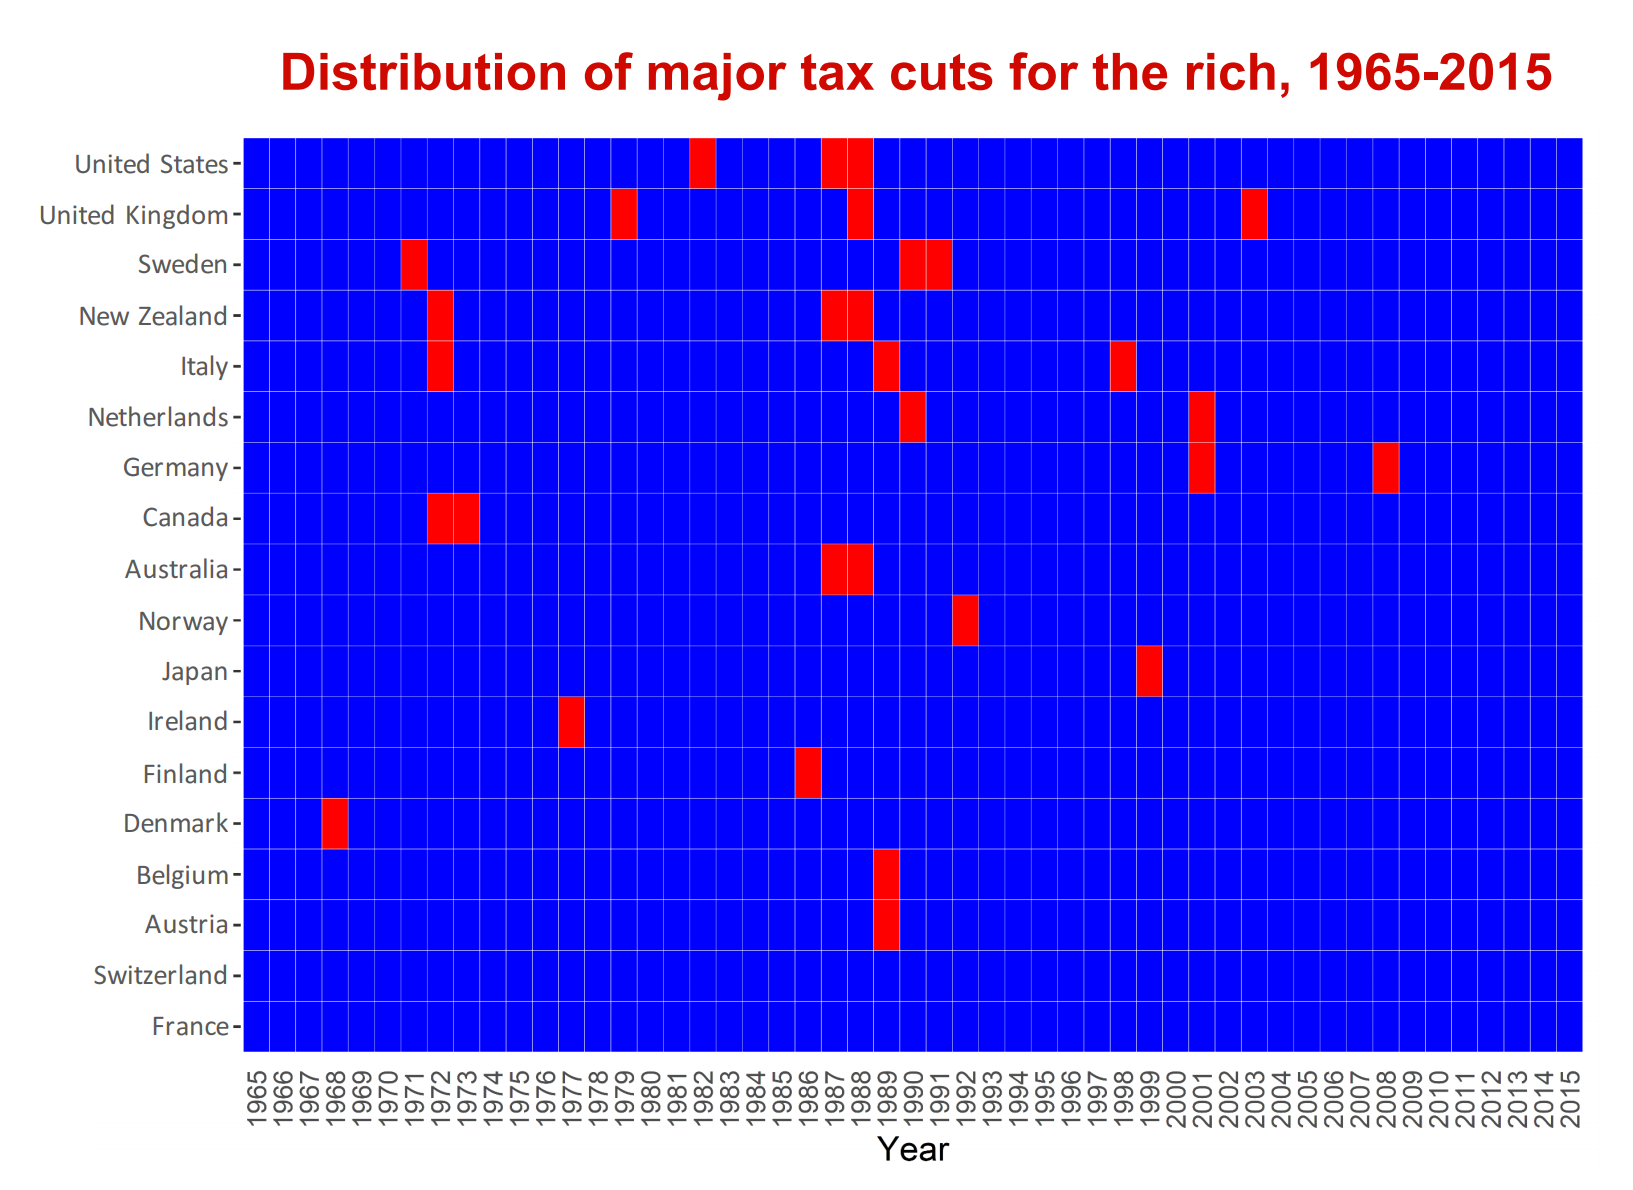
16 December 2020 (LSE) – Major reforms reducing taxes on the rich lead to higher income inequality but do not have any significant effect on economic growth or unemployment, according to new research by LSE and King’s College London. Researchers say governments seeking to restore public finances following the COVID-19 crisis should therefore not be […]

World consumption of primary energy in exajoules, 1994-2019. Primary energy consumption rose by 1.3 percent in 2019, less than half its rate in 2018 (2.8 percent). Growth was driven by renewables (3.2 EJ) and natural gas (2.8 EJ), which  together contributed three quarters of the increase. All fuels grew at a slower rate than their 10-year averages, apart from nuclear, with coal consumption falling for the fourth time in six years (-0.9 EJ). By region, consumption fell in North America, Europe and CIS, and growth was below average in South and Central America. In the other regions, growth was roughly in line with historical averages. China was the biggest individual driver of primary energy growth, accounting for more than three  quarters of net global growth. Oil continues to hold the largest share of the energy mix (33.1 percent). Coal is the  second largest fuel but lost share in 2019 to account for 27.0 percent, its lowest  level since 2003. The share of both natural gas and renewables rose to record highs of 24.2 percent and 5.0 percent respectively. Renewables has now overtaken nuclear, which makes up only 4.3 percent of the energy mix. The share of hydroelectricity has been stable at around 6 percent for several years. Graphic: BP

BP Statistical Review of World Energy 2020: Carbon emissions increase for another year, coal still the single largest source of power generation

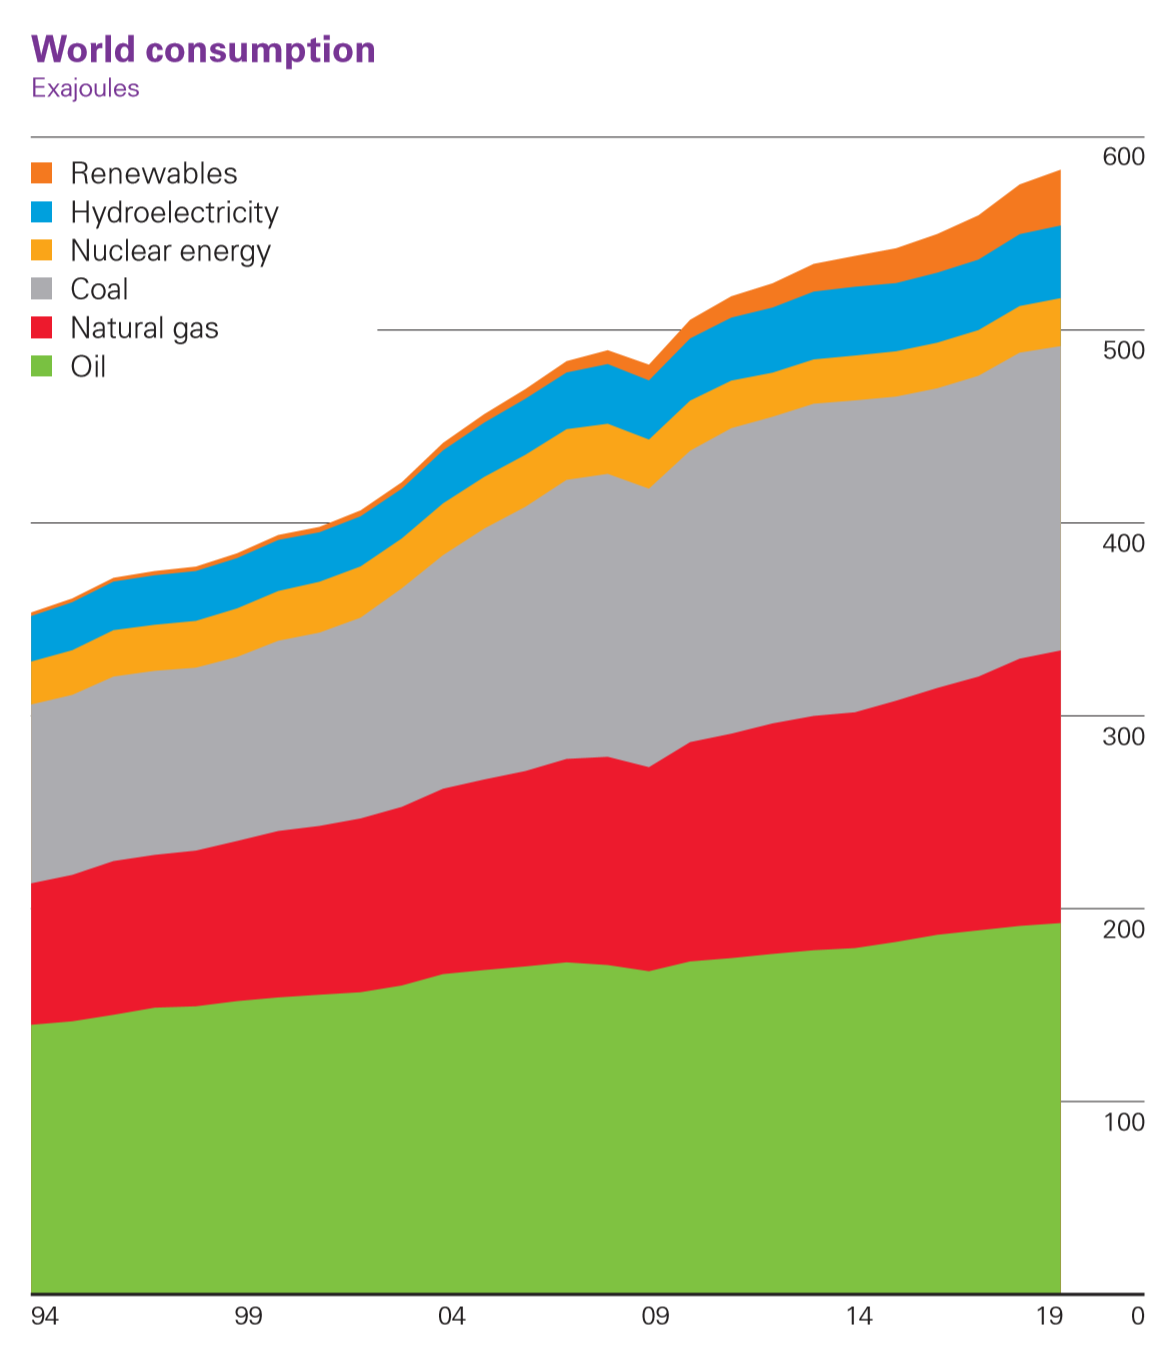
By Bernard Looney 17 June 2020 (BP) – The COVID-19 pandemic may well turn out to be the most tragic and disruptive event that many of us will ever live through. As I write this – in the middle of June – over 400 thousand people globally have lost their lives to the infection. Millions […]

Global real GDP level projected to 2021. The cumulative output loss is expected to reach $9 trillion. Graphic: IMF

IMF: Global economy will suffer worst year since Great Depression – “This is a crisis like no other”

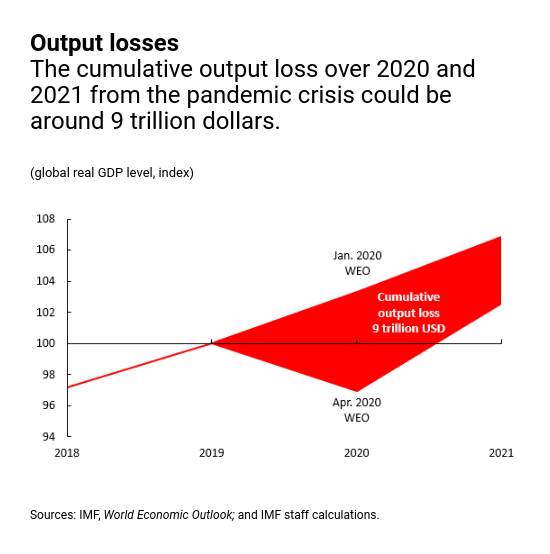
By Paul Wiseman and Martin Crutsinger 14 April 2020 WASHINGTON (AP) – Beaten down by the coronavirus outbreak, the world economy in 2020 will suffer its worst year since the Great Depression of the 1930s, the International Monetary Fund says in its latest forecast. The IMF said Tuesday that it expects the global economy to […]

Storage tanks for radioactive water are seen at Tokyo Electric Power Co's (TEPCO) tsunami-crippled Fukushima Daiichi nuclear power plant in Okuma town, Fukushima prefecture, Japan on 15 January 2020. Photo: Aaron Sheldrick / REUTERS

Japan panel recommends ocean release for contaminated Fukushima water

By Aaron Sheldrick 31 January 2020 TOKYO (Reuters) – A panel of experts advising Japan’s government on a disposal method for radioactive water from the destroyed Fukushima nuclear plant on Friday recommended releasing it into the ocean, a move likely to alarm neighboring countries. The panel under the industry ministry came to the conclusion after […]

Total world fertility rates and median age by region, 1955-2030. Data: UN population projections. Graphic: Alan Smith / Financial Times

Europe’s demographic time-bomb – While global population is ageing, continent presents extreme example of this trend

By Valentina Romei 13 January 2020 LONDON (Financial Times) – With its low birth rate and fast-ageing population, Europe is facing a demographic crisis, one that economists fear could hit growth and public finances.  While the global population overall is getting older, Europe is an extreme example of this trend, particularly in the continent’s south and […]

Worldwide natural catastrophe loss events in 2019. Tropical cyclones, extreme storms, and floods caused overall losses of $150 billion. Video: Munich RE

Tropical cyclones causing billions in losses dominated the natural catastrophe picture of 2019 – “Cyclones are becoming more frequently associated with extreme precipitation”

8 January 2020 (Munich RE) – 820 natural catastrophes caused overall losses of US$ 150bn, which is broadly in line with the inflation-adjusted average of the past 30 years. A smaller portion of losses was insured compared with 2018: about US$ 52bn. This was due, among other things, to the high share of flood losses, which are […]

Map showing average surface sea temperature in the Sea of Okhotsk, compared with the late 1800s. Data: Berkeley Earth. Graphic: John Muyskens / The Washington Post

The climate chain reaction that threatens the heart of the Pacific – “When are the fish coming?”

By Simon Denyer and Chris Mooney 12 November 2019 SHIRETOKO PENINSULA, Japan (The Washington Post) – Lined up along the side of their boat, the fishermen hauled a huge, heavy net up from swelling waves. At first, a few small jellyfish emerged, then a piece of plastic. Then net, and more net. Finally, all the […]

Social media & sharing icons powered by UltimatelySocial