Hubei’s Guanyin Pavilion during the July 2017 flood and the August 2022 drought. Photo: Getty Images

Climate change has come for the world’s largest greenhouse gas emitter – “There is nothing in world climatic history which is even minimally comparable to what is happening in China”

By Muizz Akhtar 29 September 2022 (Vox) – China just finished one of its most disastrous summers on record, with record-breaking heat, drought, and wildfires leading to water shortages even into the fall. More than 900 million people — or about 64 percent of China’s population — faced brutal heat waves alone, highlighting how much further the nation has to […]

Changes in global average sea level (background map) and local sea level (dots) between 1993 and 2021. In the global ocean, sea level has risen nearly everywhere (blue). Coastal areas where sea level has fallen (brown) are places where the land is rising as it rebounds from being compressed by ice sheets and glaciers during the last ice age. NOAA Climate.gov map, based on data from University of Hawaii Sea Level Center. Graphic: NOAA

American Meteorological Society report: Record-high greenhouse gases and sea levels in 2021 – Ocean heat content highest on record

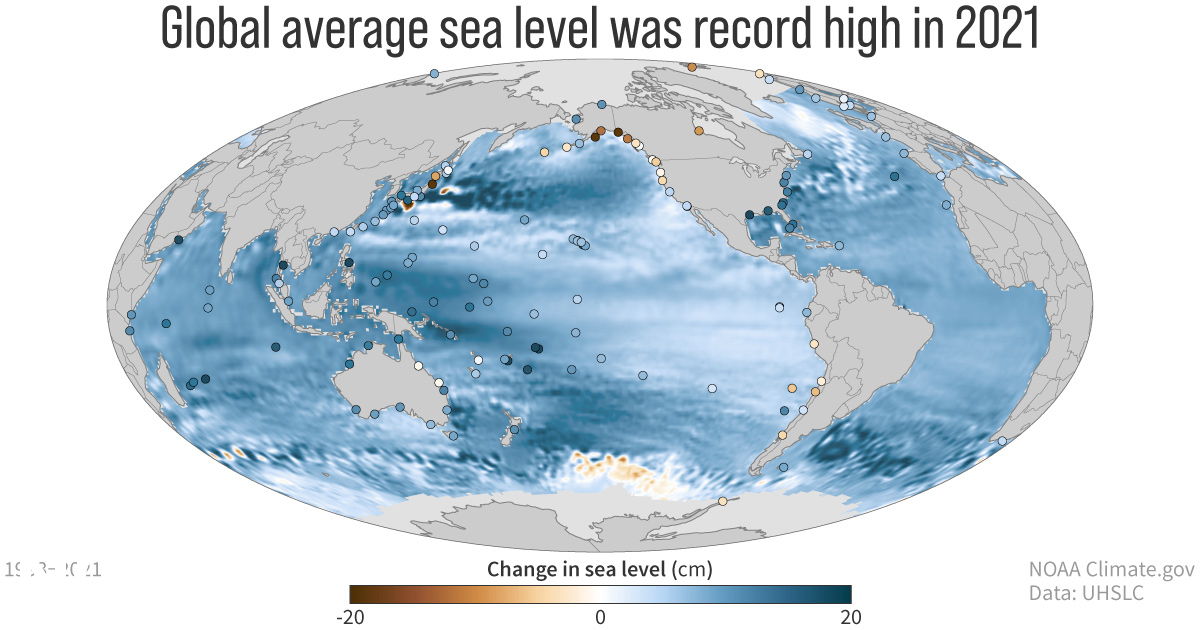
31 August 2022 (NOAA) – Greenhouse gas concentrations, global sea levels and ocean heat content reached record highs in 2021, according to the 32nd annual State of the Climate report. The international annual review of the world’s climate, led by scientists from NOAA’s National Centers for Environmental Information and published by the Bulletin of the […]

Annual Greenhouse Gas Index (AGGI), 1700-2021. For 2021, the AGGI was a record high 1.49, representing an increase in total direct radiative forcing of 49 percent since 1990. The atmospheric abundance of CO2 has increased by an average of 1.88 ppm per year over the past 42 years (1979-2021). This increase in CO2 is accelerating — while it averaged about 1.6 ppm per year in the 1980s and 1.5 ppm per year in the 1990s, the growth rate increased to 2.4 ppm per year during the last decade (2011-2021). The annual CO2 increase from 1 January 2021 to 1 January 2022 was 2.60 ± 0.08 ppm. Graphic: Montzka, 2022 / NOAA

Greenhouse gas pollution trapped record 49 percent more heat in 2021 than in 1990 – Methane increase in 2021 largest since 1982 – “The primary gases responsible for climate change continue rising rapidly”

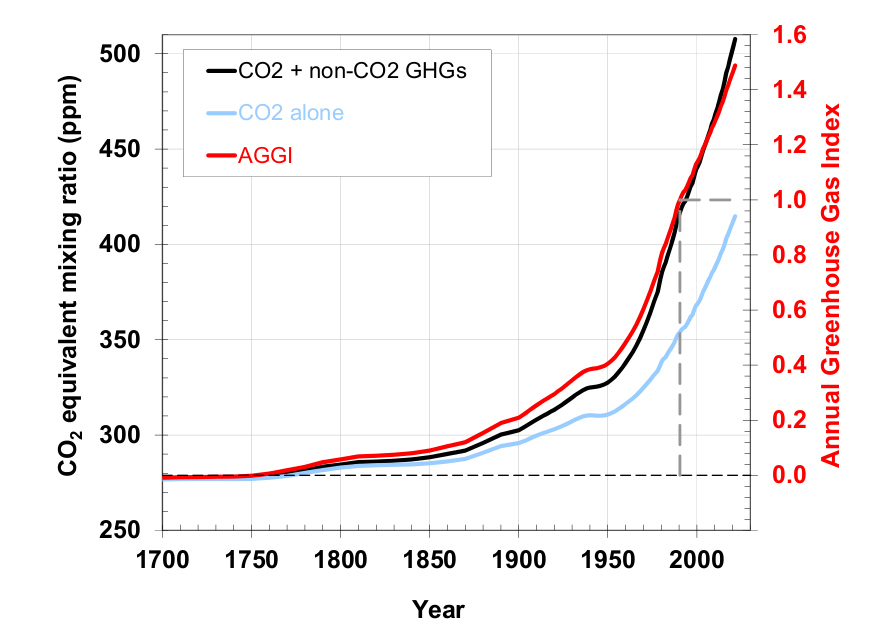
23 May 2022 (NOAA) – Greenhouse gas pollution caused by human activities trapped 49 percent more heat in the atmosphere in 2021 than they did in 1990, according to NOAA scientists. NOAA’s Annual Greenhouse Gas Index, known as the AGGI, tracks increases in the warming influence of human emissions of heat-trapping gases, including carbon dioxide, methane, […]

Global map showing the highest marine heatwave (MHW) category experienced at each pixel in 2021 (reference period 1982–2011). Light grey indicates that no MHW occurred in a pixel over the entire year. (b) Stacked bar plot showing the percentage of the surface of the ocean experiencing an MHW on any given day of the year. (c) Stacked bar plot showing the cumulative percentage of the surface of the ocean that experienced an MHW over the year. Note: These values are based on when in the year a pixel first experienced its highest MHW category, so no pixel is counted twice. Horizontal lines in this figure show the final percentages for each category of MHW. (d) Stacked bar plot showing the cumulative number of MHW days averaged over the surface of the ocean. Note: This average is calculated by dividing the cumulative sum of MHW days per pixel weighted by the surface area of those pixels. Data: National Oceanic and Atmospheric Administration Optimum Interpolation Sea Surface Temperature (NOAA OISST). Graphic: Robert Schlegel

WMO: Four key climate change indicators broke records in 2021 – Past seven years have been the warmest seven years on record – “A dismal litany of humanity’s failure to tackle climate disruption”

GENEVA, 18 May 2022 (WMO) – Four key climate change indicators – greenhouse gas concentrations, sea level rise, ocean heat and ocean acidification – set new records in 2021. This is yet another clear sign that human activities are causing planetary scale changes on land, in the ocean, and in the atmosphere, with harmful and […]

Global net anthropogenic greenhouse gas emissions projected to 2050. Projected global GHG emissions from Nationally Determined Contribution (NDCs) announced prior to COP26 would make it likely that warming will exceed 1.5°C and also make it harder after 2030 to limit warming to below 2°C. Graphic: IPCC

Amid backsliding on climate, the renewables effort now must be tripled – “A litany of broken climate promises”

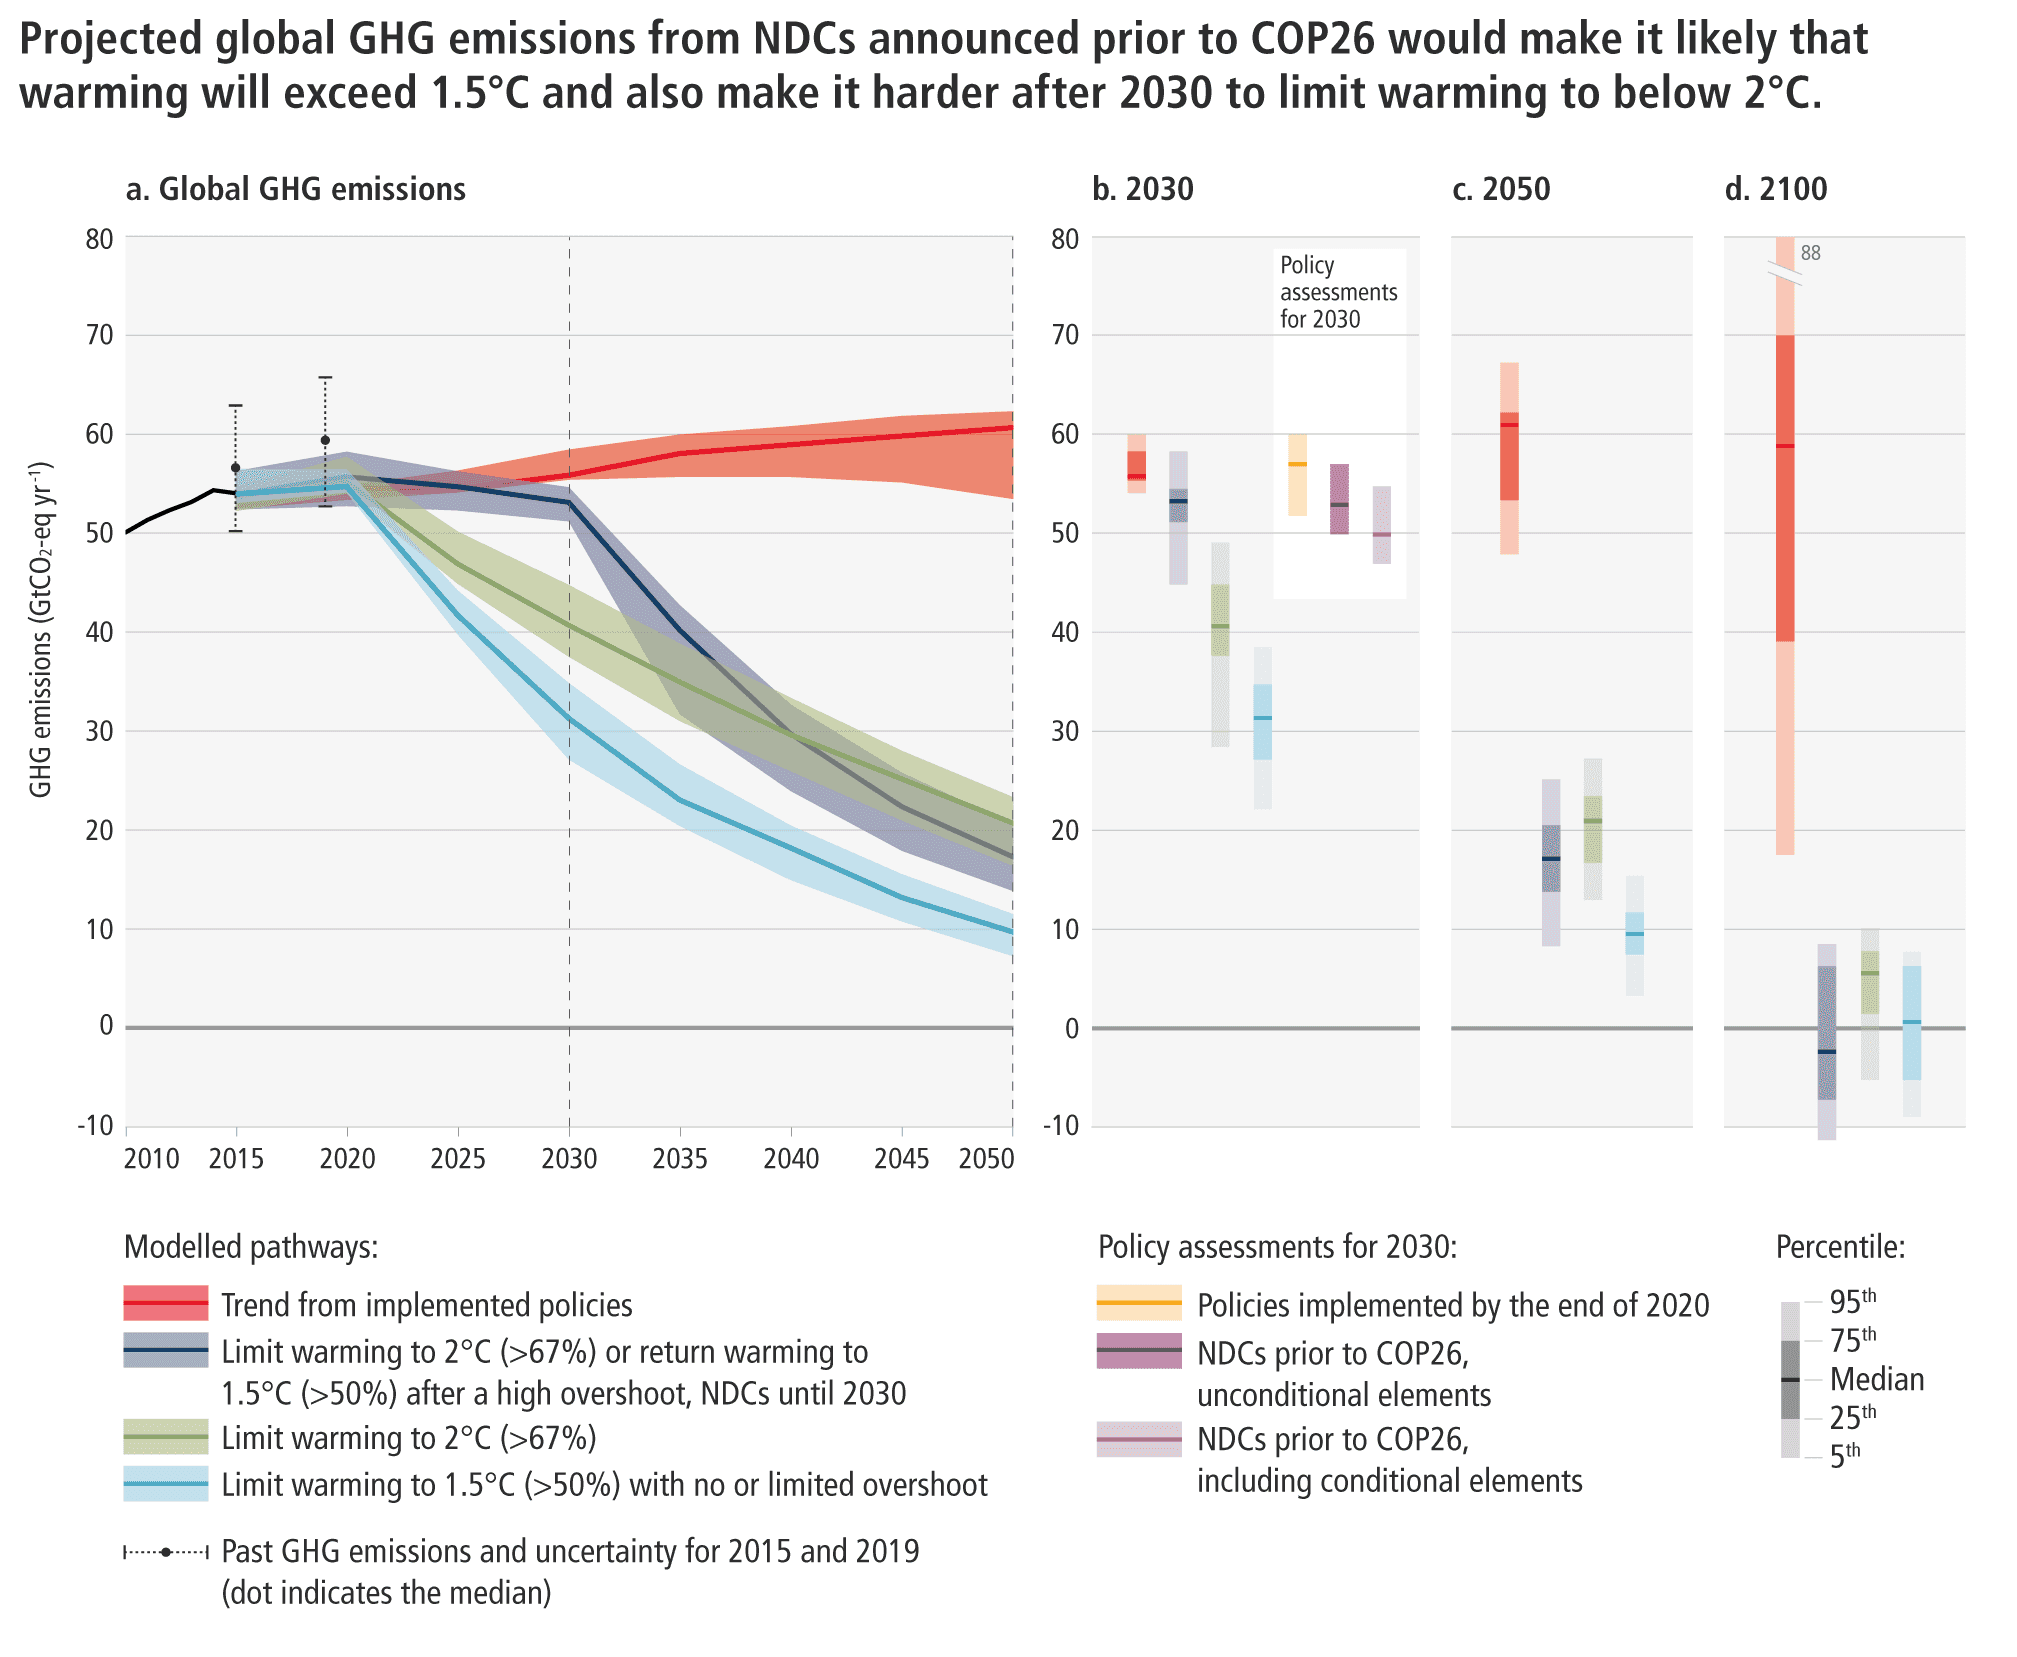
By António Guterres 4 April 2022 (The Washington Post) – A report released Monday by the Intergovernmental Panel on Climate Change is a litany of broken climate promises. Together with the IPCC’s previous two reports on physical science and adaptation in the past year, it reveals the yawning gap between climate pledges and reality. And the reality is that we are […]

Global greenhouse gas emissions, 1990-2020. The reduction in emissions in 2020 due to the COVID-19 pandemic and global recession was 10 times greater than the impact on emissions from the 2008 global financial crisis. Graphic: Rhodium Group

Global greenhouse gas reduction in 2020 from pandemic and global recession “was 10 times greater than the impact on emissions from the 2008 global financial crisis”

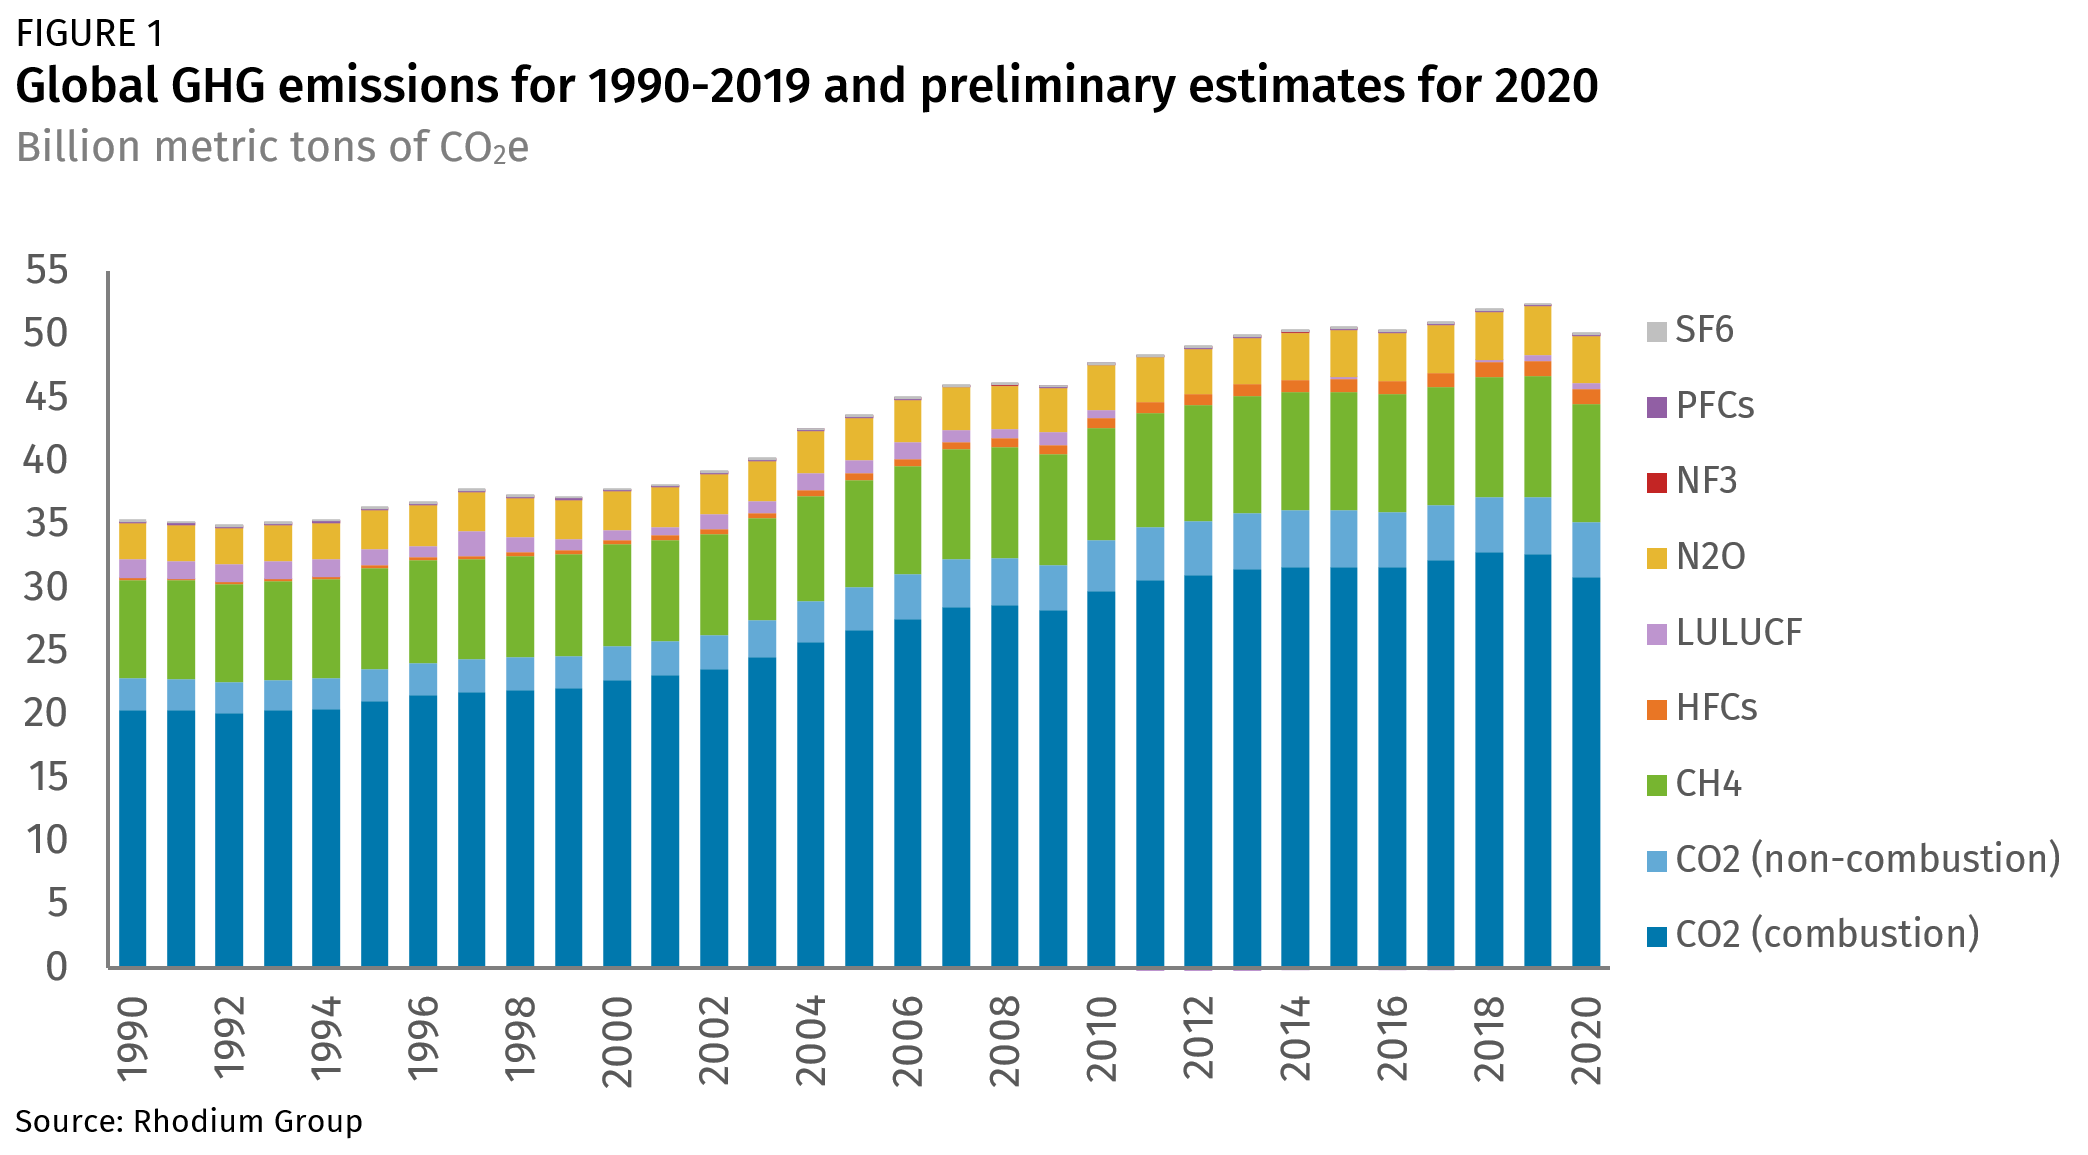
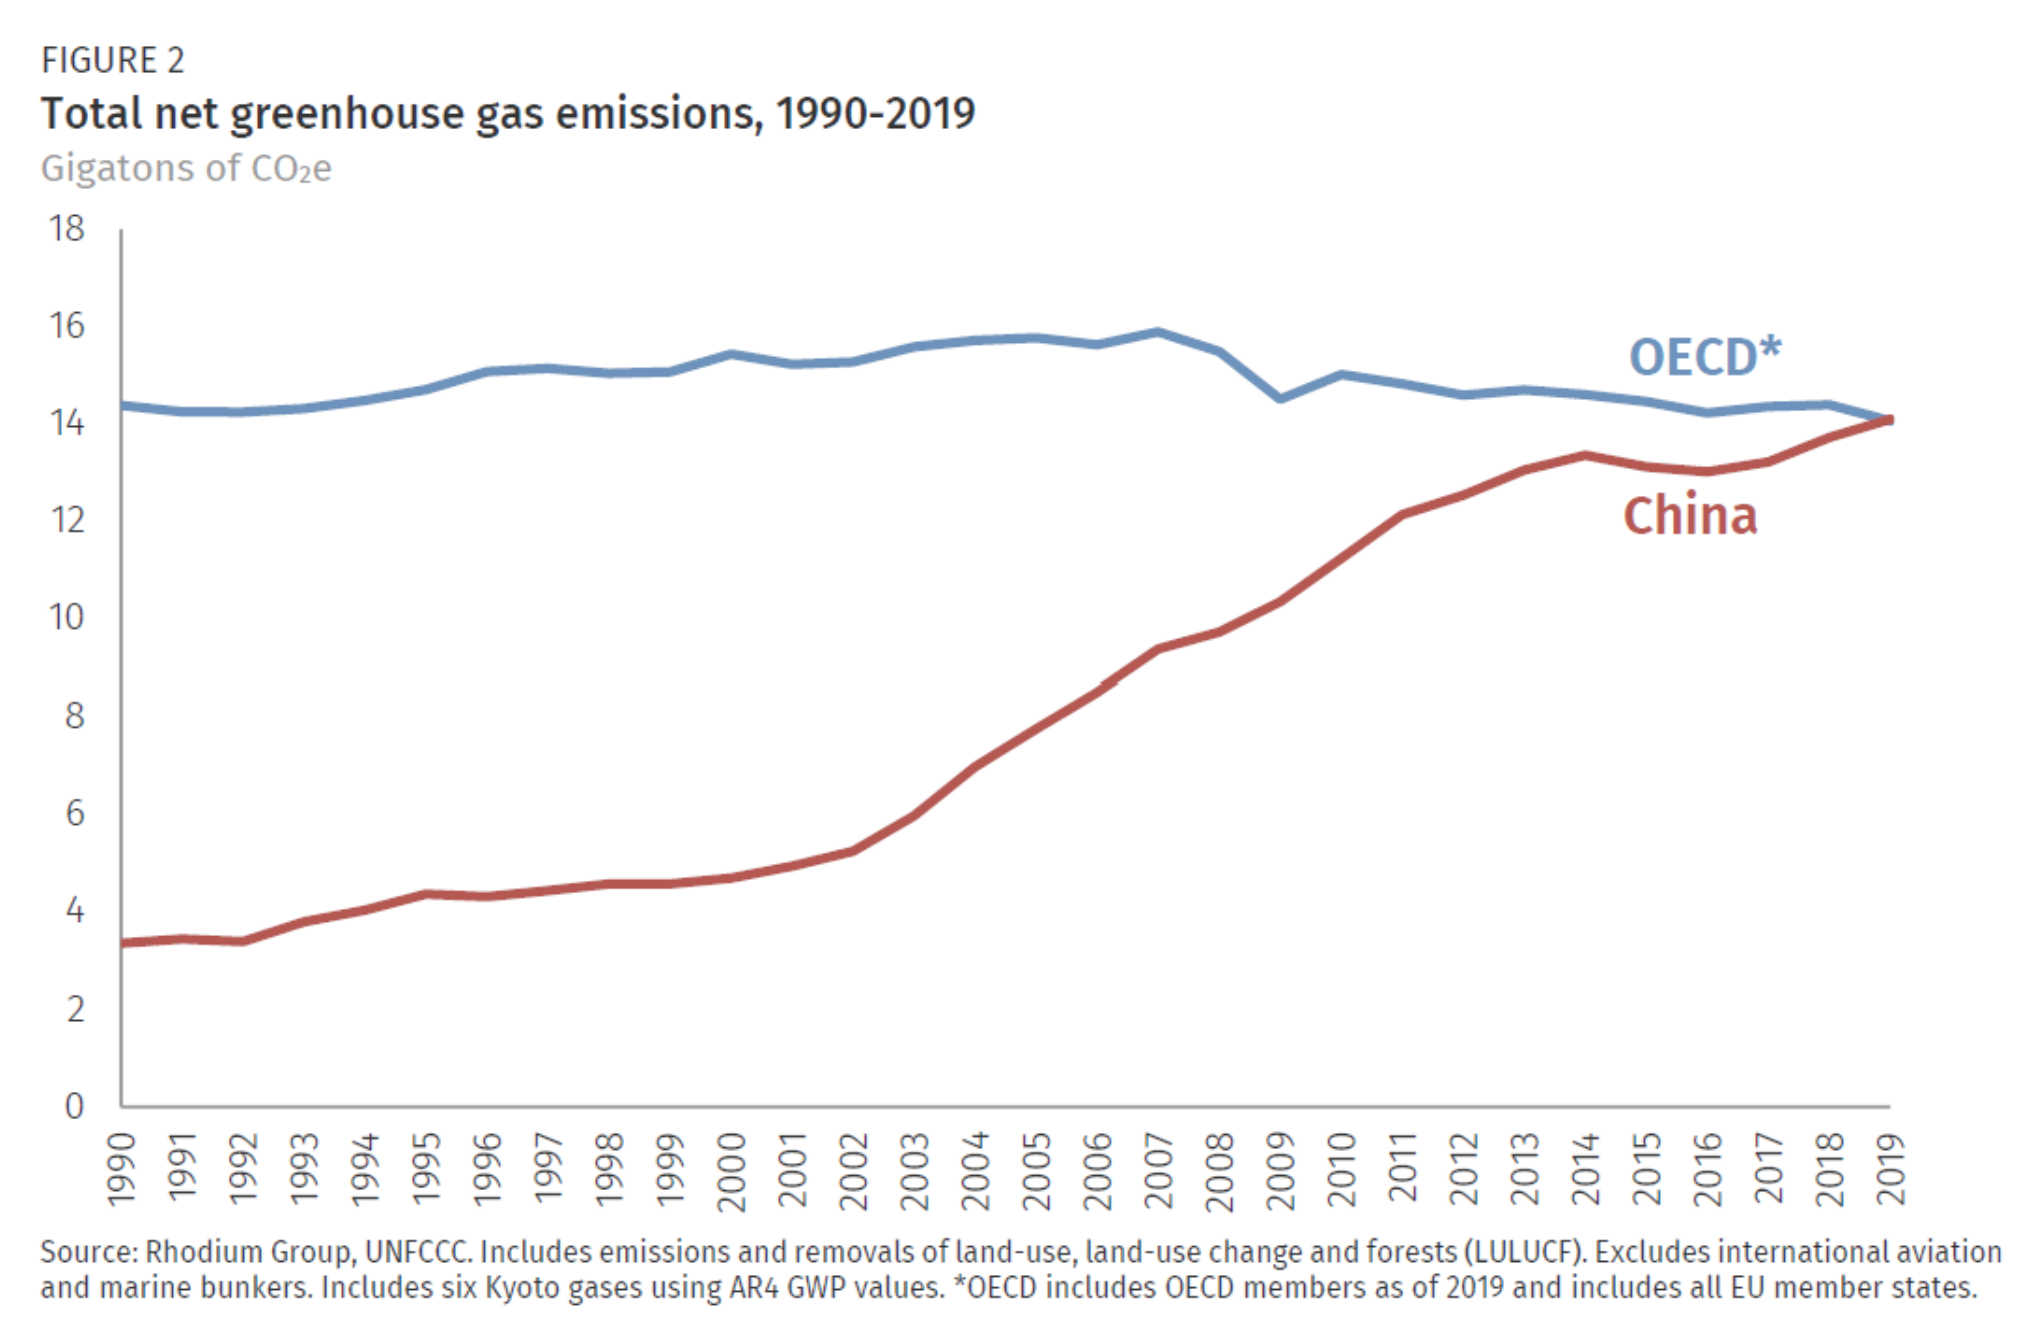
By Alfredo Rivera, Shweta Movalia, Hannah Pitt, and Kate Larsen 23 December 2021 (Rhodium Group) – Understanding annual trends in greenhouse gas (GHG) emissions is a critical input for decision-makers in their efforts to reach net-zero emissions, whether is at the national, state, city, or corporate levels. Tracking emissions of the 190+ Parties to the […]

Globally averaged atmospheric CO2 mole fraction (left) and growth rate (right), 1984-2020. In 2020, the concentration of carbon dioxide (CO2), the most important greenhouse gas, reached 413.2 parts per million in 2020 and is 149 percent of the pre-industrial level. Graphic: WMO

WMO Greenhouse Gas Bulletin 2021: Another year, another record – “CO2 in the atmosphere breached the milestone of 400 parts per million in 2015. And just five years later, it exceeded 413 ppm.”

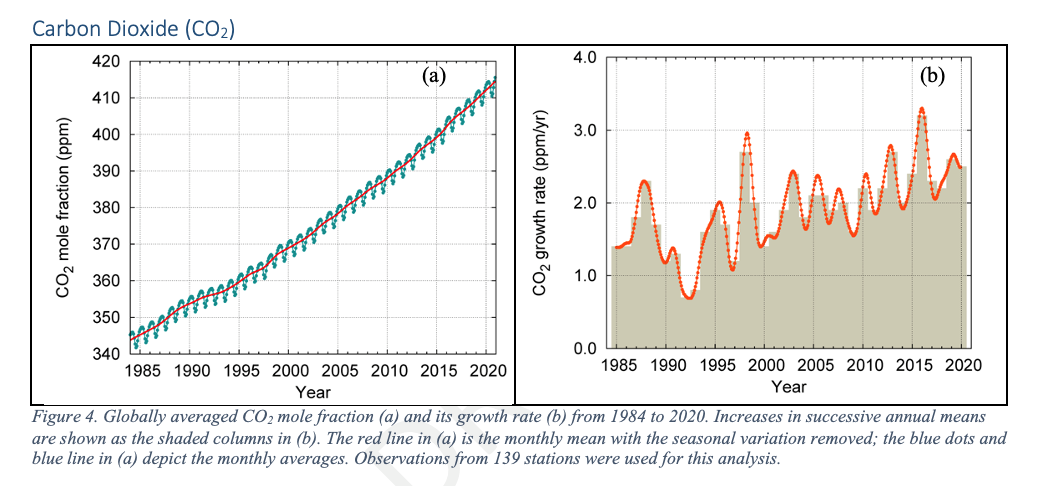
GENEVA, 25 October 2021 (WMO) – The abundance of heat-trapping greenhouse gases in the atmosphere once again reached a new record last year, with the annual rate of increase above the 2011-2020 average. That trend has continued in 2021, according to the World Meteorological Organization (WMO) Greenhouse Gas Bulletin. Concentration of carbon dioxide (CO2), the most […]

Map showing the near-surface air temperature differences from the 1981-2010 average for January to September 2021. Data are from the ERA5 reanalysis product. Graphic: C3S / ECMWF

State of the Climate in 2021: Past seven years are on track to be the seven warmest on record – “Extreme events are the new norm”

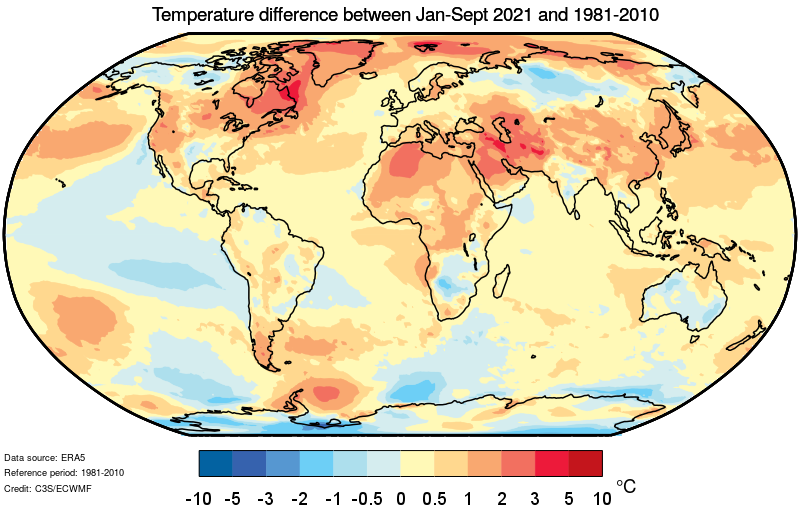
GENEVA, 31 October 2021 (WMO) – Record atmospheric greenhouse gas concentrations and associated accumulated heat have propelled the planet into uncharted territory, with far-reaching repercussions for current and future generations, according to the World Meteorological Organization (WMO). The past seven years are on track to be the seven warmest on record, according to the provisional WMO […]

Time series of climate-related responses to anthropogenic drivers, 1990-2020. Out of the 31 tracked planetary vital signs, 18 were at new all-time record lows or highs in 2020. Data obtained before and after the publication of Ripple and colleagues (2020) are shown in gray and red respectively. For variables with relatively high variability, local regression trend lines are shown in black. The variables were measured at various frequencies (e.g., annual, monthly, weekly). The labels on the x-axis correspond to midpoints of years. Sources and additional details about each variable are provided in the supplemental material. Graphic: Ripple, et al., 2021 / BioScience

World scientists’ warning of a climate emergency 2021 – Humans face untold suffering from “the consequences of unrelenting business as usual”

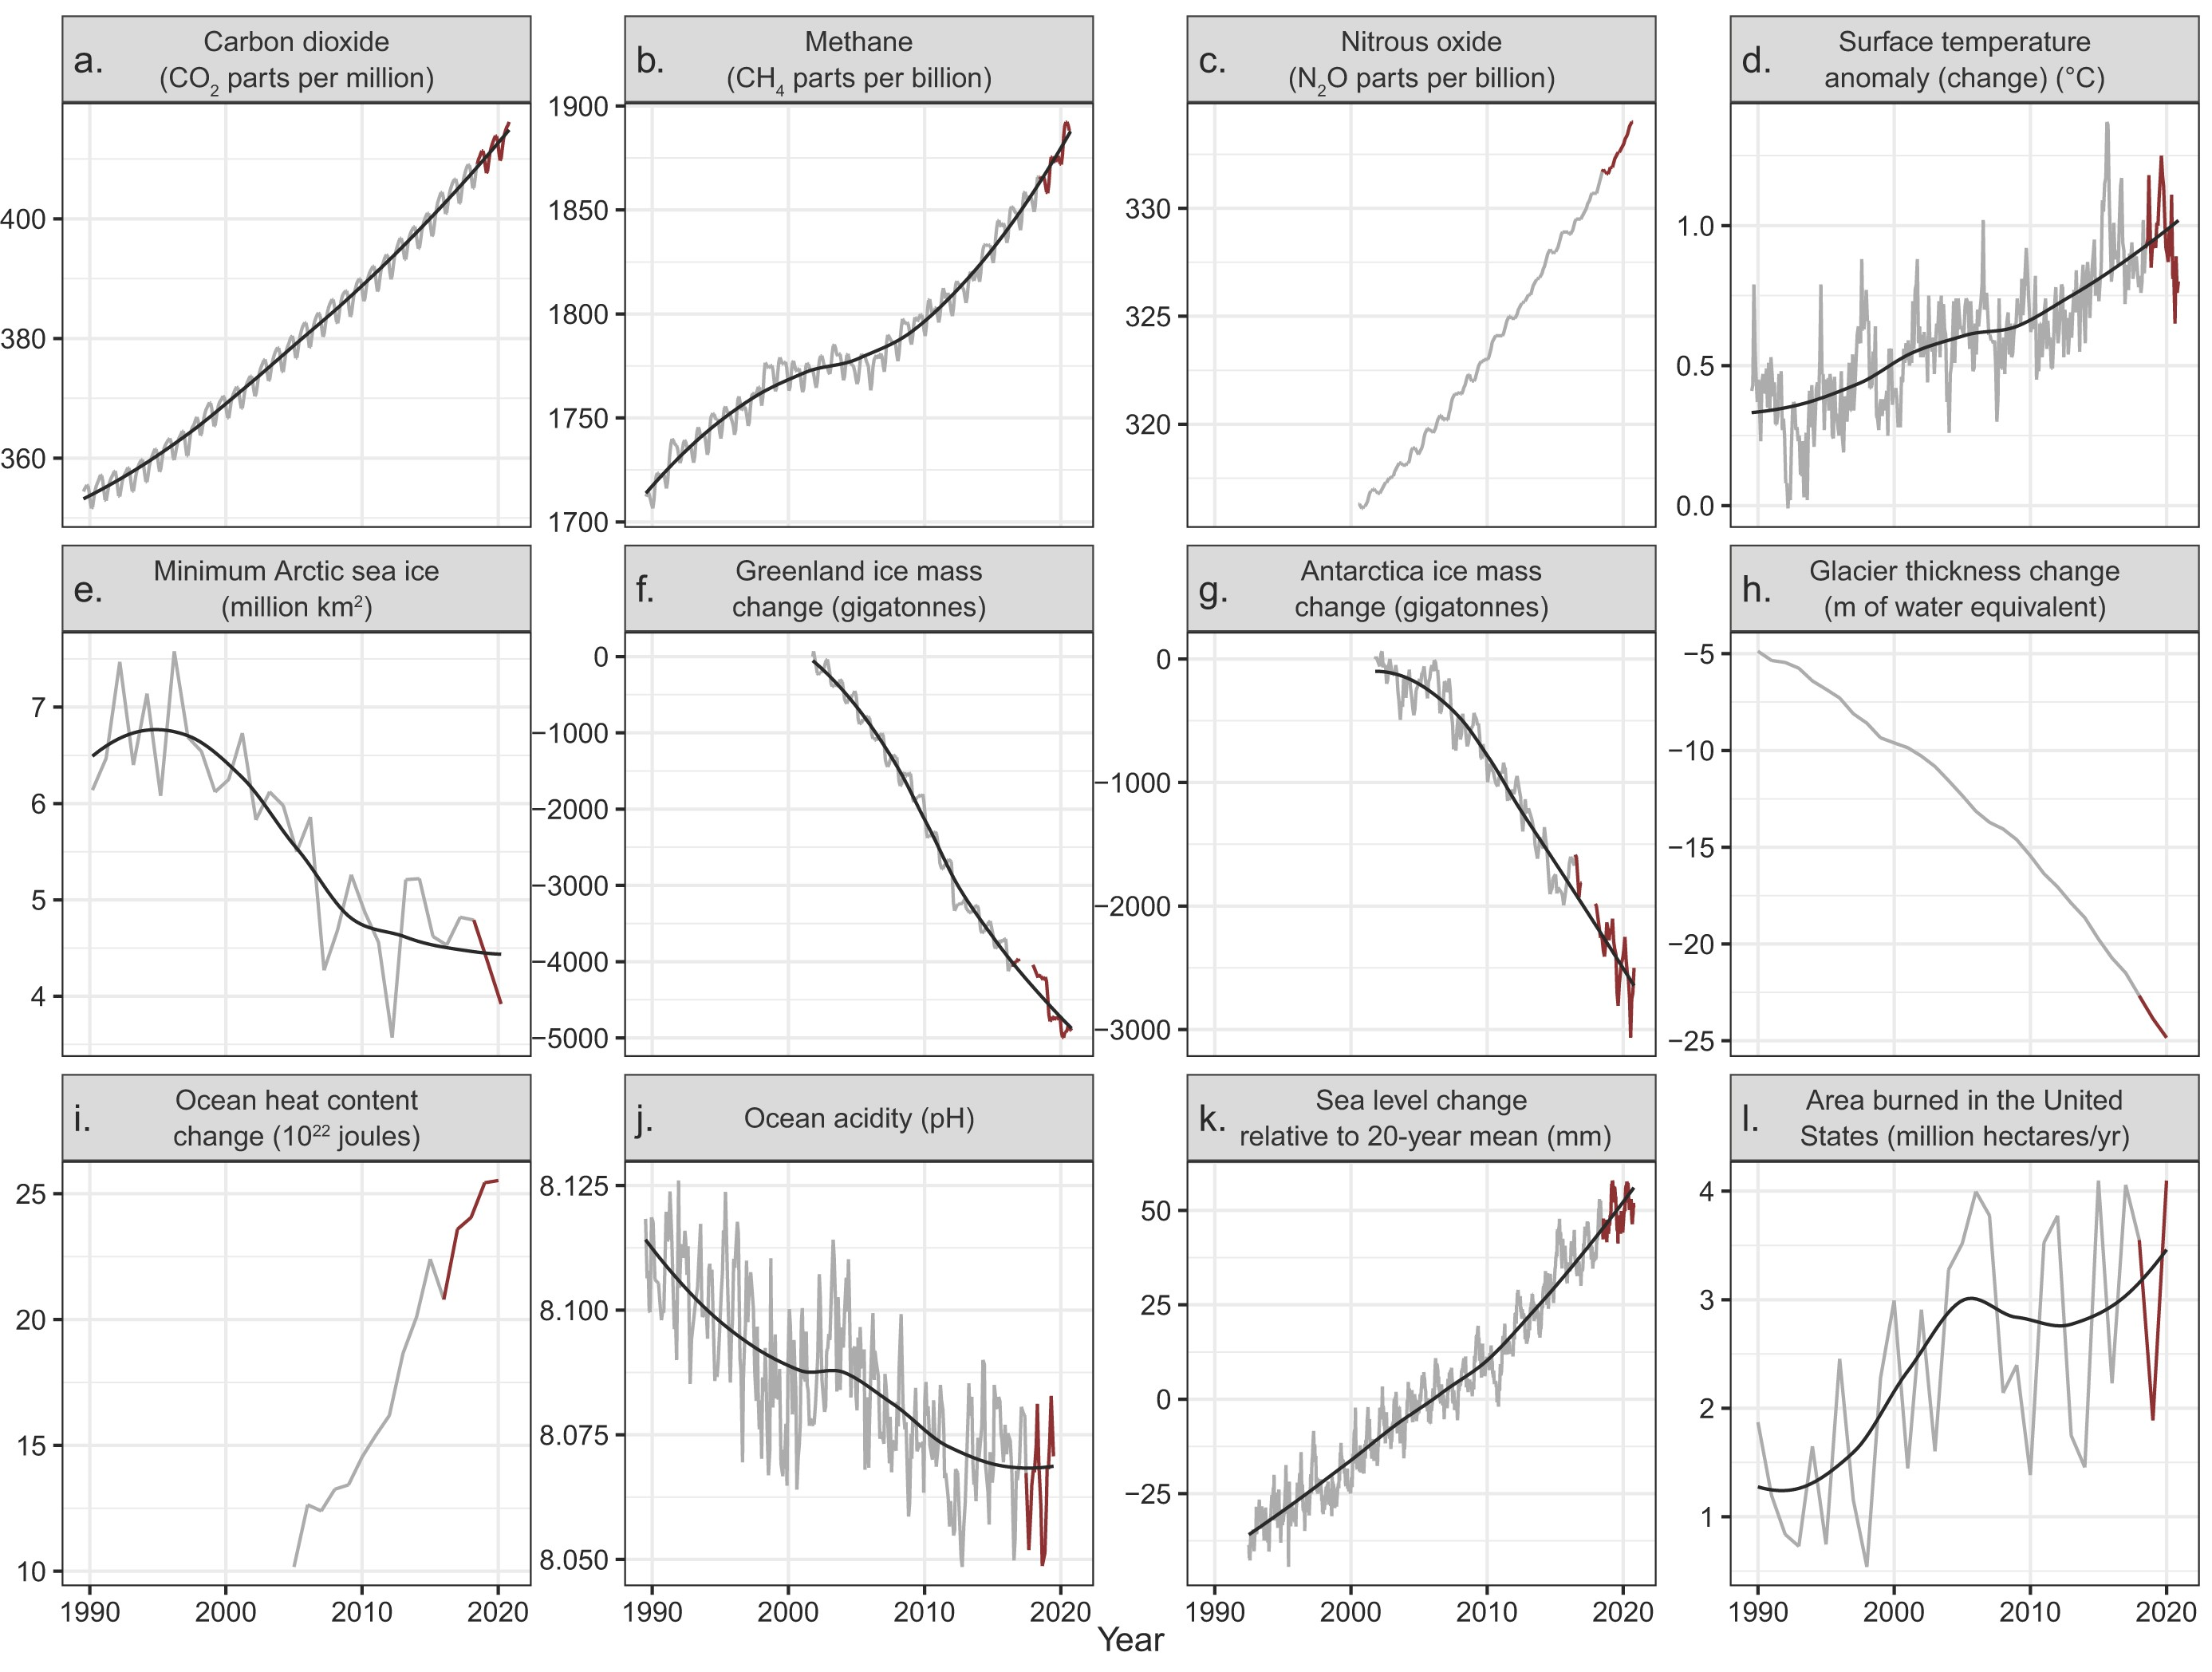
28 July 2021 (BioScience) – In 2019, Ripple and colleagues (2020) warned of untold suffering and declared a climate emergency together with more than 11,000 scientist signatories from 153 countries. They presented graphs of planetary vital signs indicating very troubling trends, along with little progress by humanity to address climate change. On the basis of […]

Total greenhouse gas emissions from China and OECD nations, 1990-2019. In 2019, China’s GHG emissions passed the 14 gigaton threshold for the first time, reaching 14,093 million metric tons of CO2 equivalent (MMt CO2e). This represents a more than tripling of 1990 levels, and a 25 percent increase over the past decade. As a result, China’s share of the 2019 global emissions total of 52 gigatons rose to 27 percent. Data: Rhodium Group / UNFCCC. Graphic: Rhodium Group

China’s greenhouse gas emissions exceeded the developed world for the first time in 2019

By Kate Larsen, Hannah Pitt, Mikhail Grant, and Trevor Houser 6 May 2021 (Rhodium Group) – Each year Rhodium Group provides the most up-to-date global and country-level greenhouse gas (GHG) emissions estimates through the ClimateDeck (a partnership with Breakthrough Energy). In addition to our preliminary US and China GHG estimates for 2020, Rhodium provides annual estimates of economy-wide emissions—including all […]

Social media & sharing icons powered by UltimatelySocial