By Christina Larson and Federica Narancio 24 September 2019 MERIDA, Venezuela (AP) – Blackouts shut off the refrigerators where the scientists keep their lab samples. Gas shortages mean they sometimes have to work from home. They even reuse sheets of paper to record field data because fresh supplies are so scarce. As their country falls […]
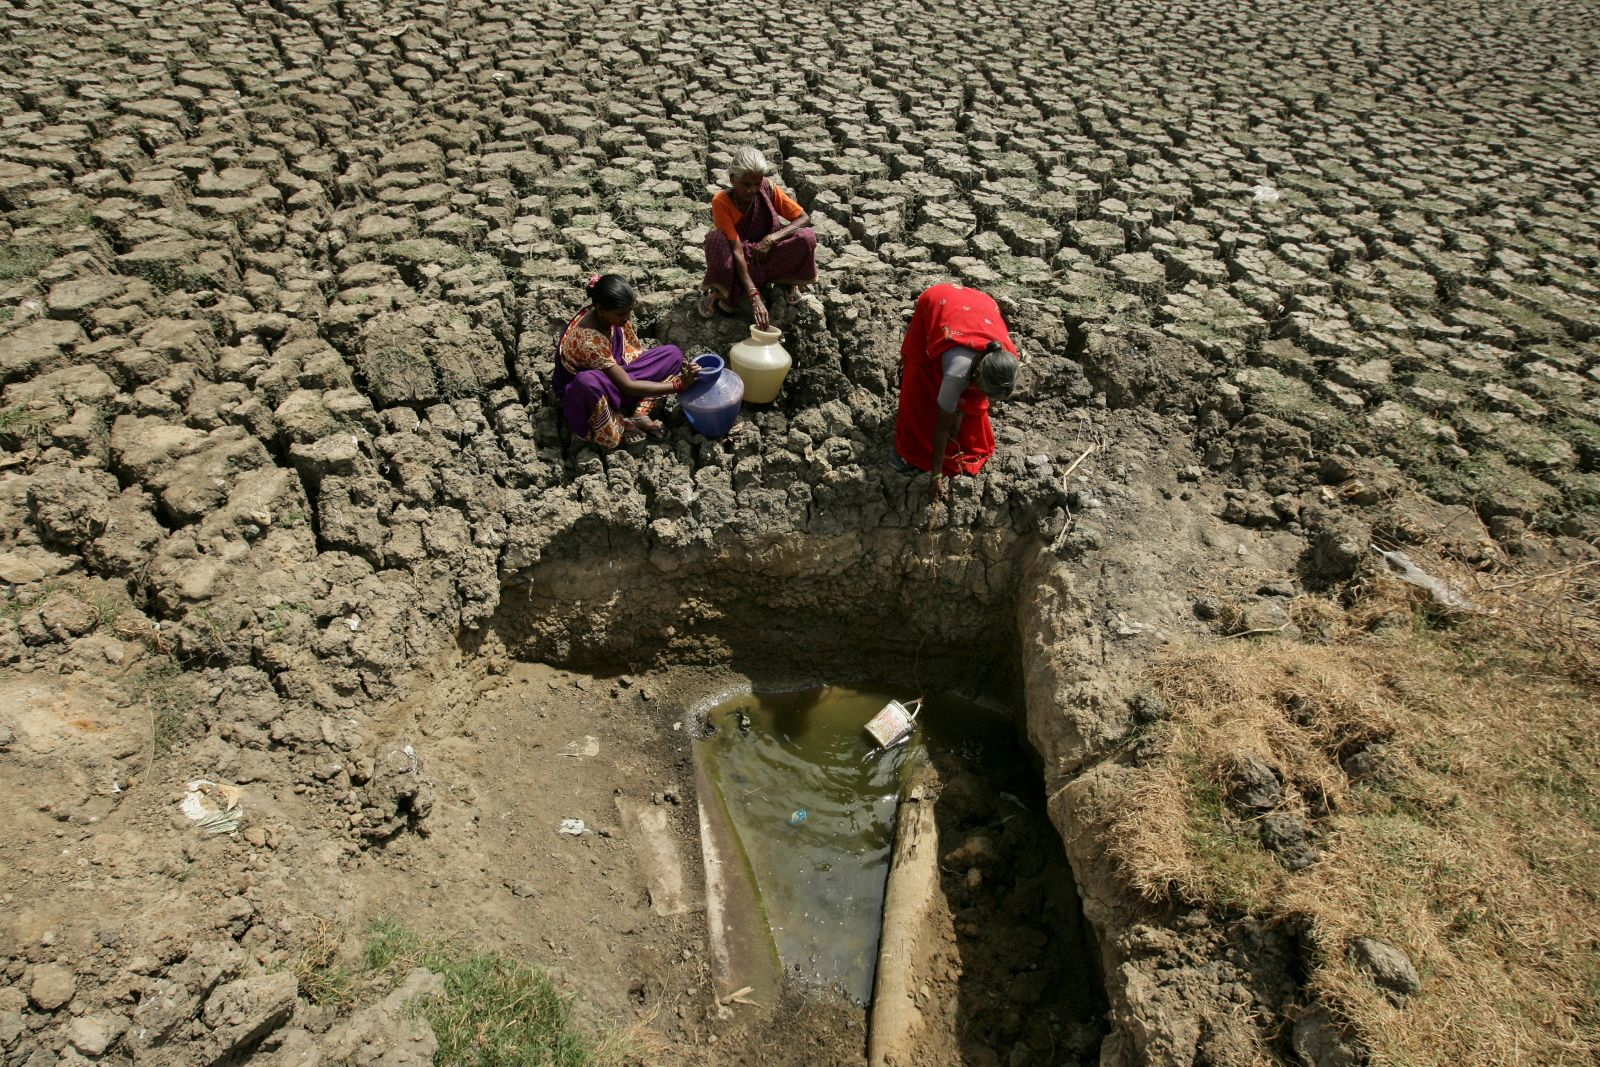
By Bill Spindle and Gareth Phillips 19 August 2019 LEH, India (The Wall Street Journal) – The Ladakh region of northern India is one of the world’s highest, driest inhabited places. For centuries, meltwater from winter snows in the Himalayan mountains sustained the tiny villages dotting this remote land. Now, like many other places in […]
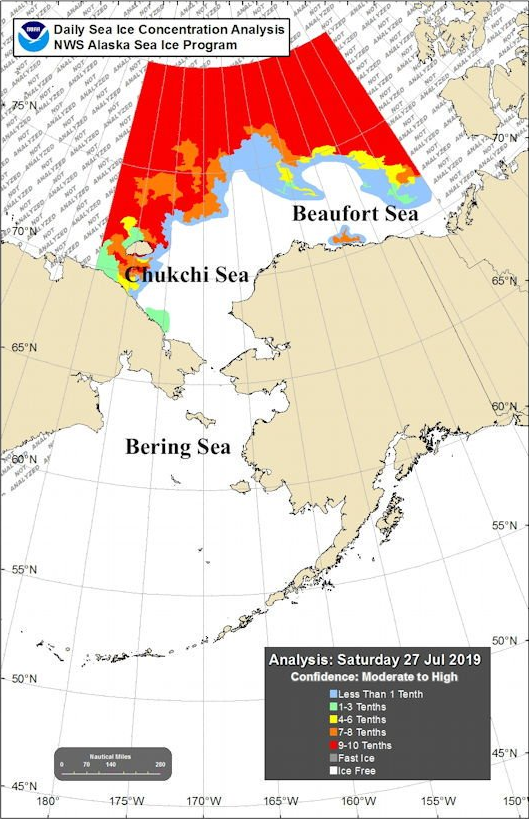
By Bob Henson 14 August 2019 (Weather Underground) – You’ll have to forgive the Arctic. It’s had a rough summer. Sea ice is running neck and neck with 2012 for the lowest values on record for this time of year. Wildfires are ringing the Arctic, pouring more carbon dioxide into the air than in any comparable period in 17 […]
By Toby Luckhurst 18 August 2019 (BBC News) – Mourners have gathered in Iceland to commemorate the loss of Okjokull, which has died at the age of about 700. The glacier was officially declared dead in 2014 when it was no longer thick enough to move. What once was glacier has been reduced to a […]
12 August 2019 (British Antarctic Survey) – A new study published this week reveals the first evidence of a direct link between human-induced global warming and melting of the West Antarctic Ice Sheet. UK-US researchers say that curbing greenhouse gas emissions now could reduce the future sea-level contribution from this region. Ice loss in West […]
12 August 2019 (NCEI) – A new State of the Climate report [pdf] confirmed that 2018 was the fourth warmest year in records dating to the mid-1800s. Last year was the fourth warmest year on record despite La Niña conditions early in the year and the lack of a short-term warming El Niño influence until […]
By Kathryn Hansen 9 August 2019 (NASA) – On 18 August 2019, scientists will be among those who gather for a memorial atop Ok volcano in west-central Iceland. The deceased being remembered is Okjökull—a once-iconic glacier that has melted away throughout the 20th century and was declared dead in 2014. A geological map from 1901 estimated Okjökull […]
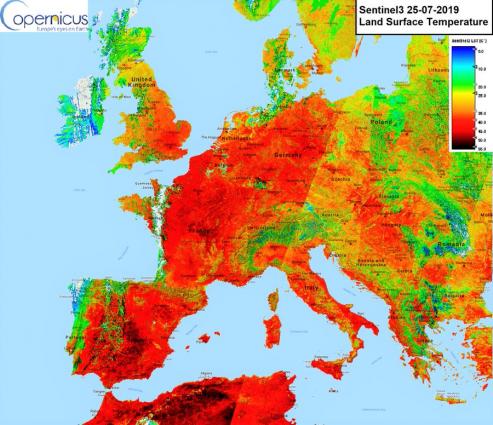
1 August 2019 (WMO) – According to the new data from the World Meteorological Organization and Copernicus Climate Change Programme, July 2019 at least equalled, if not surpassed, the hottest month in recorded history. This follows the warmest ever June on record. The data from the Copernicus Climate Change Programme, run by the European Centre […]
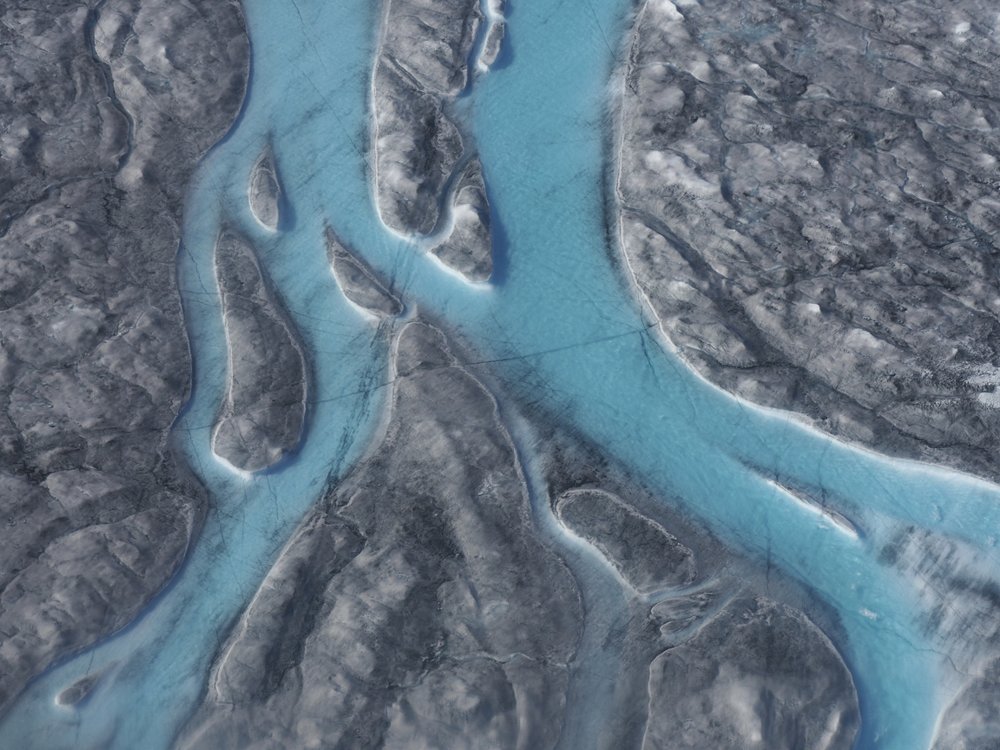
By Bob Henson 29 July 2019 (Weather Underground) – Over the next few days, meltwater will cascade across the Greenland Ice Sheet, and sea ice will dissolve into the Arctic Ocean in amounts that could be unprecedented for late July and early August. The same air mass that led to the sharpest, hottest heat wave ever […]
By William Wilkes and Megan Durisin 24 July 2019 (Bloomberg) – Europe’s latest summer heatwave broke heat records just weeks after the continent had its hottest ever June, fueling concern that a shifting climate is triggering more extreme weather. Germany probably set a new all-time temperature record of 42.6 degrees Celsius (108.7 Fahrenheit) in the […]