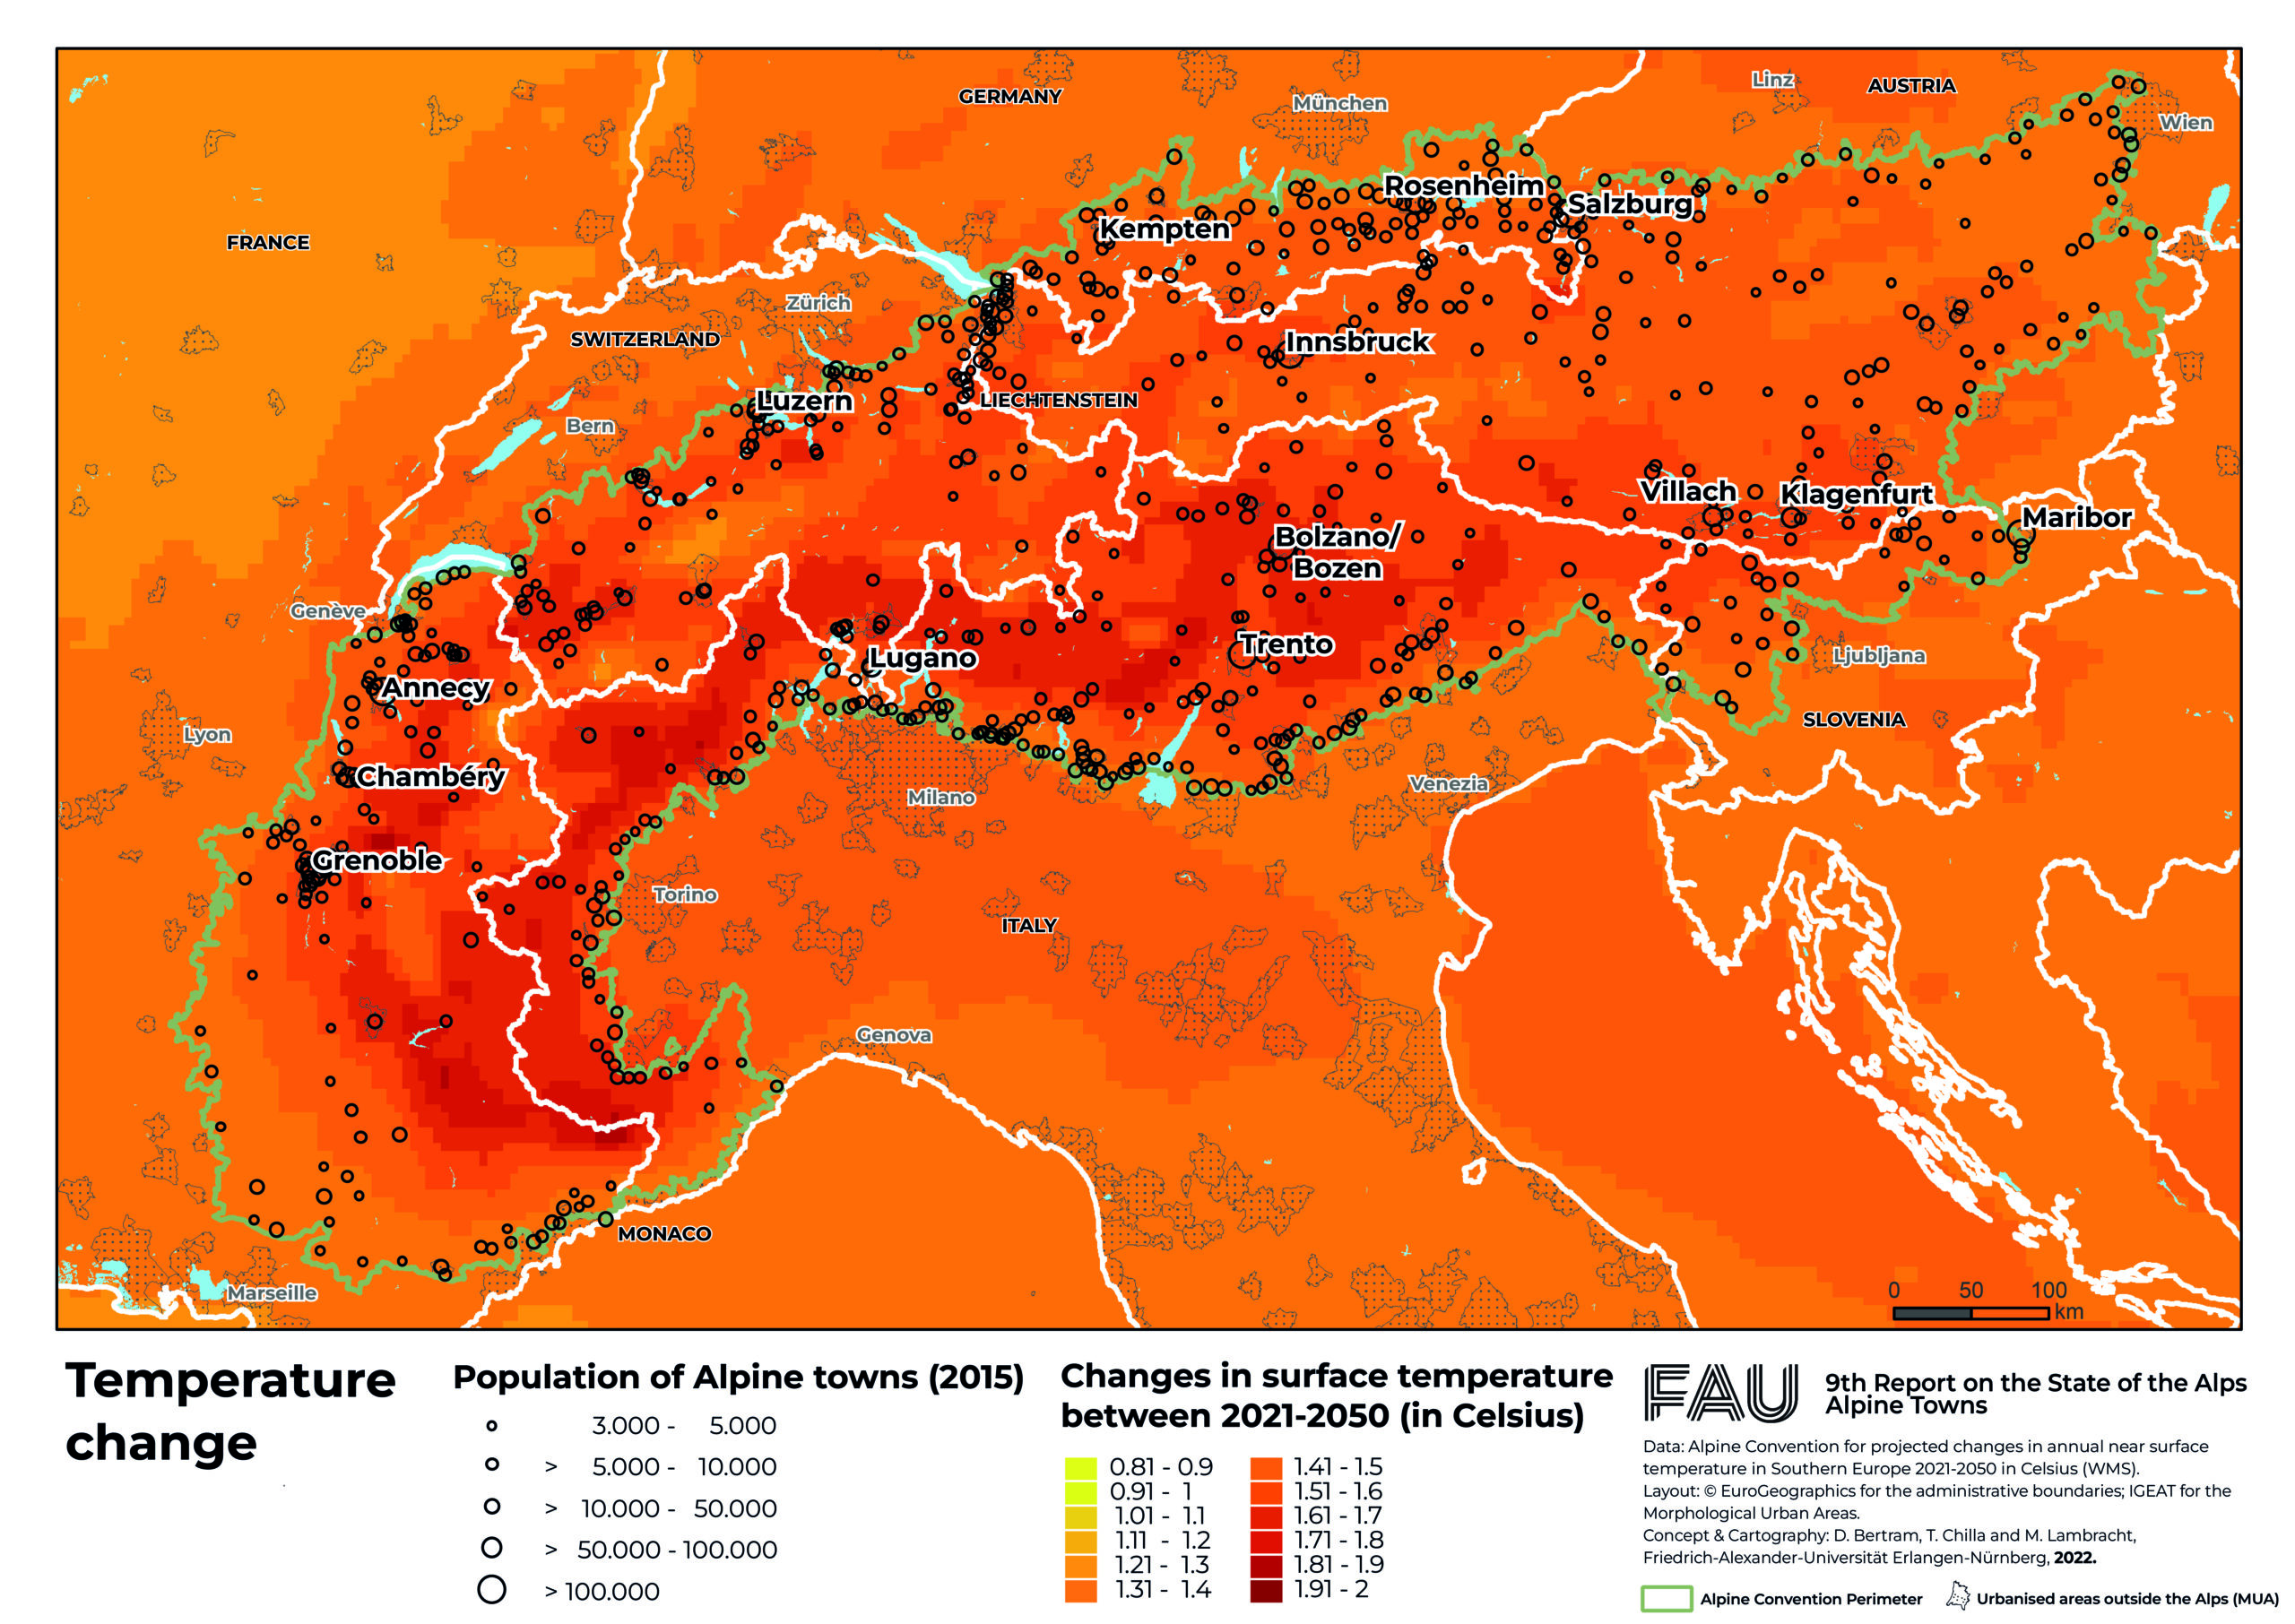
By Jamey Keaten 27 October 2022 BRIG, Switzerland (AP) – A battle is brewing around Europe’s rooftop over the planet’s most precious resource. The crystal-clear waters issuing from the Alps could become increasingly contested as the effects of climate change and glacier melt become more apparent. Italy wants them for crop irrigation in the spring […]
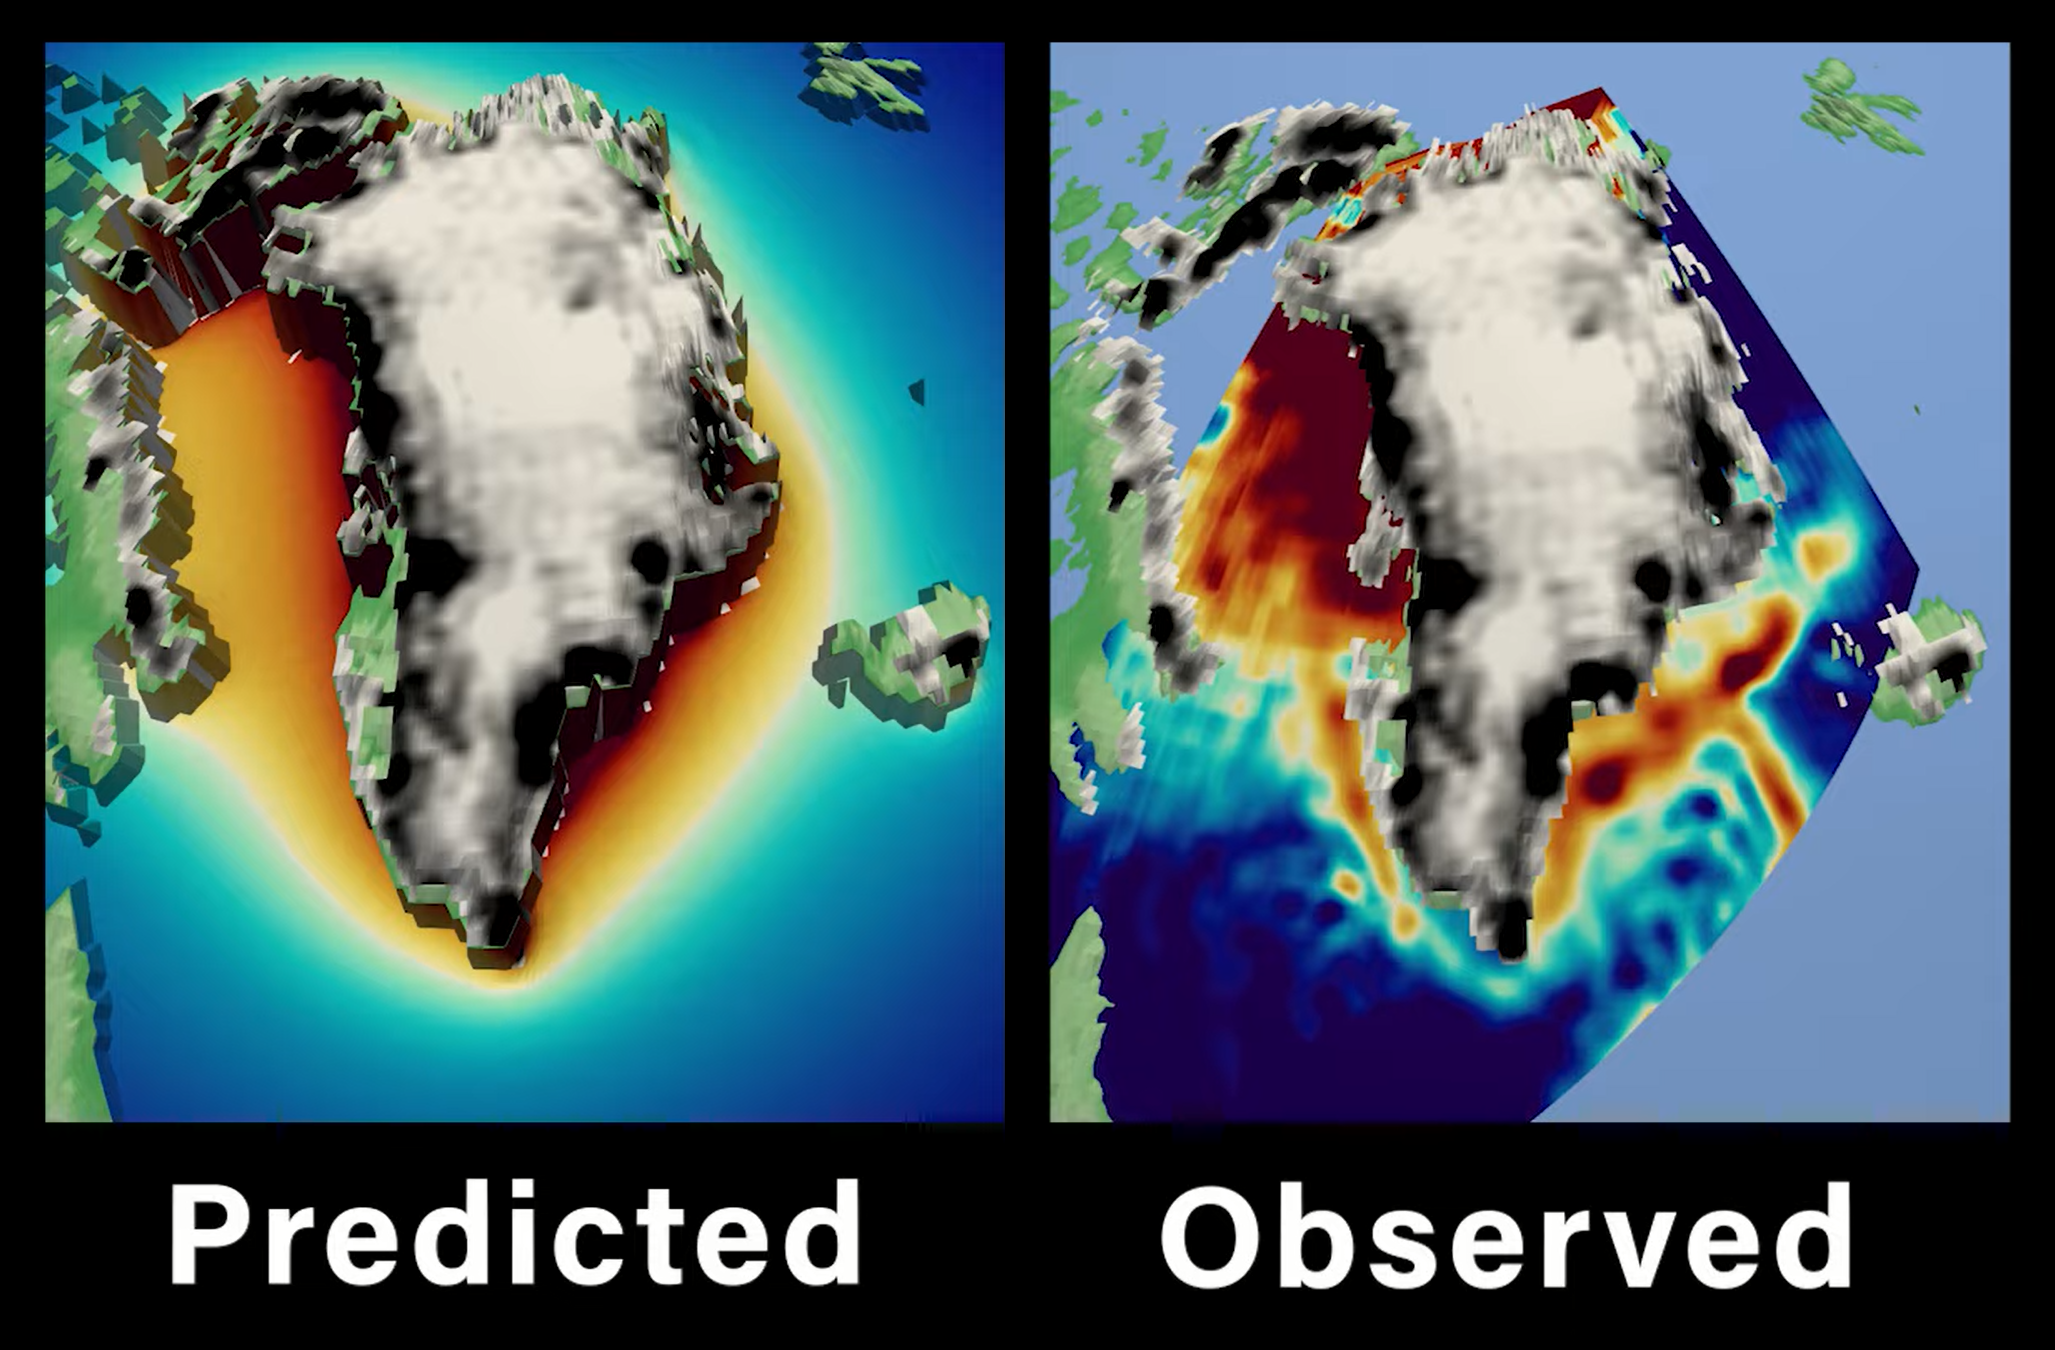
By Sarah Sloat 29 September 2022 (NBC News) – Scientists now have unambiguous proof that a phenomenon critical to predicting the impact of climate change exists. Researchers announced Thursday that they had detected the sea level “fingerprint” of the Greenland ice sheet melt, pinpointing the unique pattern of sea level change linked to the melting ice. It’s the […]
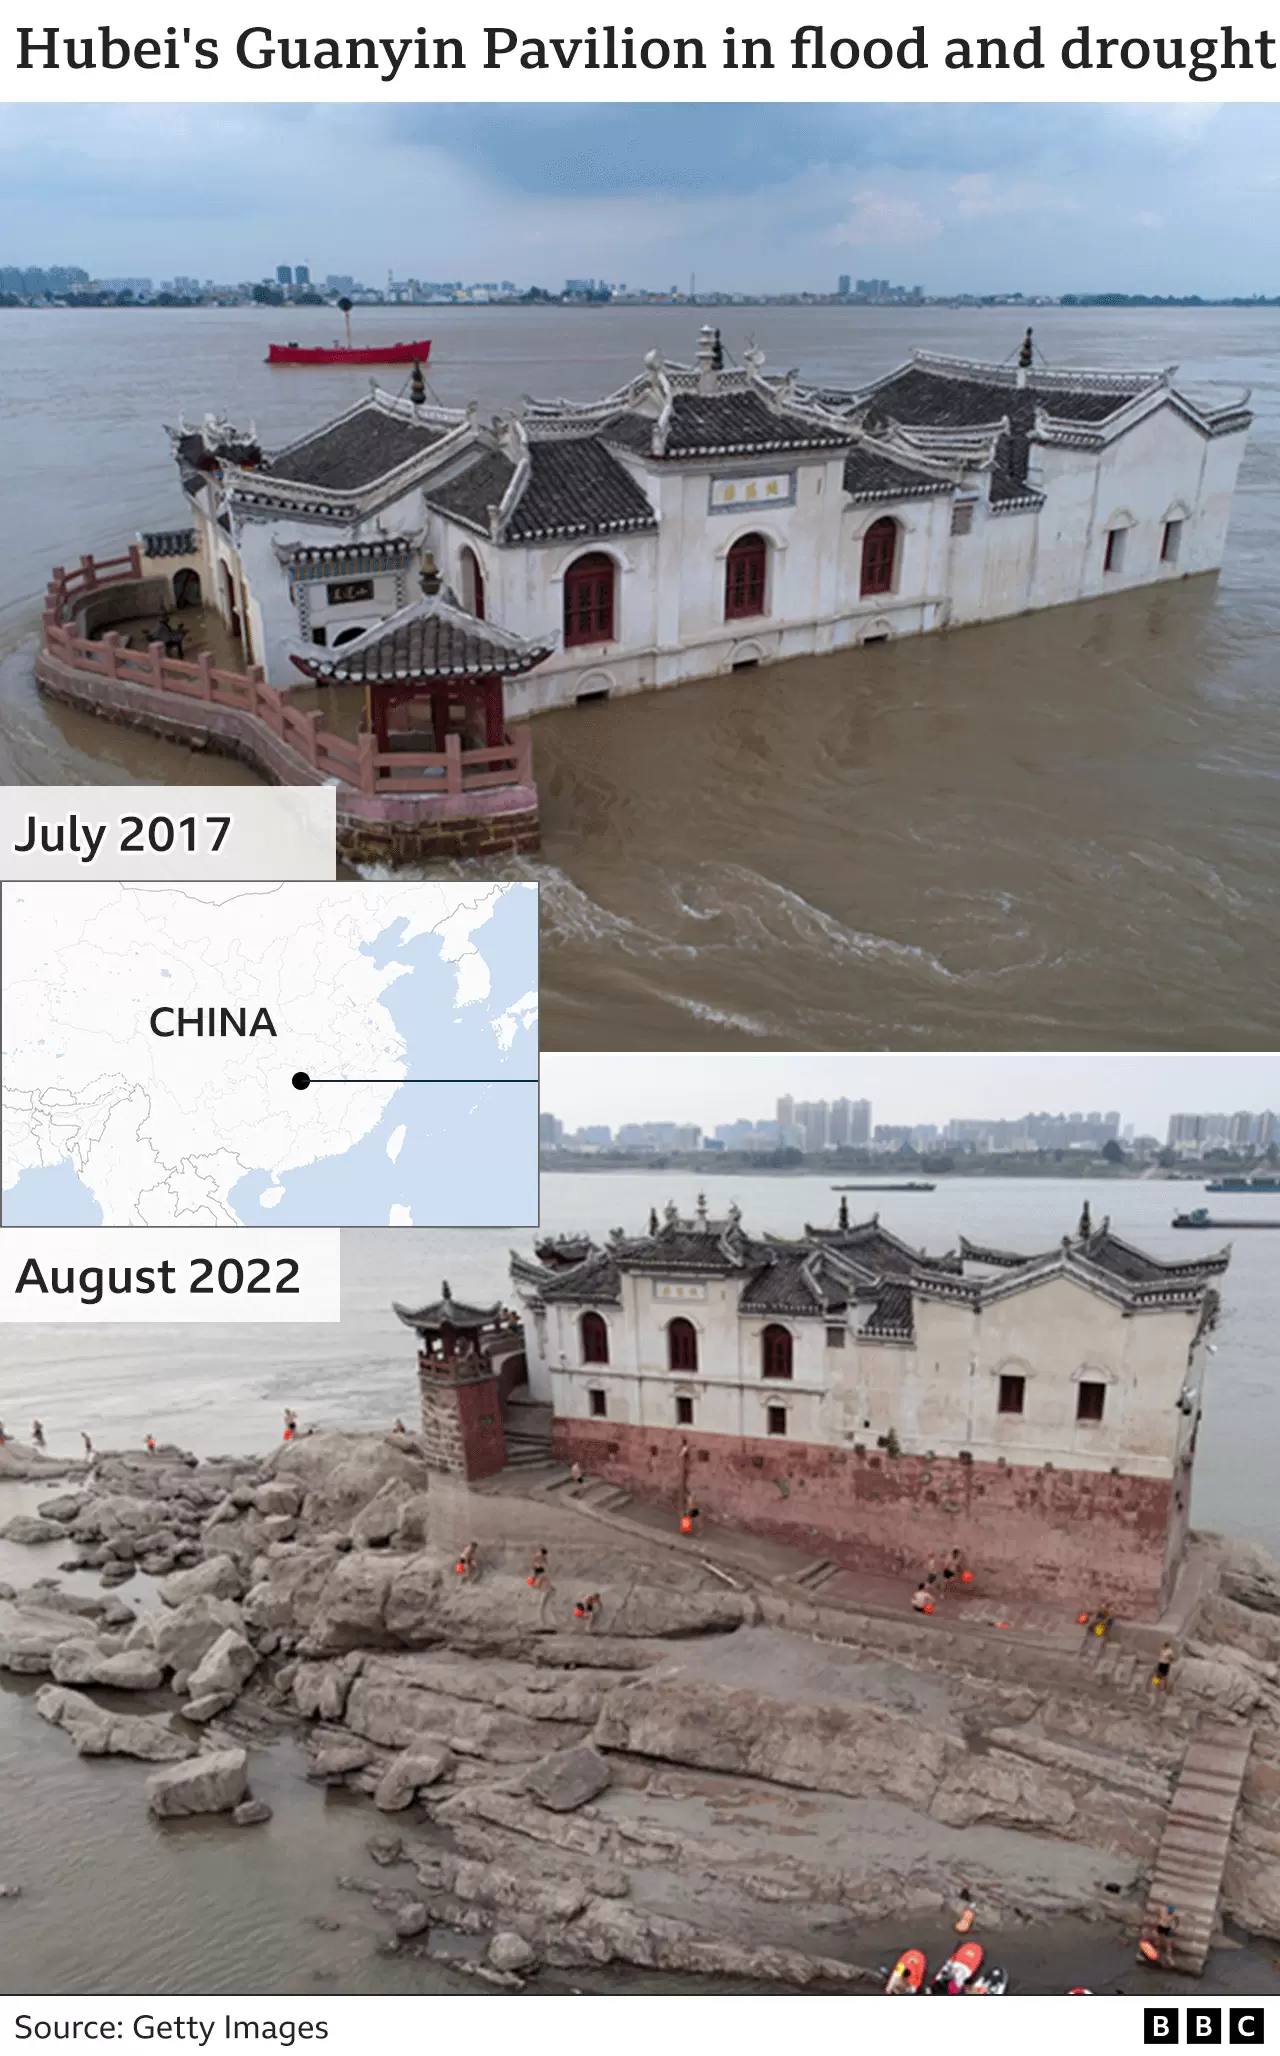
By Muizz Akhtar 29 September 2022 (Vox) – China just finished one of its most disastrous summers on record, with record-breaking heat, drought, and wildfires leading to water shortages even into the fall. More than 900 million people — or about 64 percent of China’s population — faced brutal heat waves alone, highlighting how much further the nation has to […]
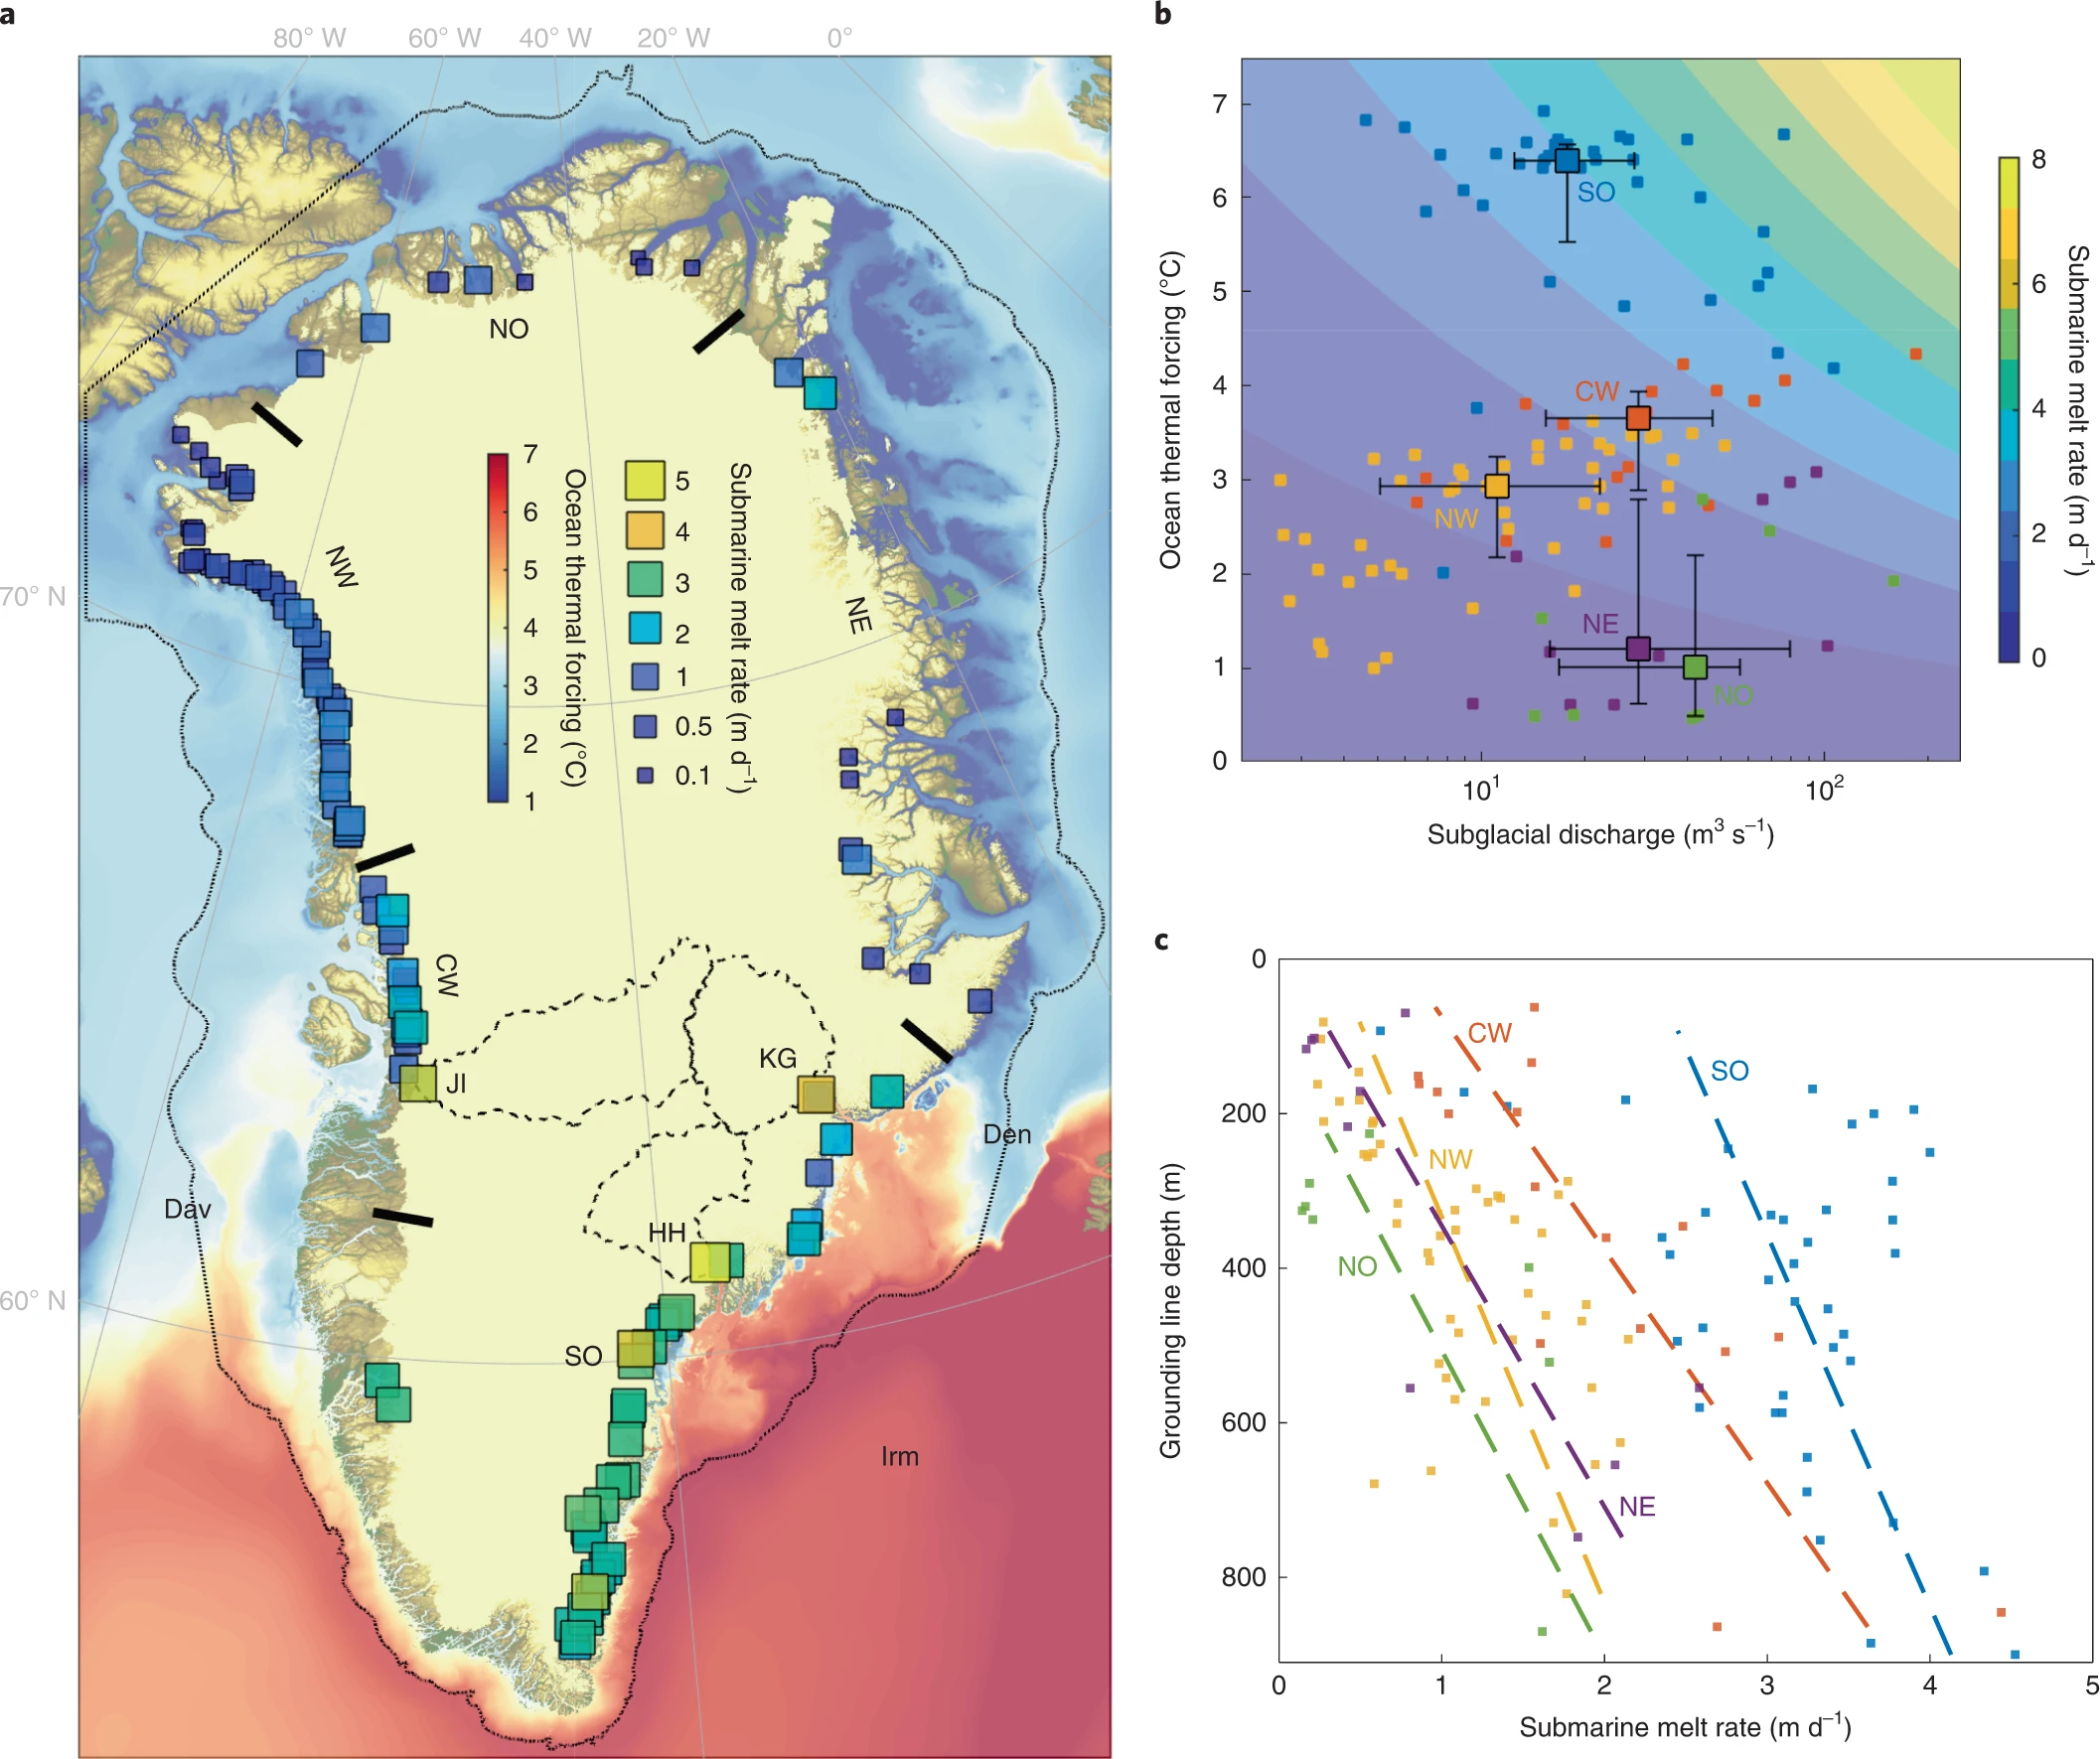
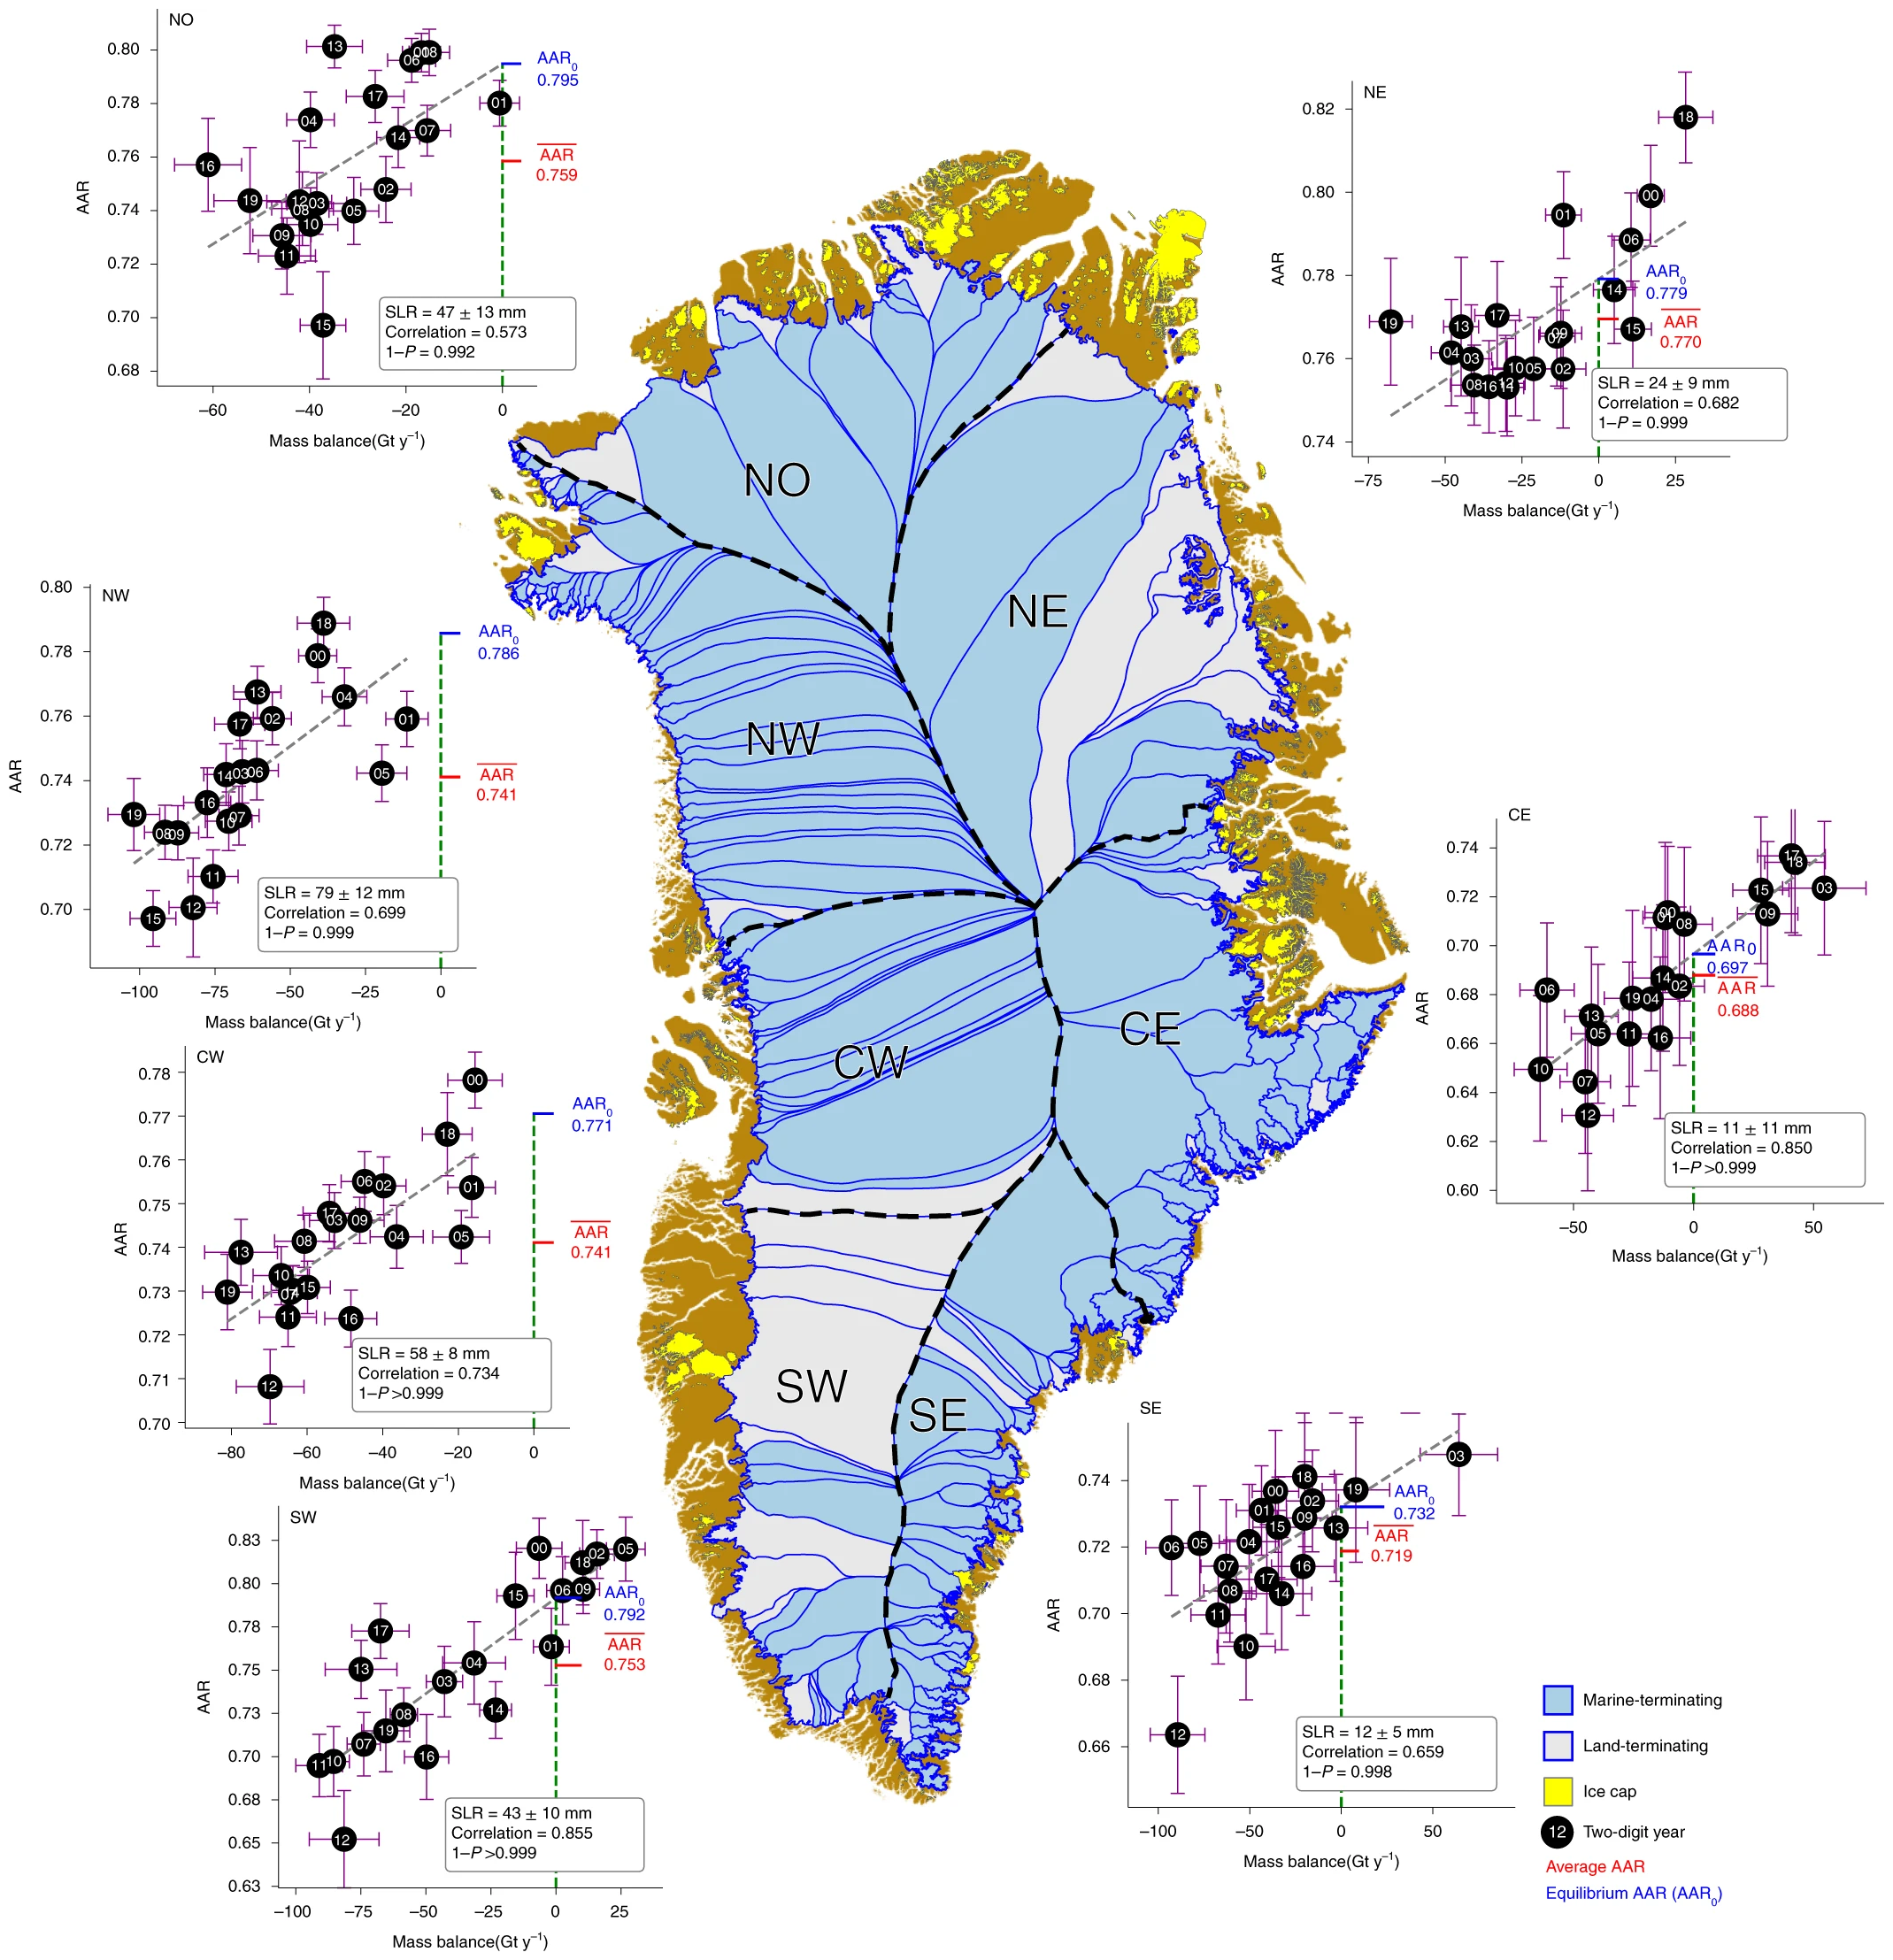
By Rachel Koning Beals 17 October 2022 (MarketWatch) – The Greenland ice sheet — one of the two most important glaciers of its kind on Earth — may be even more sensitive to the warming climate than scientists previously thought. The findings, published in the journal Nature Geoscience, shed fresh light on the forces driving ice […]
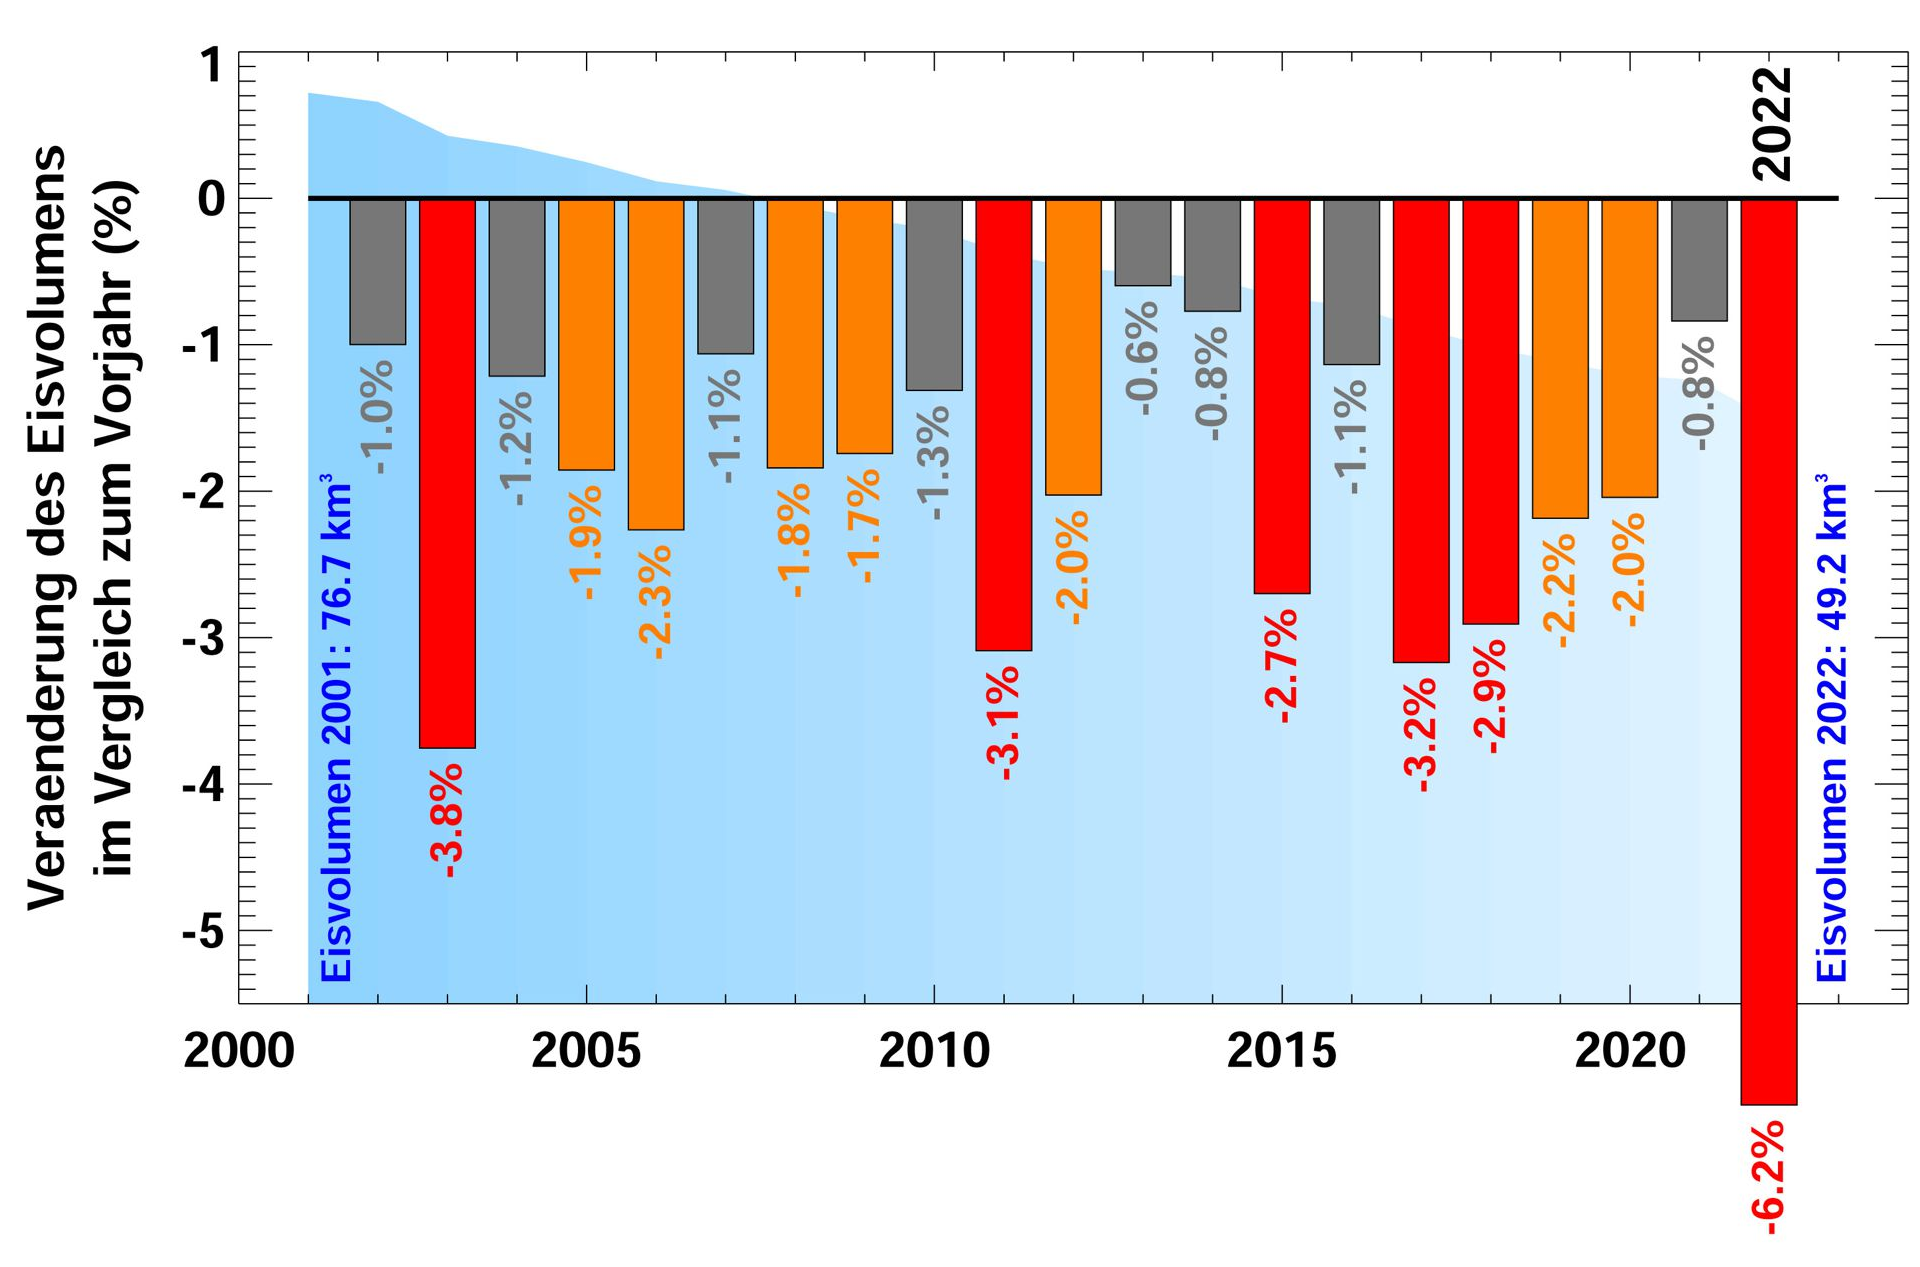
By Jamey Keaten 28 September 2022 GENEVA (AP) – Switzerland’s glaciers are melting like never before, an academic study released Wednesday found, with their ice volume declining by 6% this year amid rising concerns about global warming and a summer heat wave that swept across Europe. The Swiss Academy of Sciences reported that the shrinkage […]
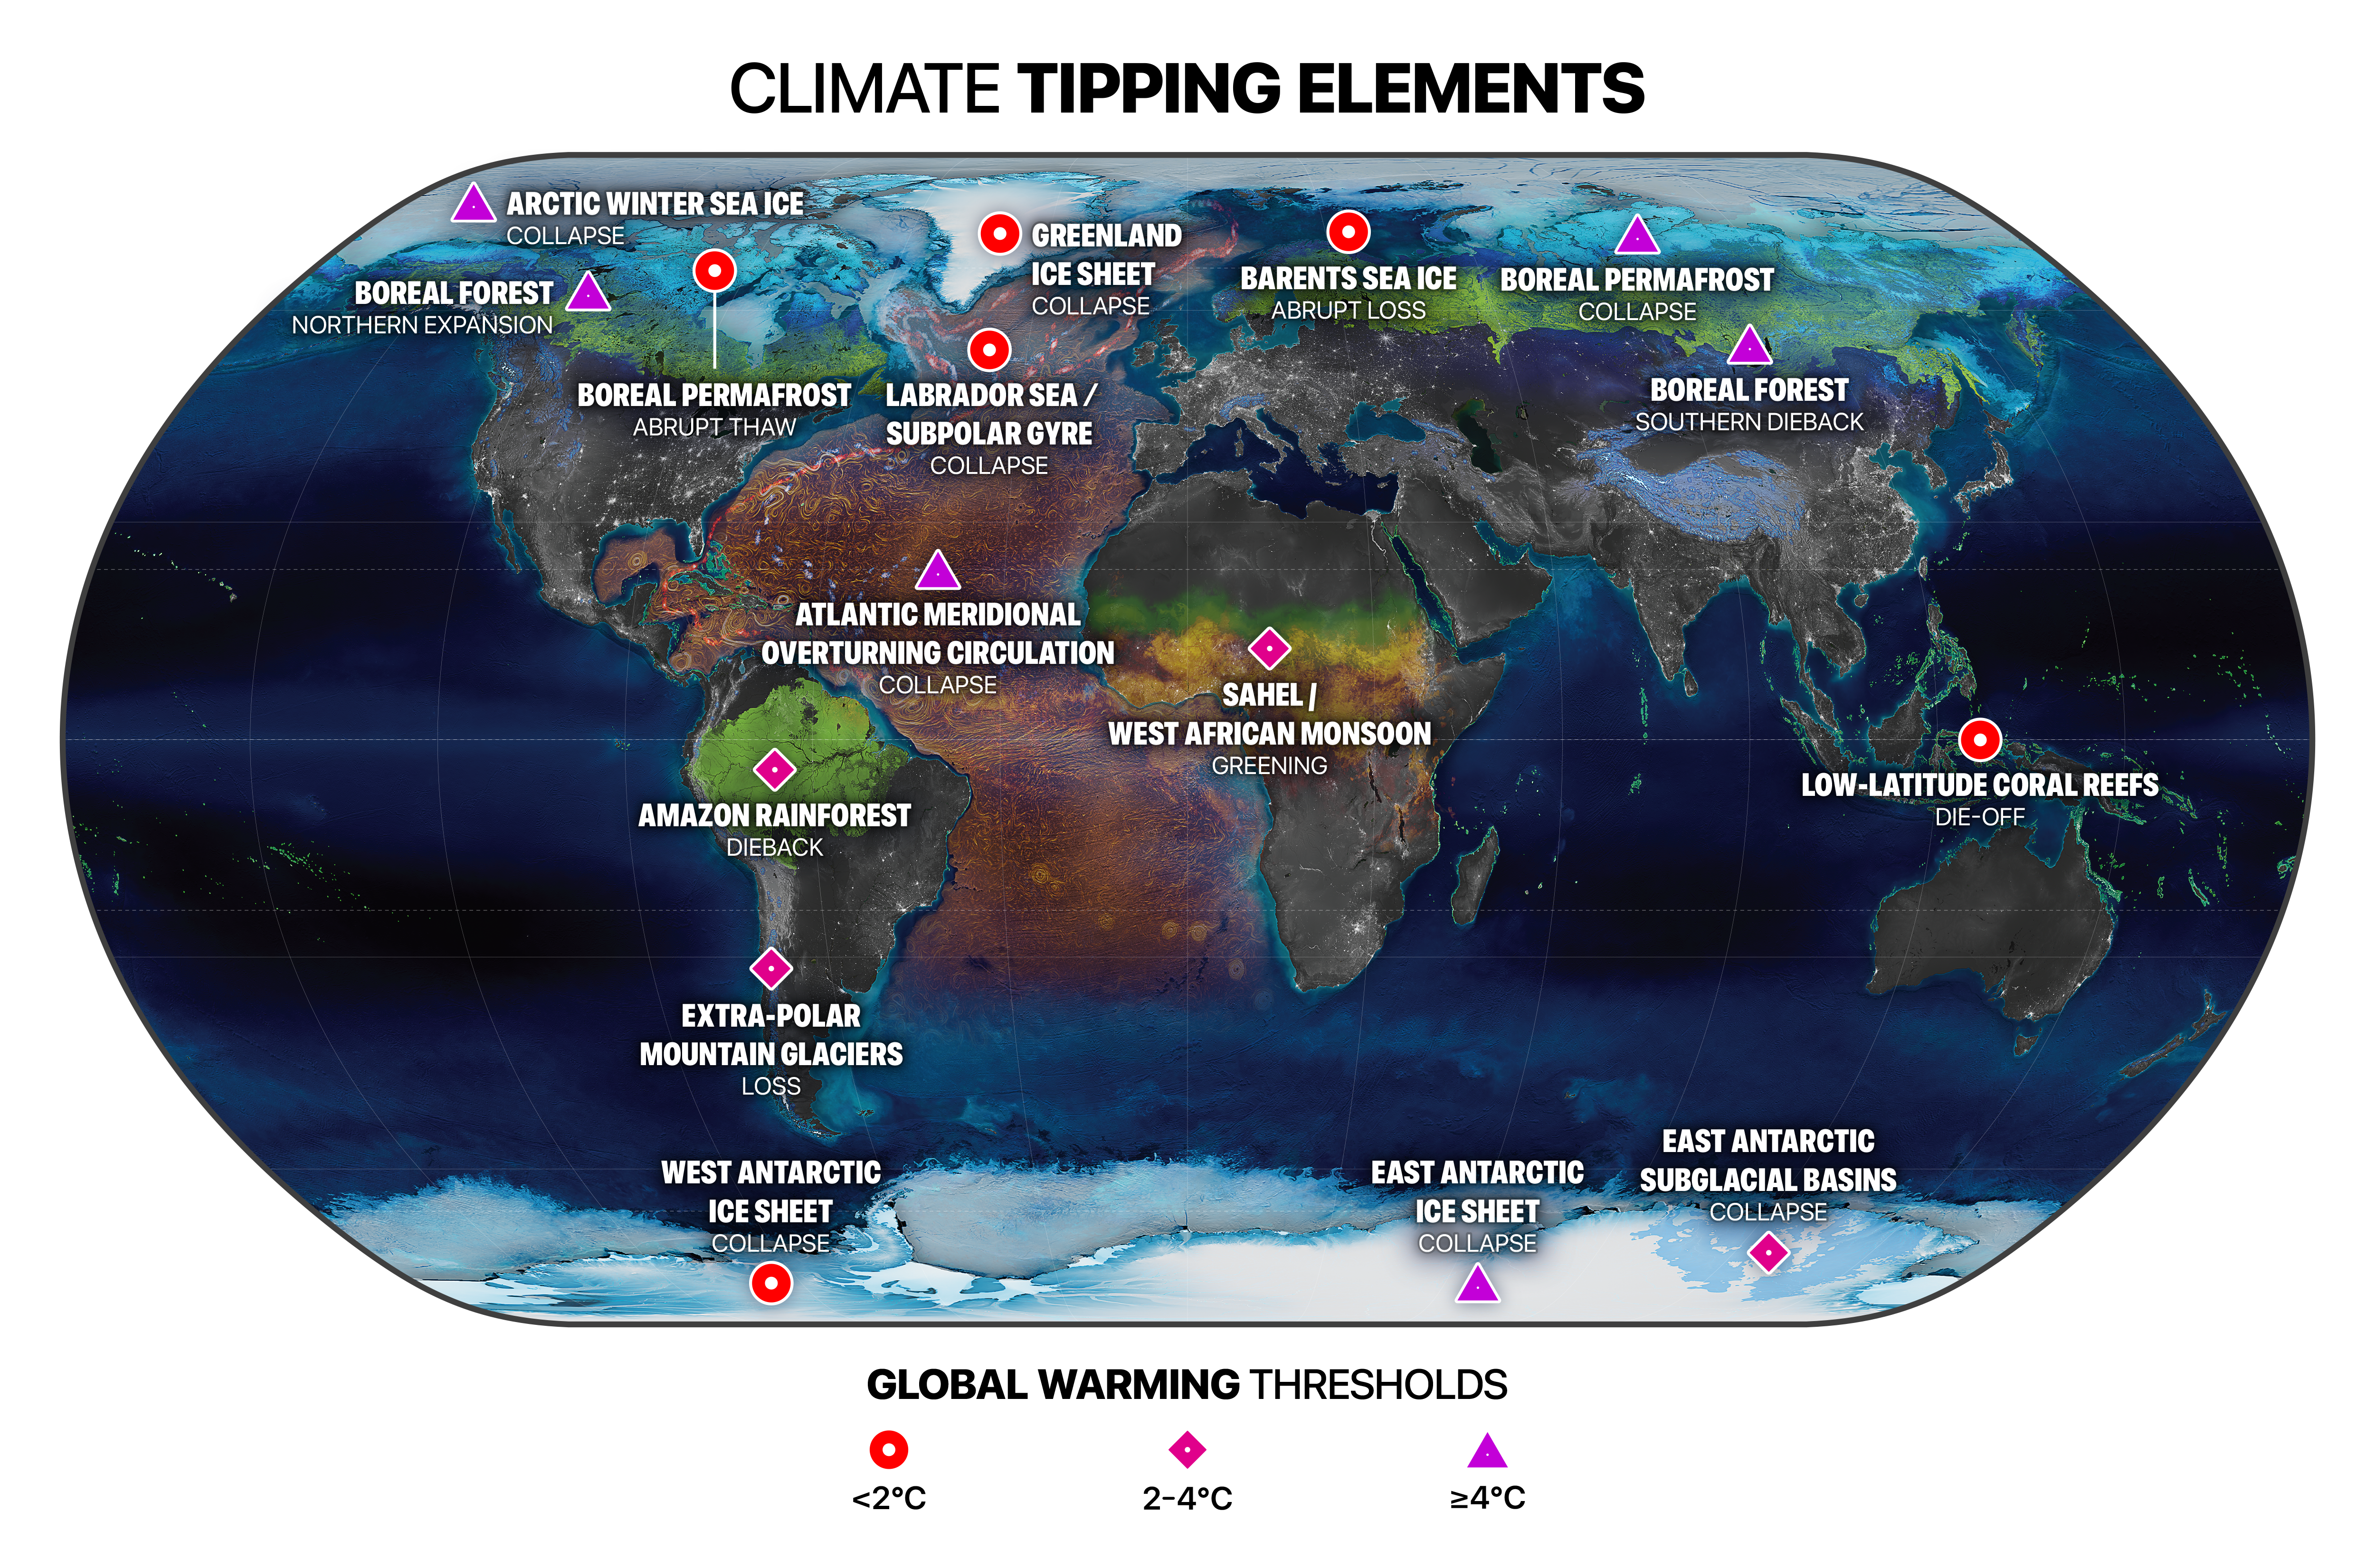
8 September 2022 (Stockholm Resilience Centre) – Multiple climate tipping points could be triggered if global temperature rises beyond 1.5°C above pre-industrial levels, according to a major new analysis published in the journal Science. Even at current levels of global heating the world is already at risk of passing five dangerous climate tipping points, and risks […]
By Matthew Rozsa 7 September 2022 (Salon) – That sea levels will rise as Earth’s ice melts is a prophecy that began to come true long ago, at the dawn of industrial civilization when humans began pumping vast amounts of greenhouse gases into the atmosphere. Yet the timeline for sea level rise is not yet fully understood, nor do we really […]
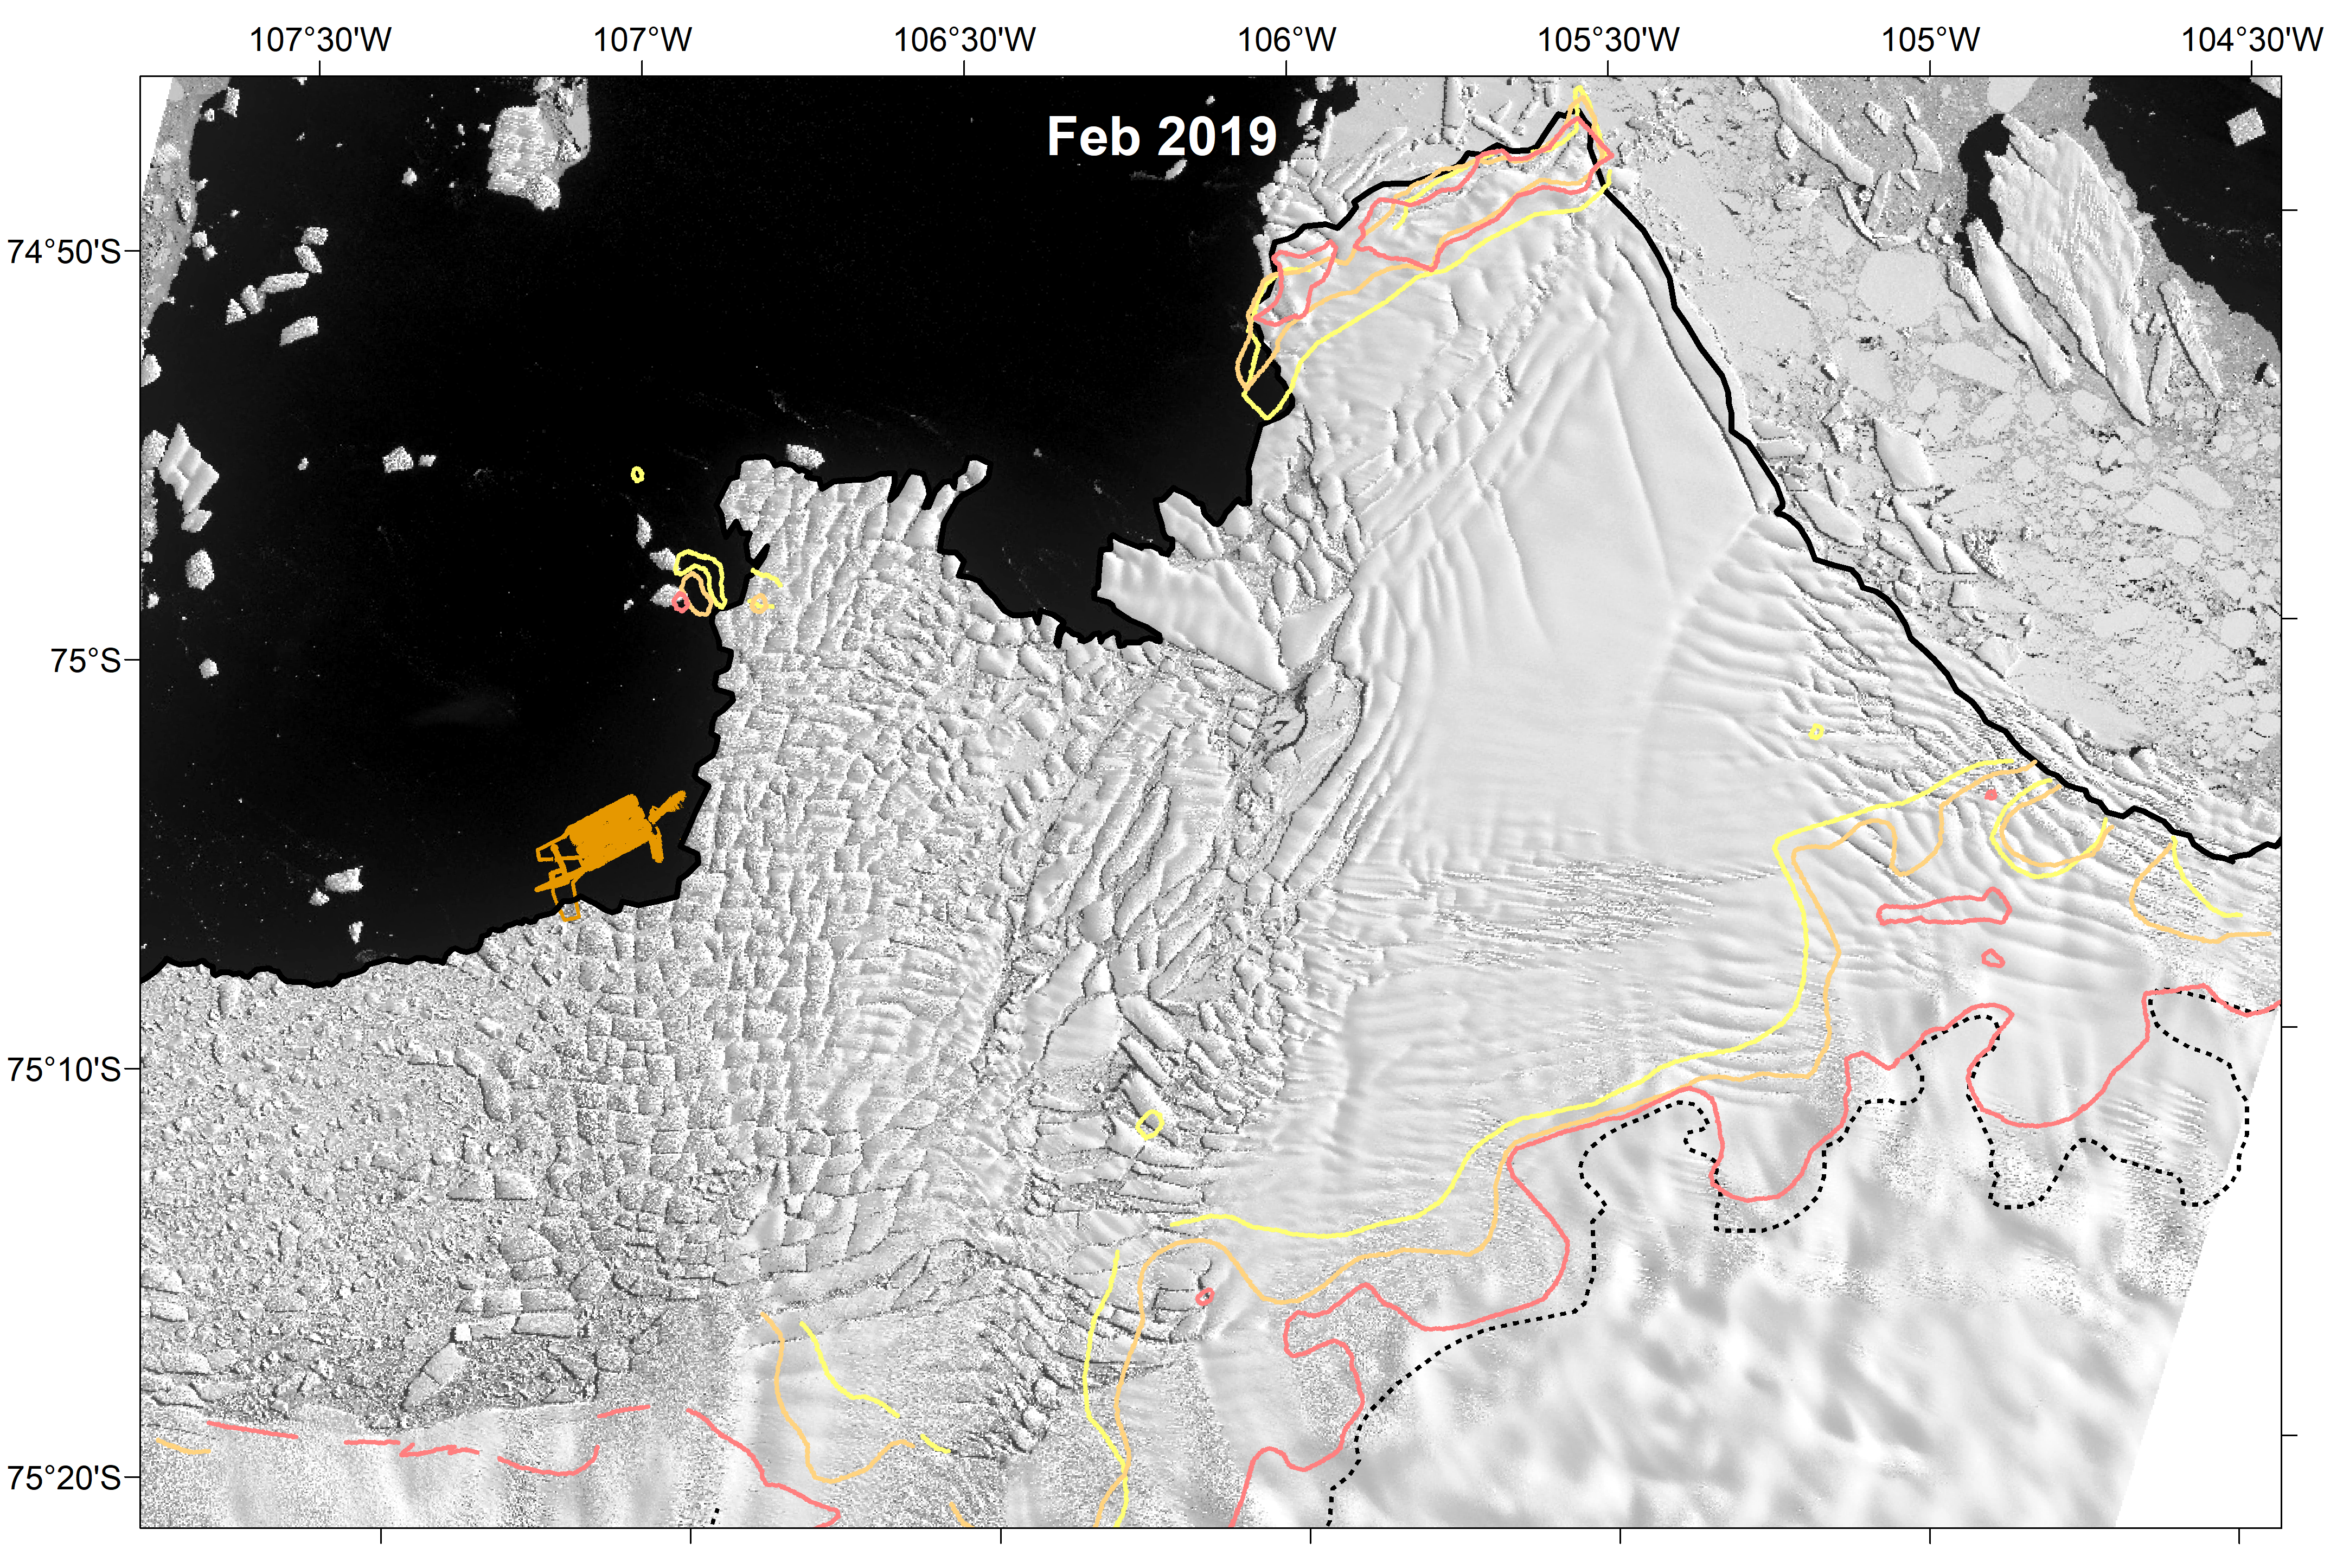
By Li Cohen 6 September 2022 (CBS News) – The loss of a glacier the size of Florida in Antarctica could wreak havoc on the world as scientists expect it would raise global sea levels up to 10 feet. It’s already melting at a fast rate — and scientists say its collapse may only rapidly […]
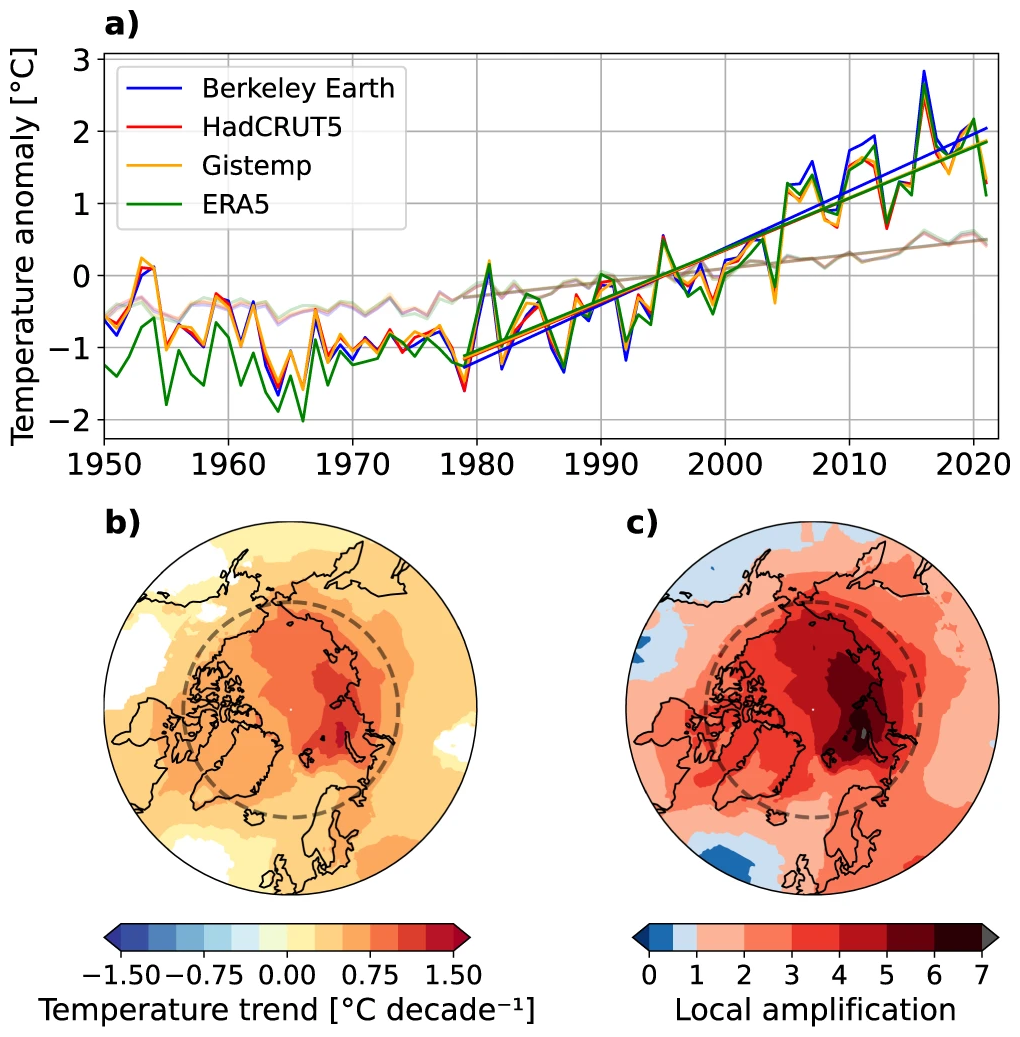
PARIS, 11 August 2022 (AFP) – The Arctic has warmed nearly four times faster than the rest of the planet over the last 40 years, according to research published Thursday that suggests climate models are underestimating the rate of polar heating. The United Nations’ climate science panel said in a special report in 2019 that […]
GENEVA, 18 May 2022 (WMO) – Four key climate change indicators – greenhouse gas concentrations, sea level rise, ocean heat and ocean acidification – set new records in 2021. This is yet another clear sign that human activities are causing planetary scale changes on land, in the ocean, and in the atmosphere, with harmful and […]