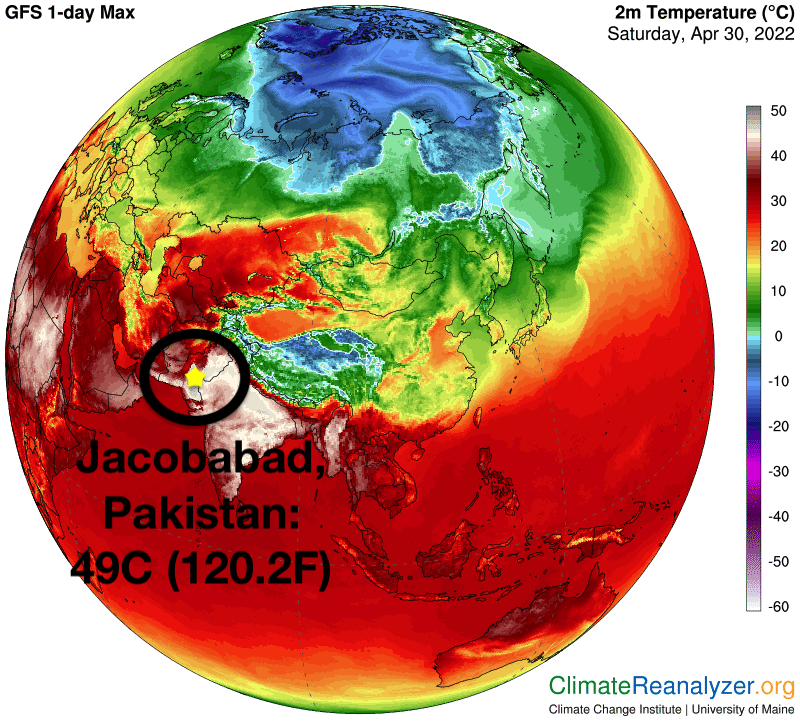
By Hannah Ellis-Petersen and Shah Meer Baloch 2 May 2022 DELHI and ISLAMABAD (The Guardian) – For the past few weeks, Nazeer Ahmed has been living in one of the hottest places on Earth. As a brutal heatwave has swept across India and Pakistan, his home in Turbat, in Pakistan’s Balochistan region, has been suffering […]
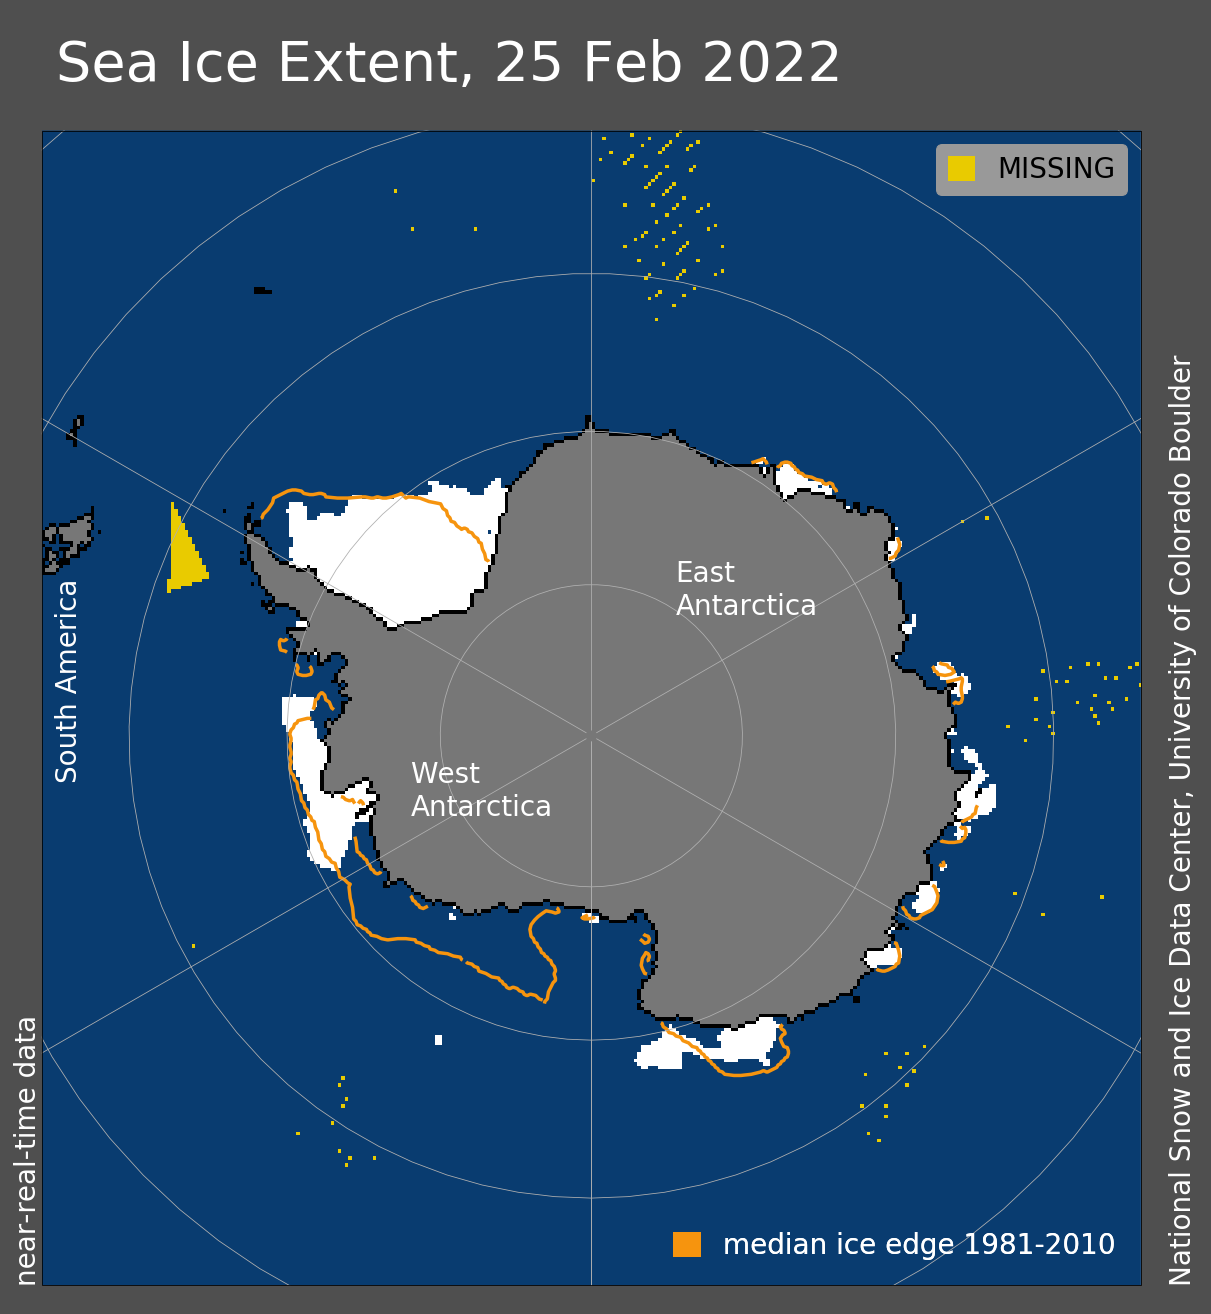
1 April 2022 (WMO) – Record high temperatures, rain and the collapse of an ice shelf in East Antarctica have prompted questions and concern about the possible role of climate change in the coldest and driest part of the world. Record high temperatures, rain and the collapse of an ice shelf in East Antarctica have […]
By Isla Binnie 25 March 2022 (Reuters) – An East Antarctica ice shelf disintegrated this month following a period of extreme heat in the region, according to scientists. Satellite images show the 1,200 square-kilometre Conger Ice Shelf collapsed completely on or around March 15. “Possible it hit its tipping point following the #Antarctic #AtmosphericRiver and […]
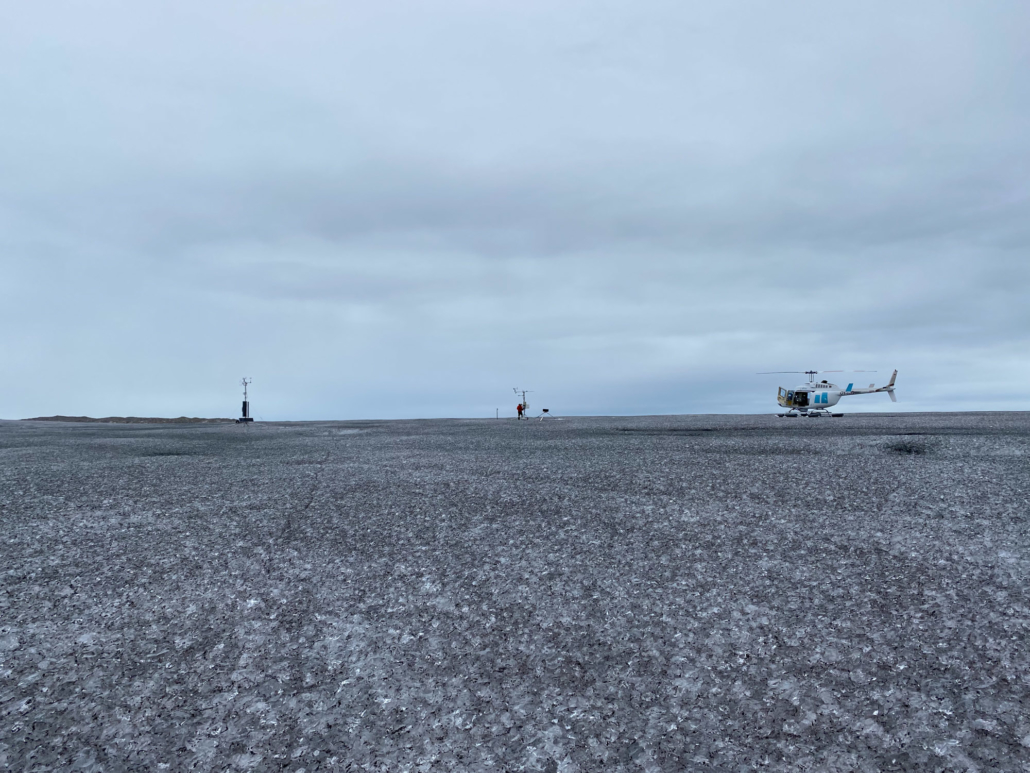
5 January 2022 (PROMICE) – GEUS and PROMICE professor Jason Box recently made the front page in Danish national media with testimony of algal blooms and rain on the Greenland ice sheet. PROMICE field work helps quantify the ice algae blooms and their effect on melting. In Autumn 2021, Professor Jason Box and two PROMICE […]
AMHERST, Massachusetts, 15 December 2021 (University of Massachusetts Amherst) – New research from the University of Massachusetts Amherst provides a novel answer to one of the persistent questions in historical climatology, environmental history and the earth sciences: what caused the Little Ice Age? The answer, we now know, is a paradox: warming. The Little Ice […]
By Denise Chow 1 December 2021 (NBC News) – The Sierra Nevada snowpack, a major source of water for California, could largely disappear in 25 years if global warming continues unchecked, according to a recent study. The worrisome findings, published 26 October 2021 in the journal Nature Reviews Earth & Environment, have serious implications for California’s […]
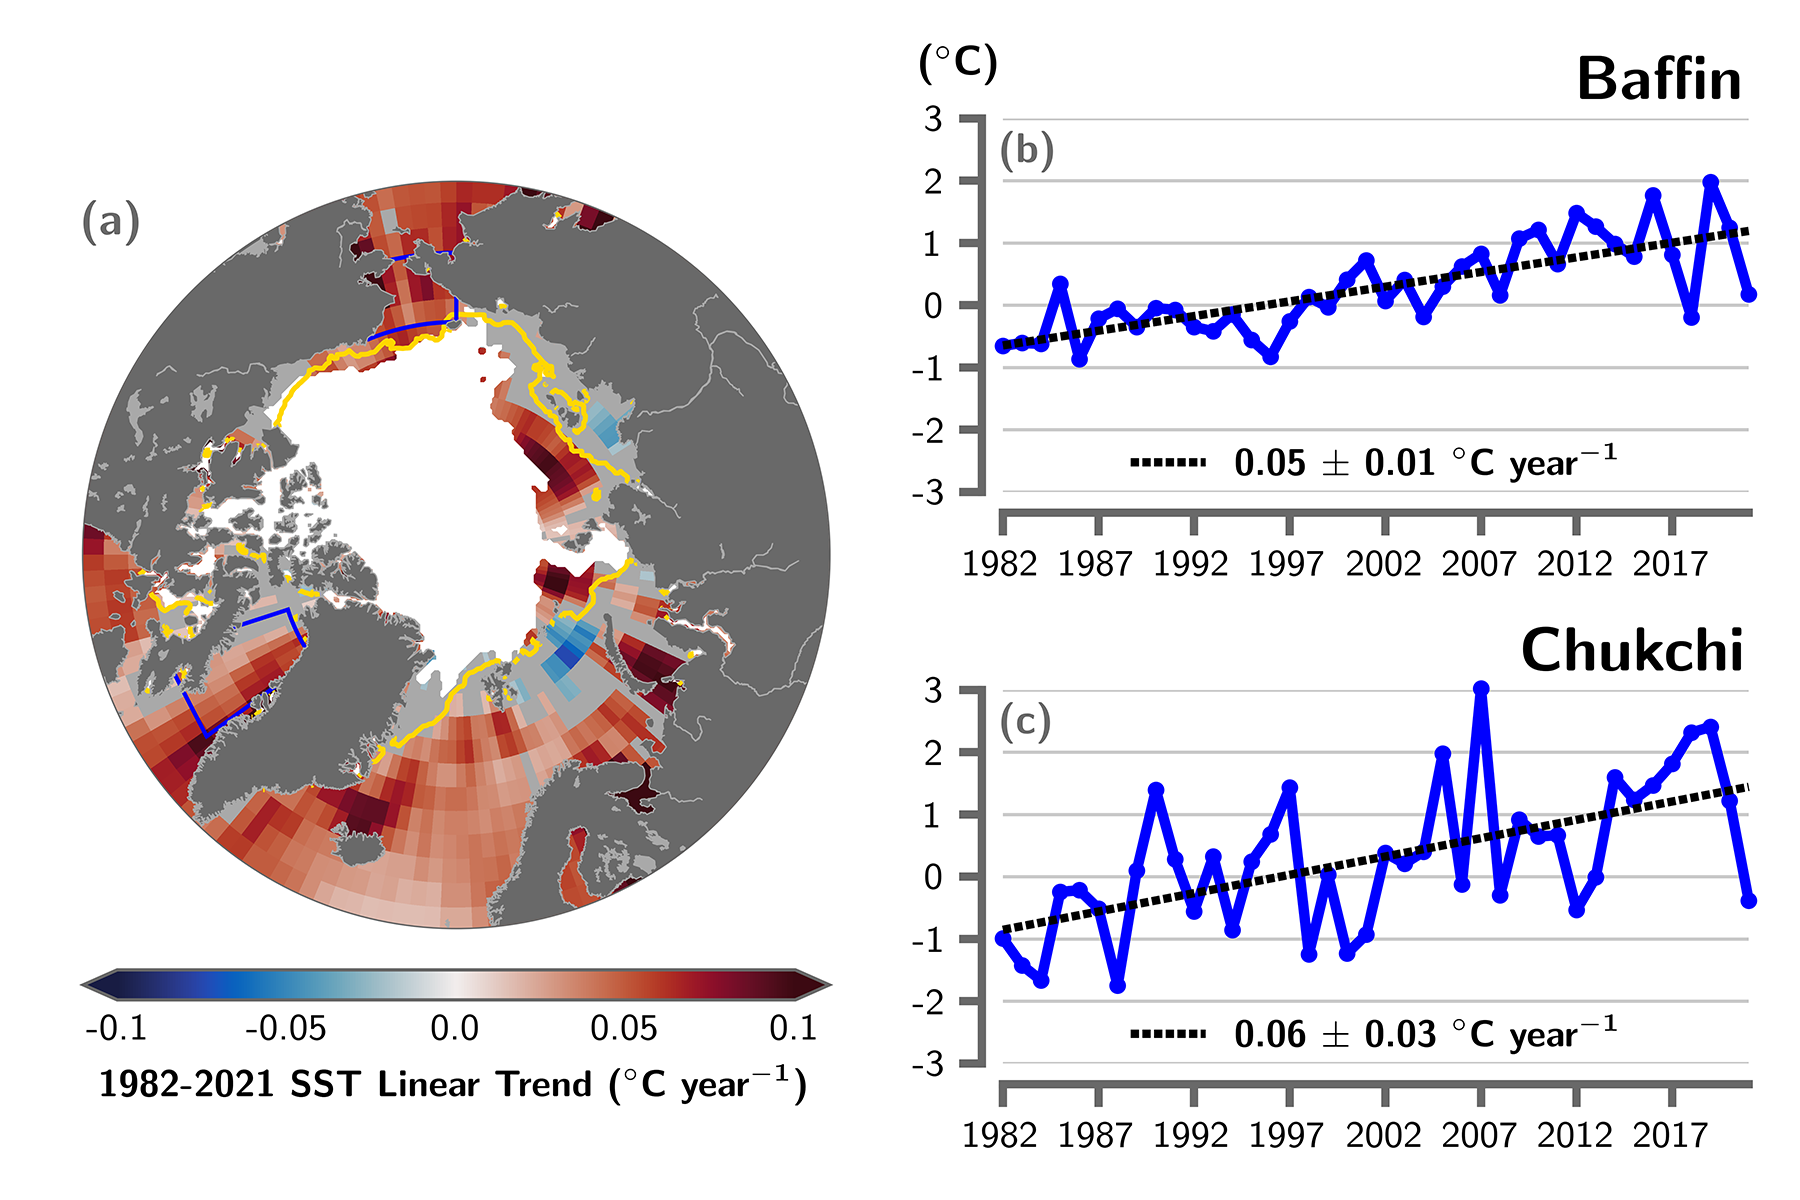
By T. A. Moon, M. L. Druckenmiller, and R. L. Thoman 6 December 2021 (NOAA) – As the influences of human-caused global warming continue to intensify, with the Arctic warming significantly faster than the globe overall, the 2021 Arctic Report Card (ARC2021) brings a broad view of the state of the Arctic climate and environment. […]
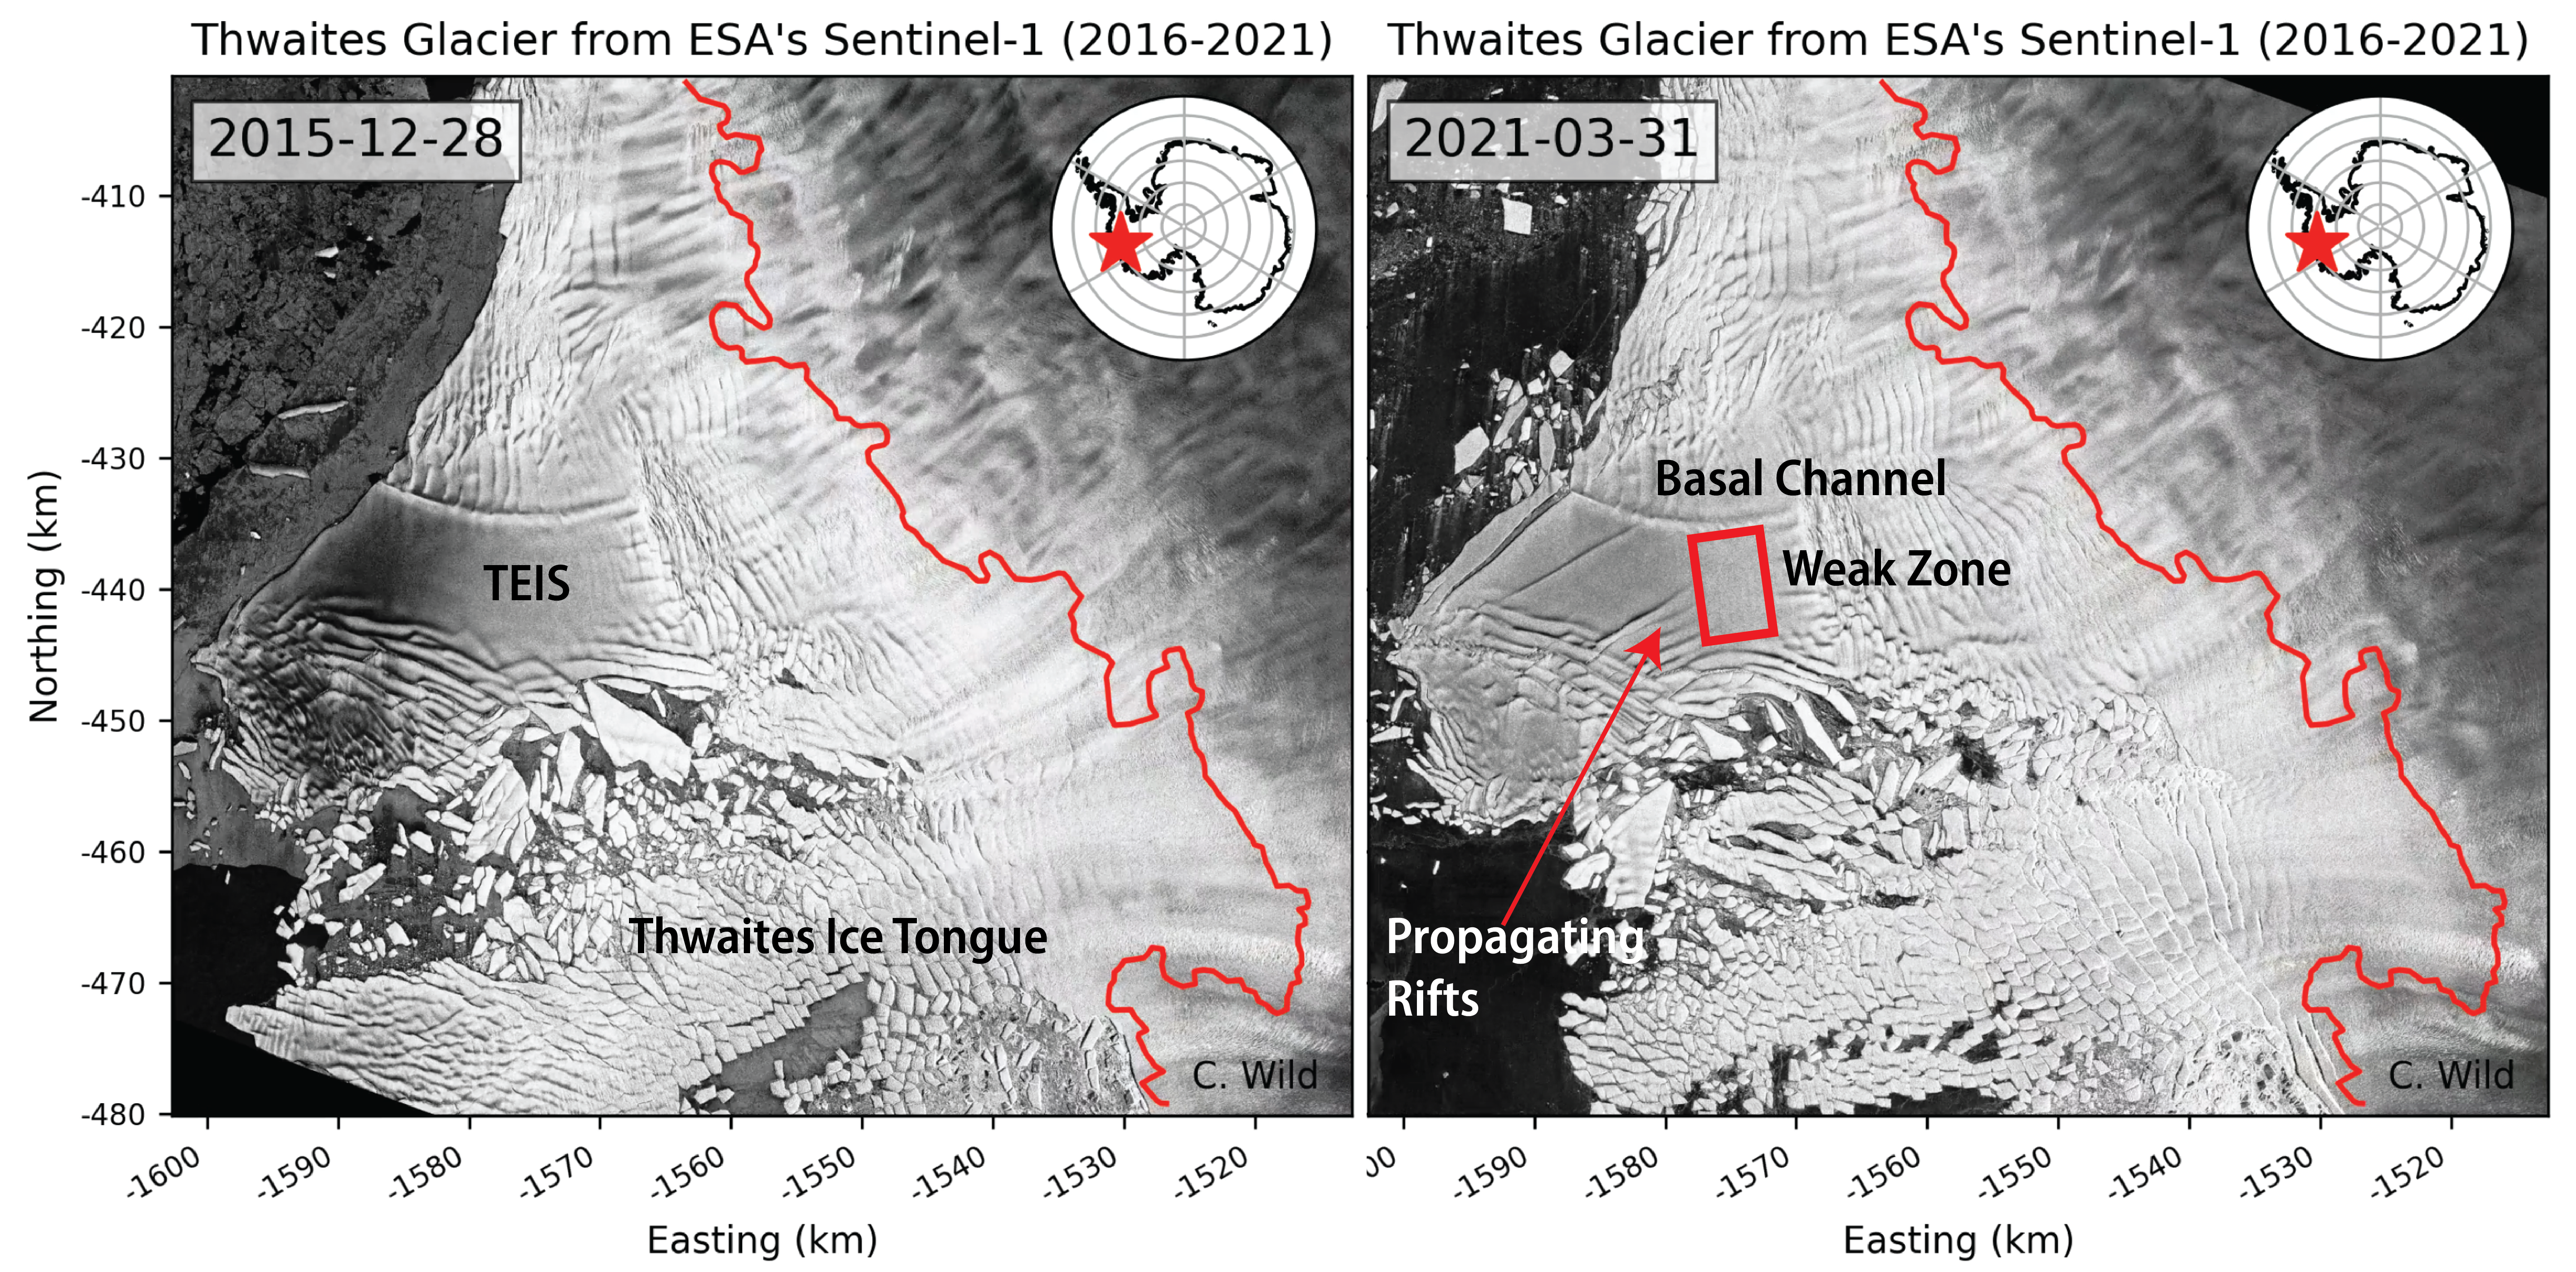
By Ella Gilbert 22 December 2021 (The Conversation) – The massive Thwaites glacier in West Antarctica contains enough ice to raise global sea levels by 65 centimeters if it were to completely collapse. And, worryingly, recent research suggests that its long-term stability is doubtful as the glacier haemorrhages more and more ice. Adding 65 centimeters to global sea levels […]
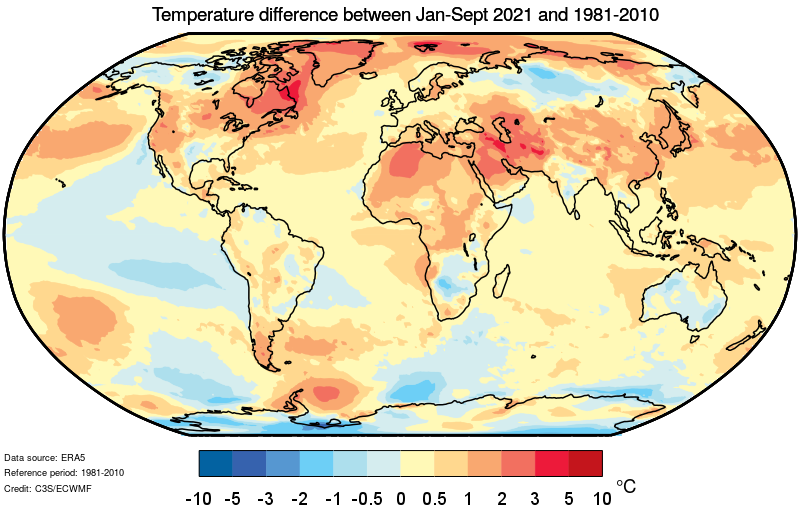
GENEVA, 31 October 2021 (WMO) – Record atmospheric greenhouse gas concentrations and associated accumulated heat have propelled the planet into uncharted territory, with far-reaching repercussions for current and future generations, according to the World Meteorological Organization (WMO). The past seven years are on track to be the seven warmest on record, according to the provisional WMO […]
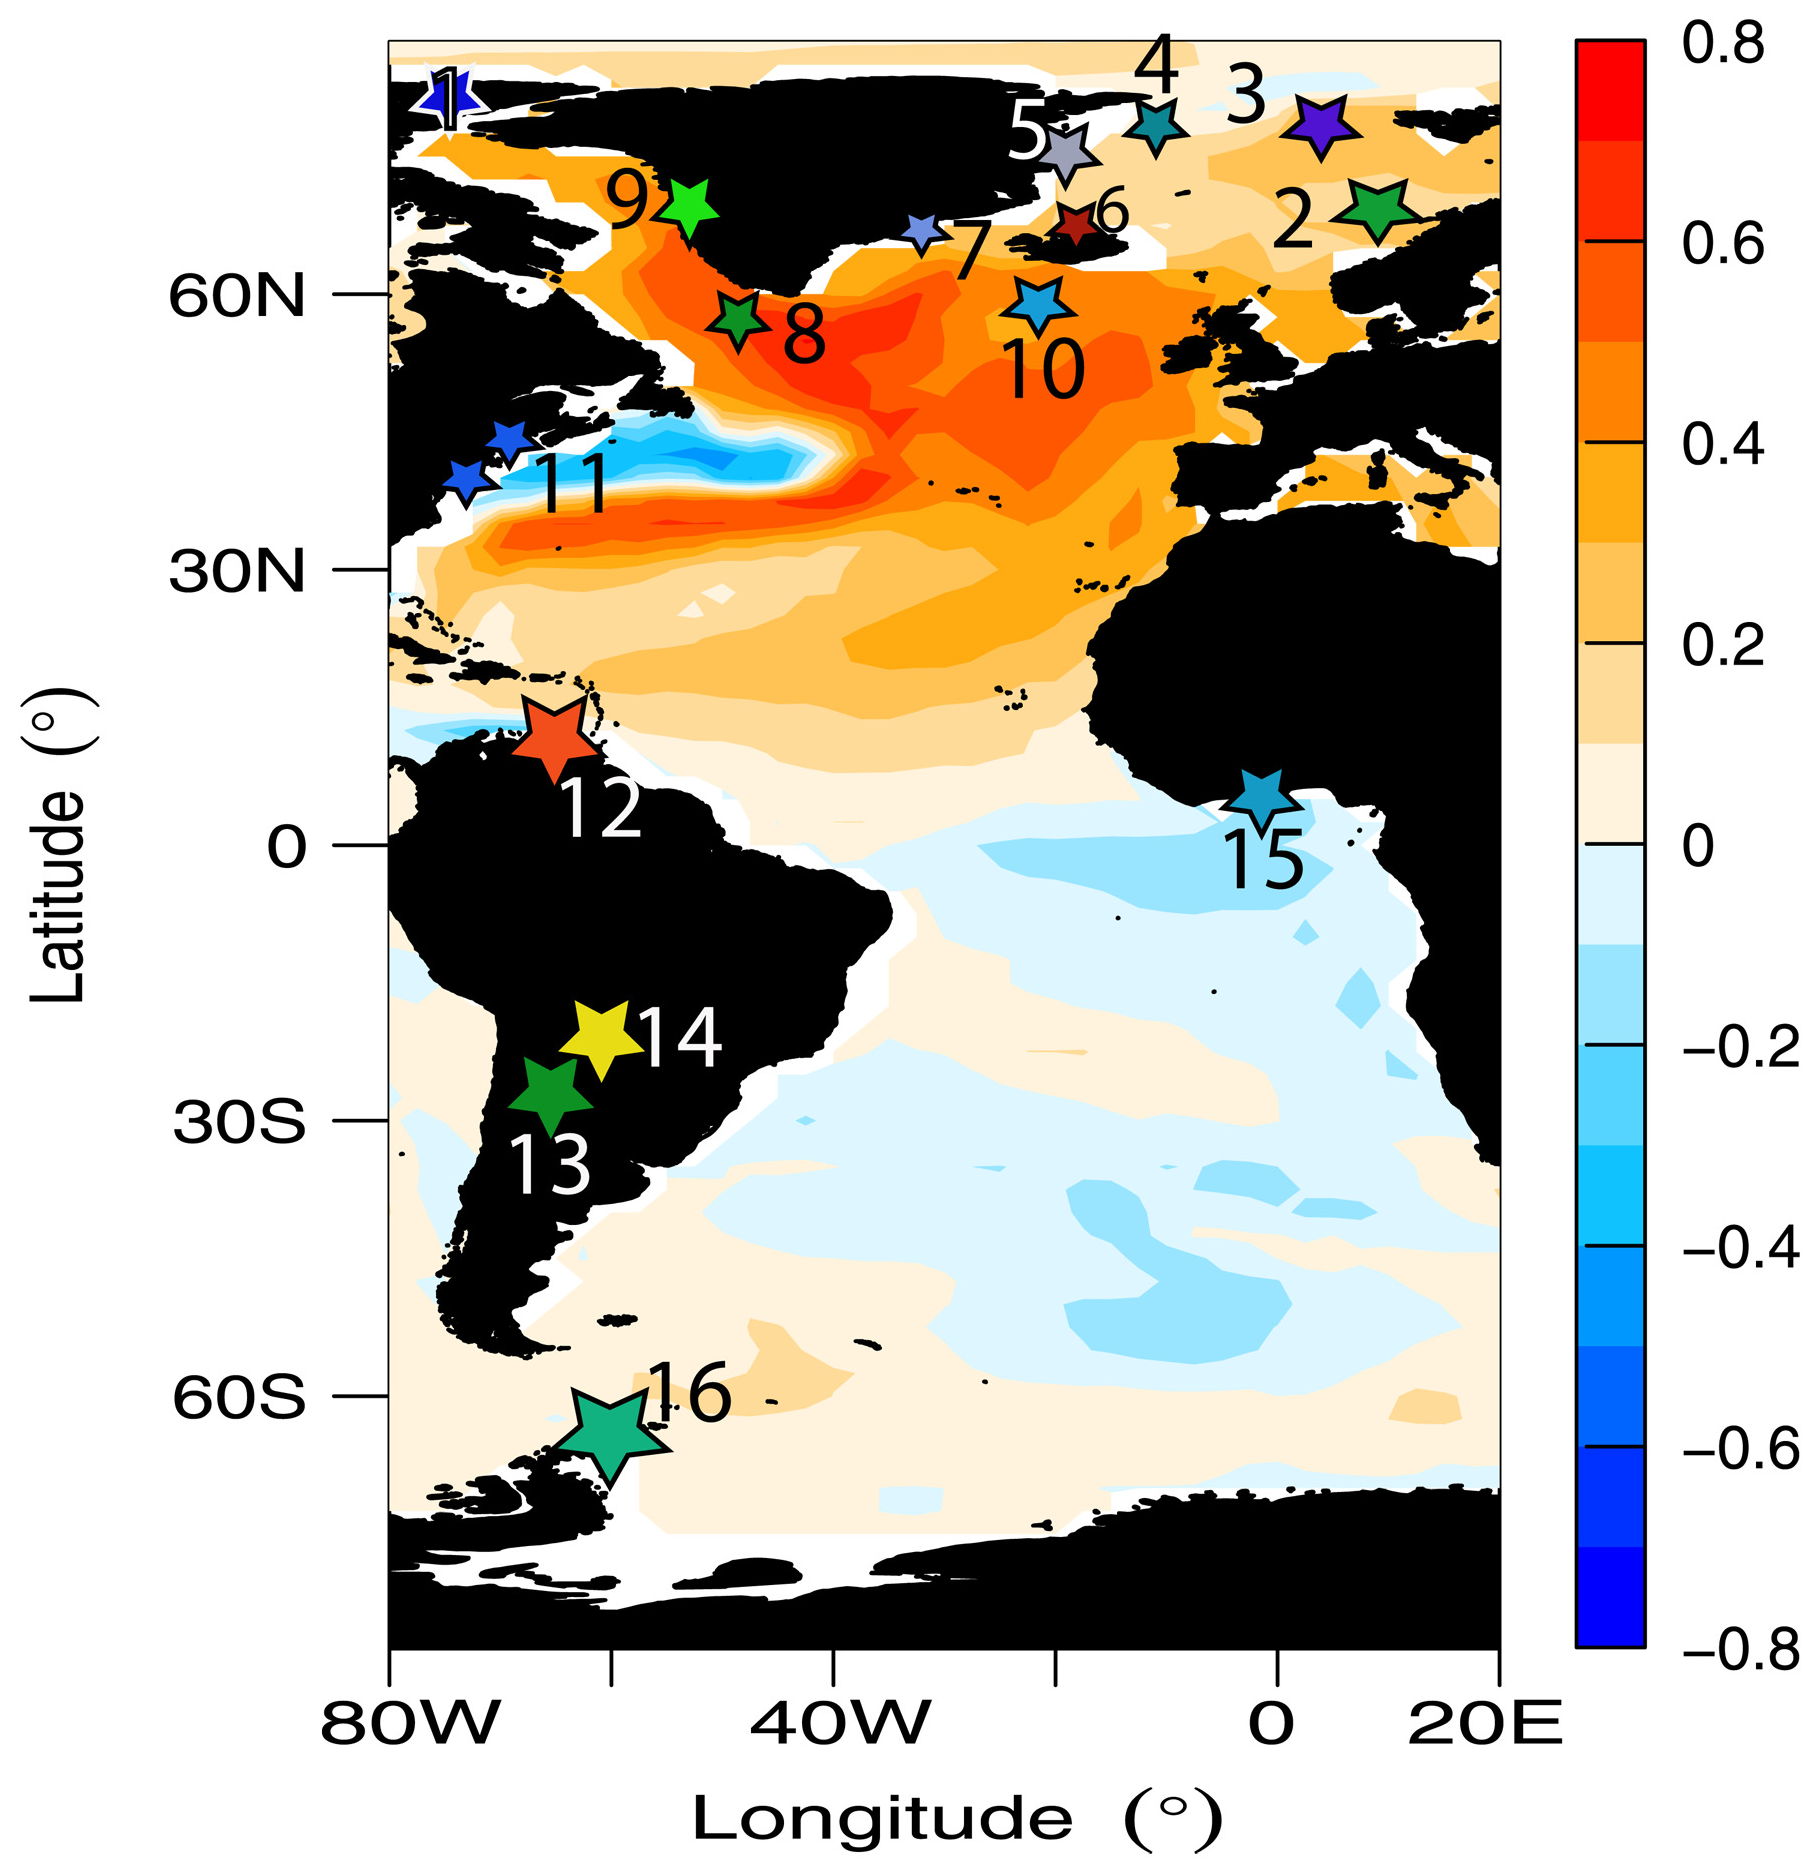
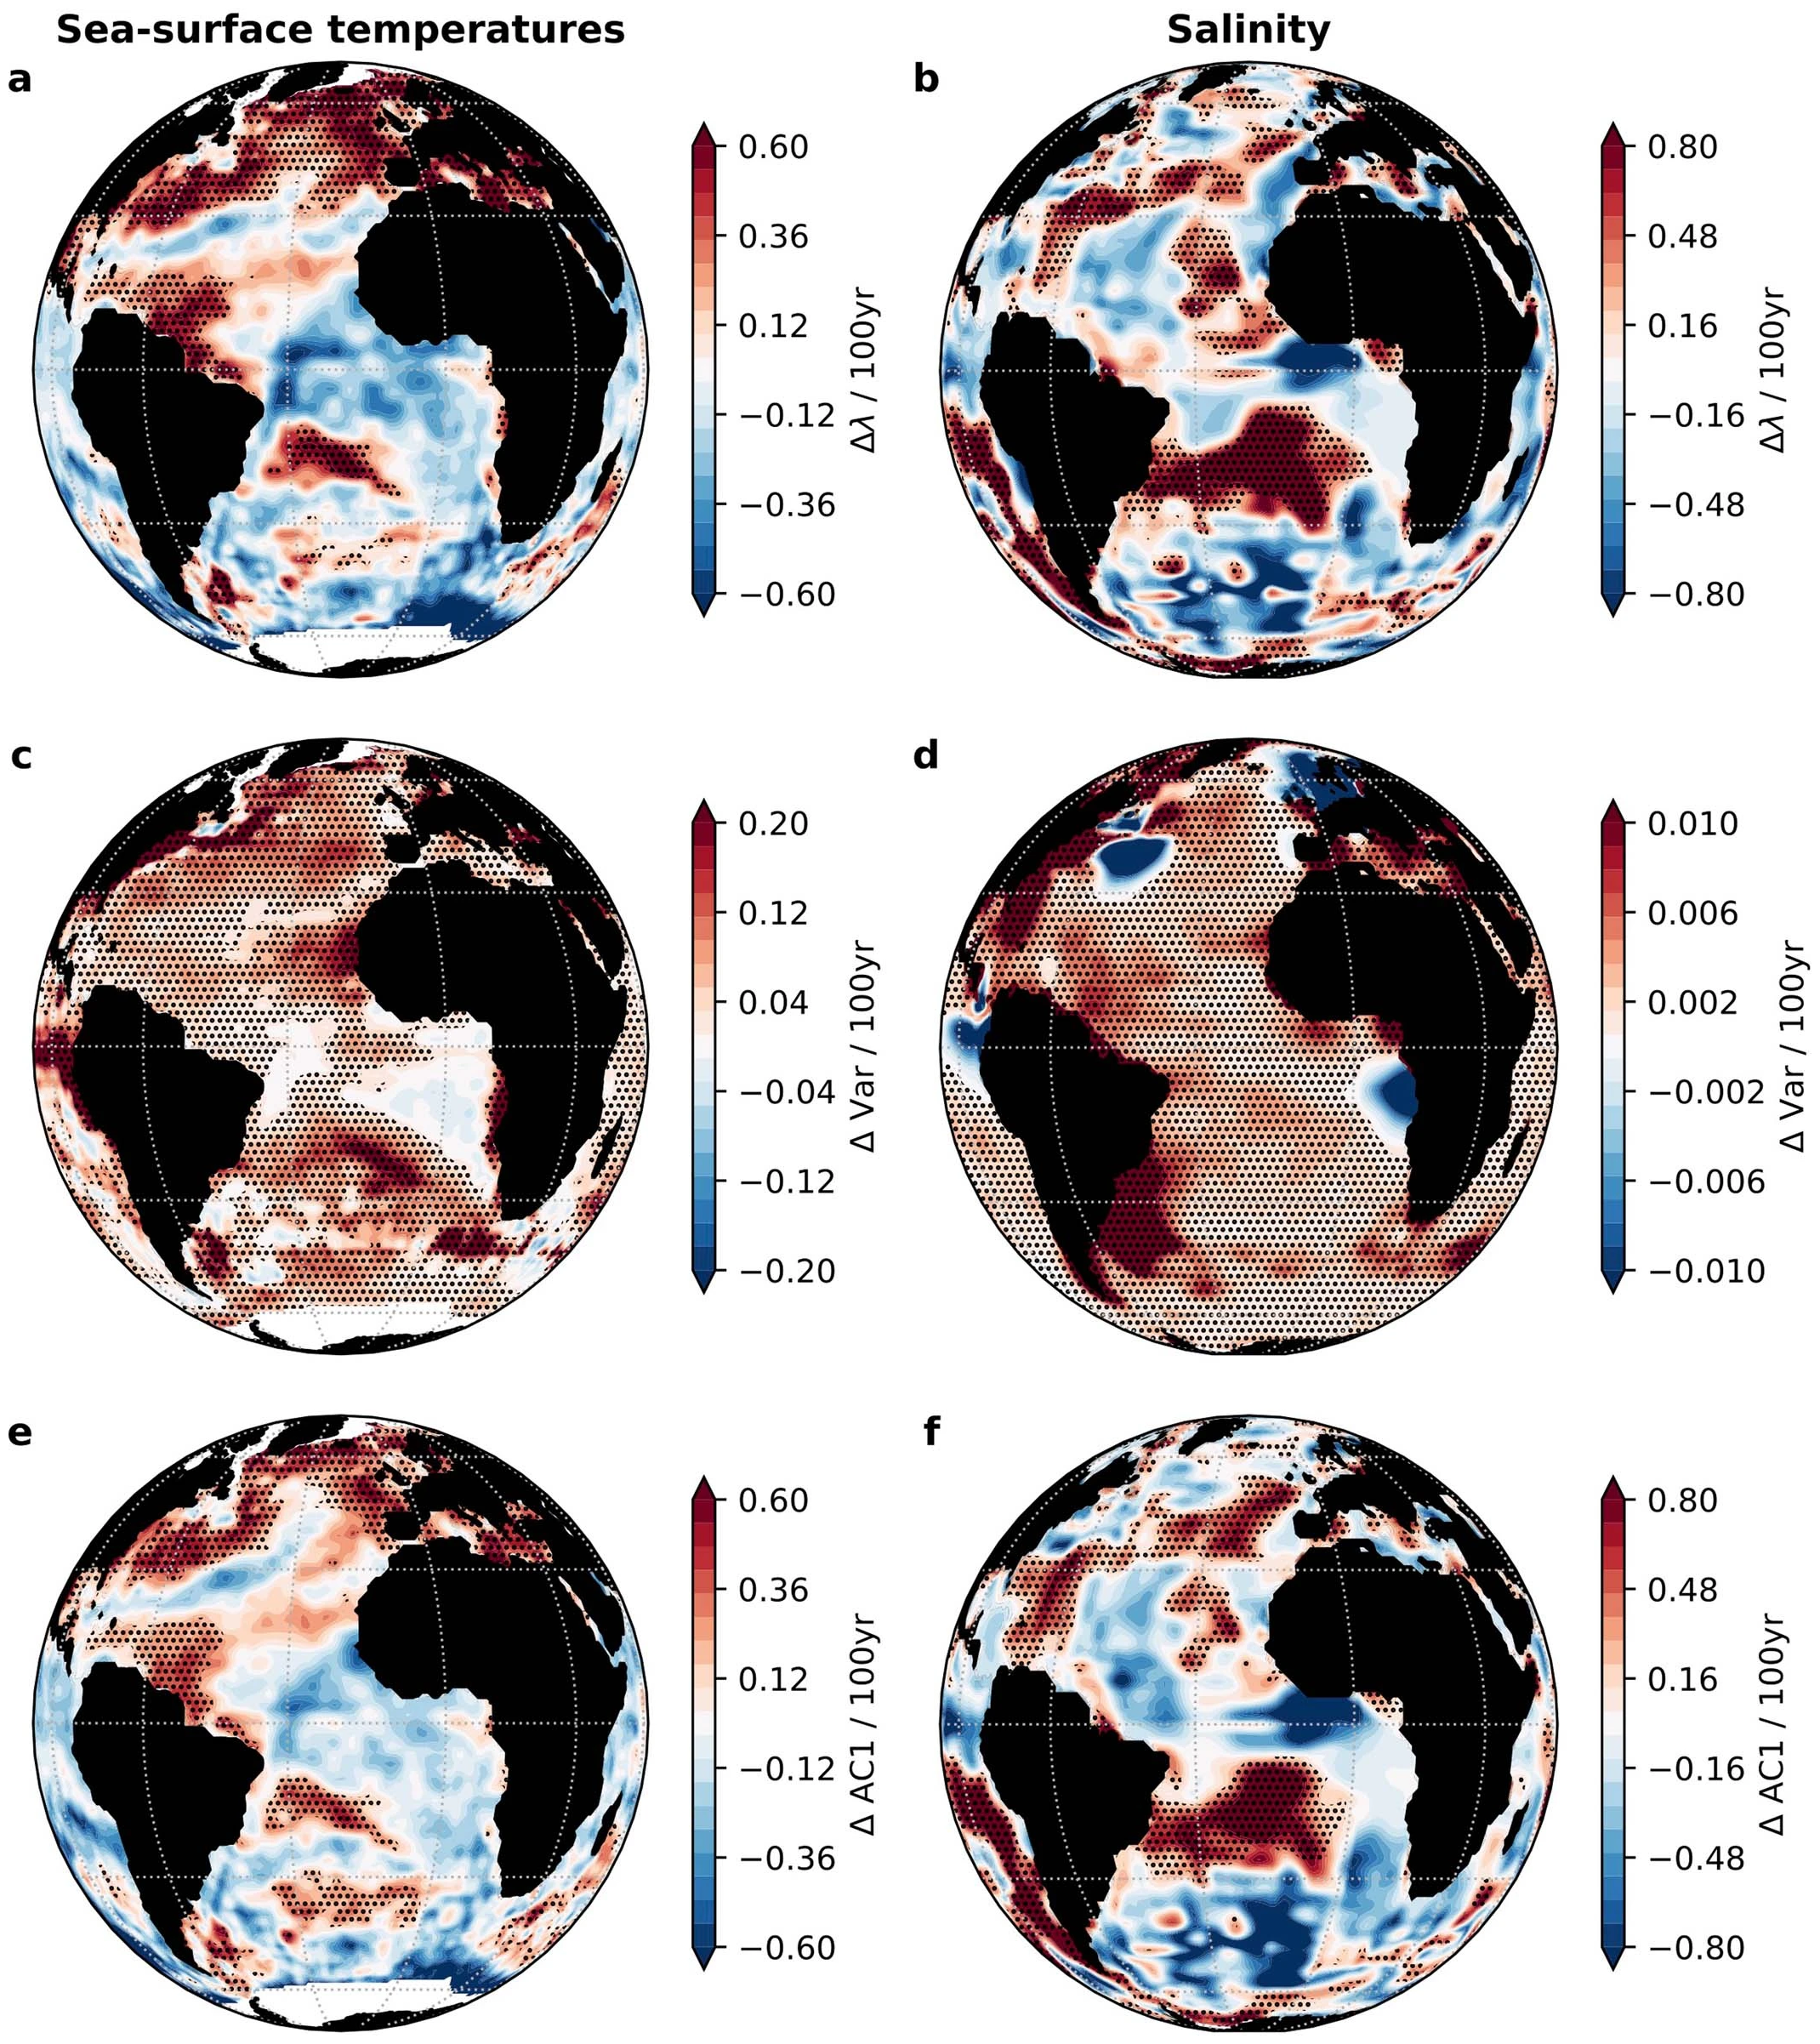
By Ben Turner 6 August 2021 (LiveScience) – One of the most crucial ocean current systems for regulating the Northern Hemisphere’s climate could be on the verge of total collapse due to climate change, a new study has revealed. The Atlantic Meridional Overturning Circulation (AMOC), which includes the Gulf Stream and is responsible for moderating […]