State of the Climate in 2018: 2018 was the fourth-hottest year on record, behind 2016, 2015, and 2017
12 August 2019 (NCEI) – A new State of the Climate report [pdf] confirmed that 2018 was the fourth warmest year in records dating to the mid-1800s.
Last year was the fourth warmest year on record despite La Niña conditions early in the year and the lack of a short-term warming El Niño influence until late in the year. The report found that the major indicators of climate change continued to reflect trends consistent with a warming planet. Several markers such as sea level and greenhouse gas concentrations in the atmosphere once again broke records set just one year prior.
These key findings and others are available from the State of the Climate in 2018 report released online today by the American Meteorological Society (AMS).
The 29th annual issuance of the report, led by NOAA National Centers for Environmental Information, is based on contributions from more than 470 scientists from nearly 60 countries around the world and reflects tens of thousands of measurements from multiple independent datasets (highlights, full report). It provides a detailed update on global climate indicators, notable weather events, and other data collected by environmental monitoring stations and instruments located on land, water, ice, and in space.
The report’s climate indicators show patterns, changes, and trends of the global climate system. Examples of these indicators include various types of greenhouse gases; temperatures throughout the atmosphere and ocean, and over land; cloud cover; sea level; ocean salinity; sea ice extent; and snow cover.
State of the Climate Report highlights
Report highlights include these indications of a warming planet:
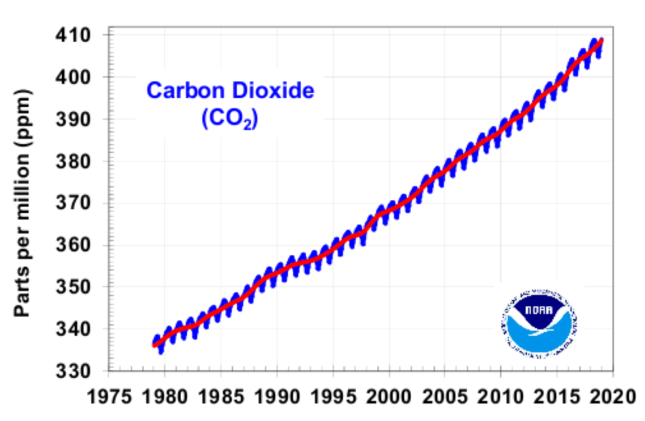
Greenhouse gases were highest on record. The major greenhouse gas concentrations, including carbon dioxide (CO2), methane, and nitrous oxide, rose to new record high values during 2018. The global annual average atmospheric CO2 concentration was 407.4 parts per million (ppm). This was 2.4 ppm greater than 2017 amounts and was the highest in the modern 60-year measurement record and in ice core records dating back as far as 800,000 years.
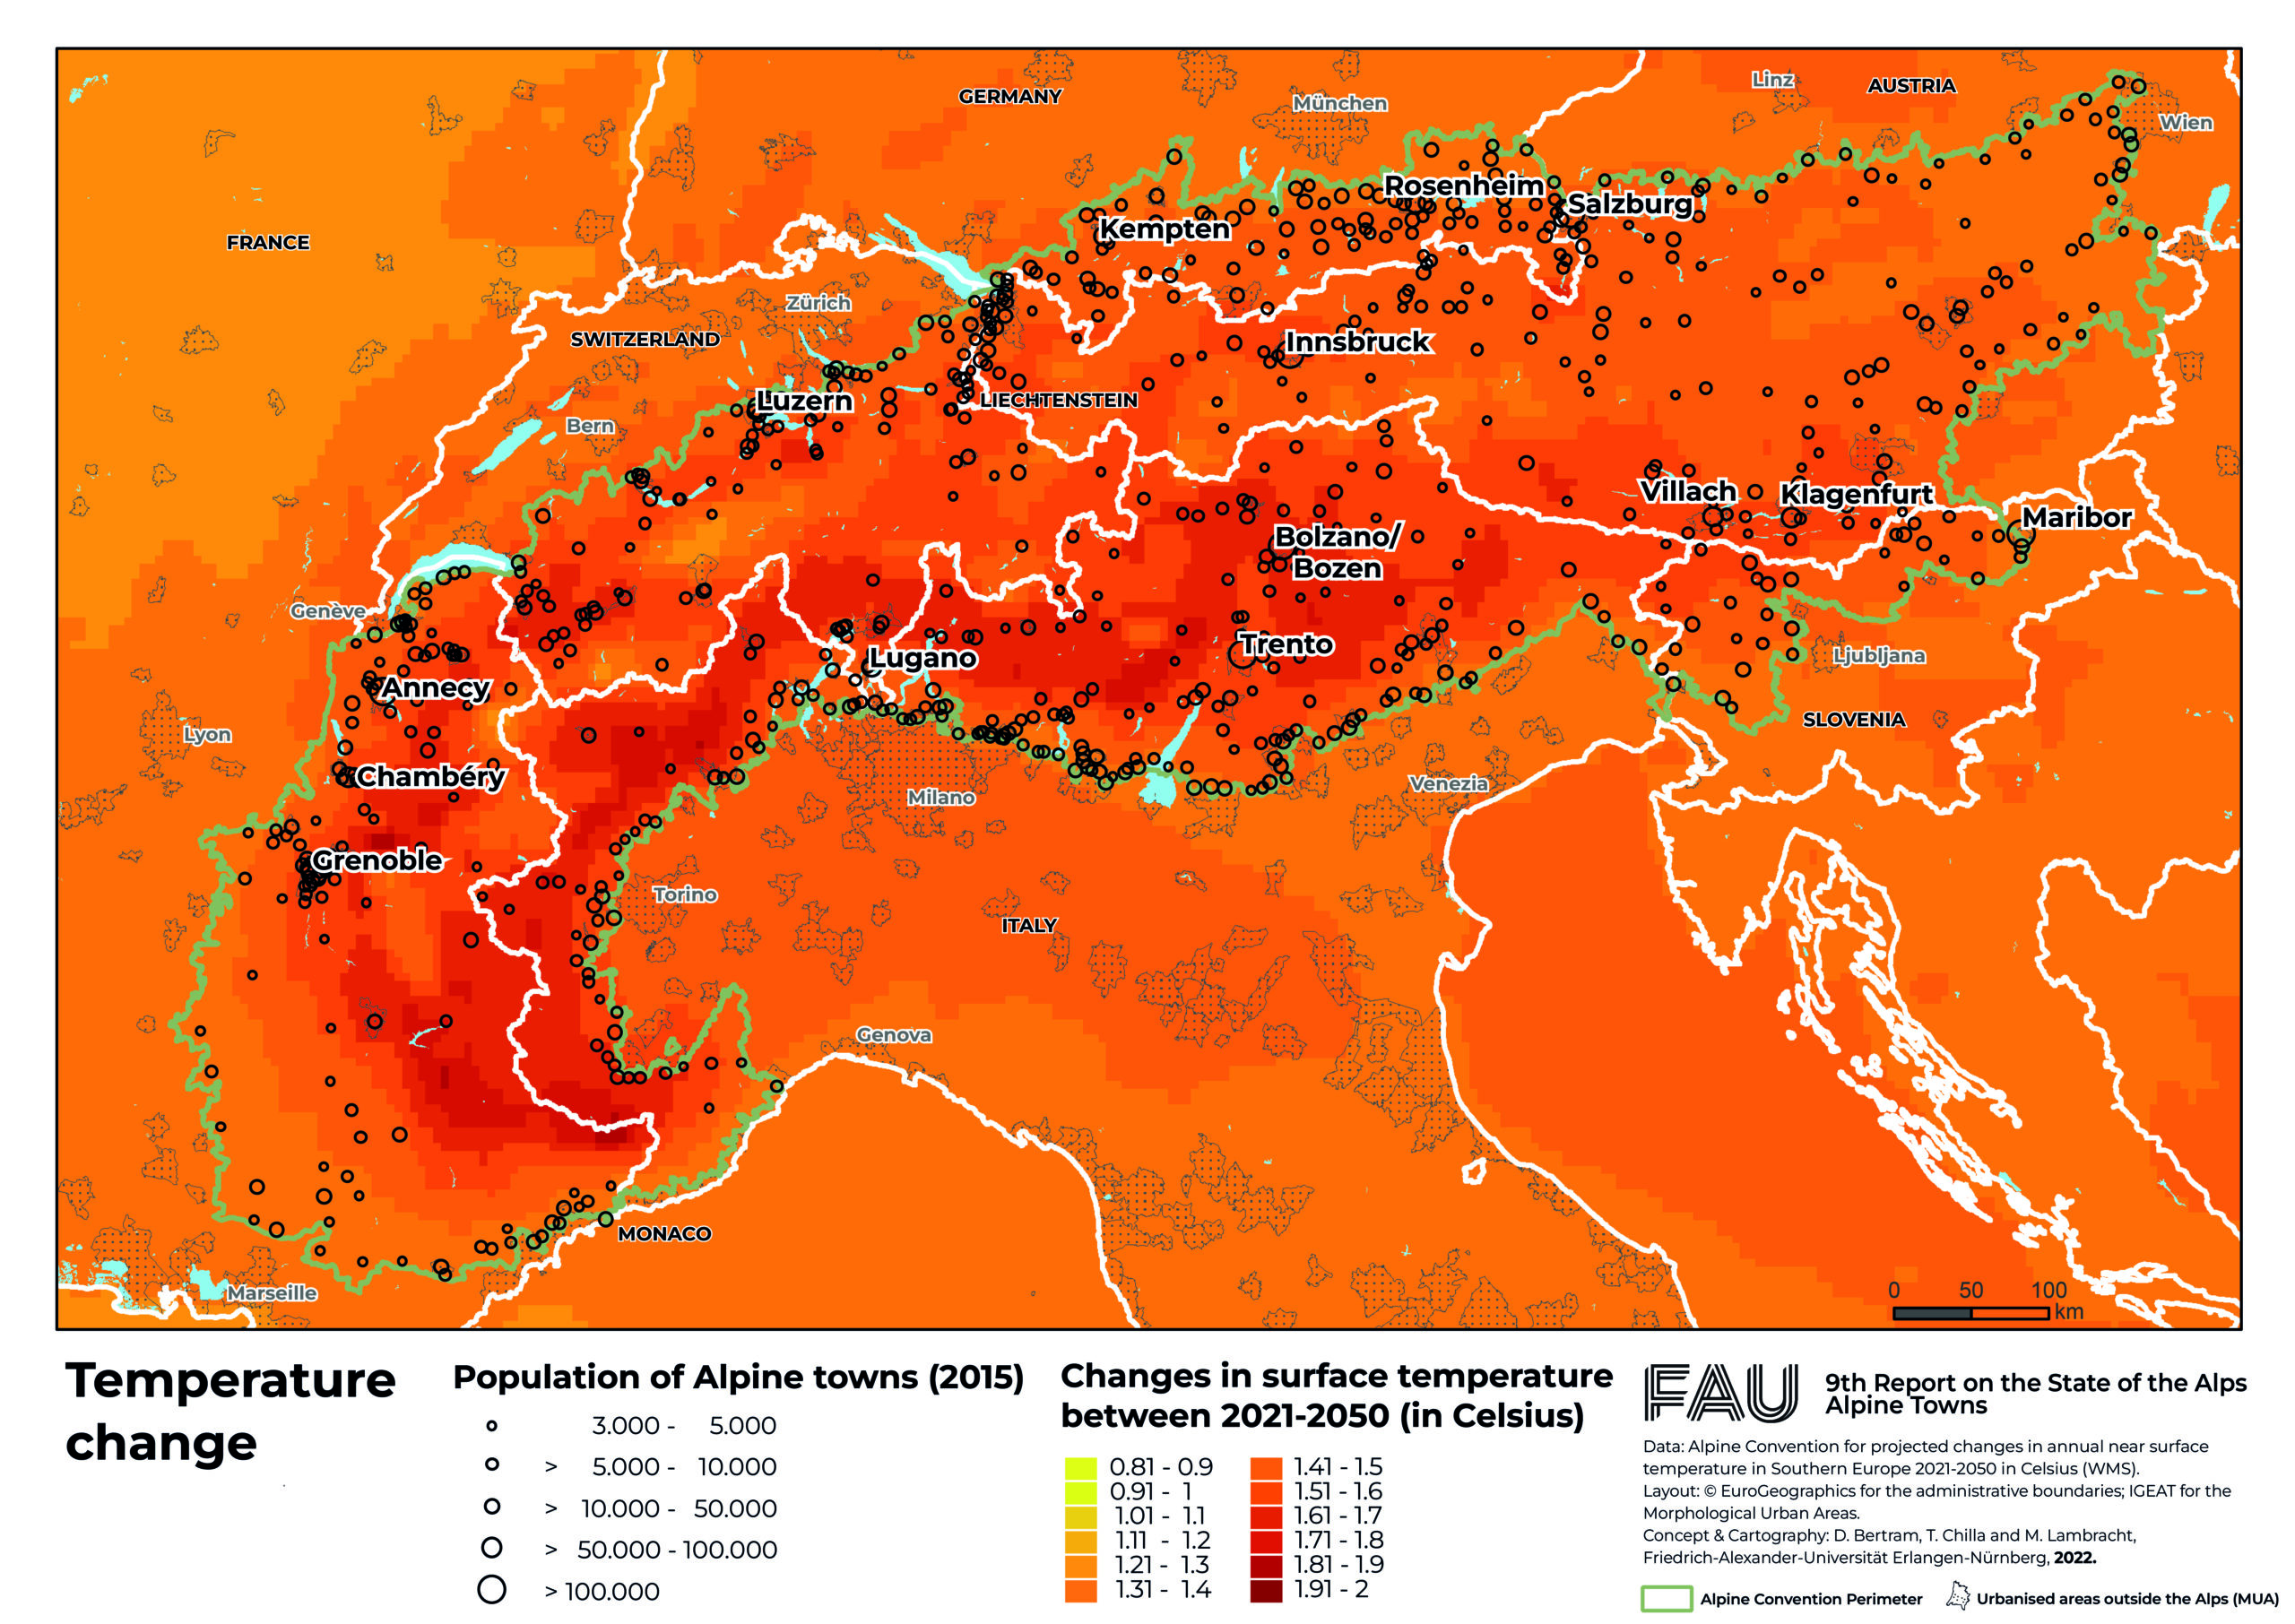
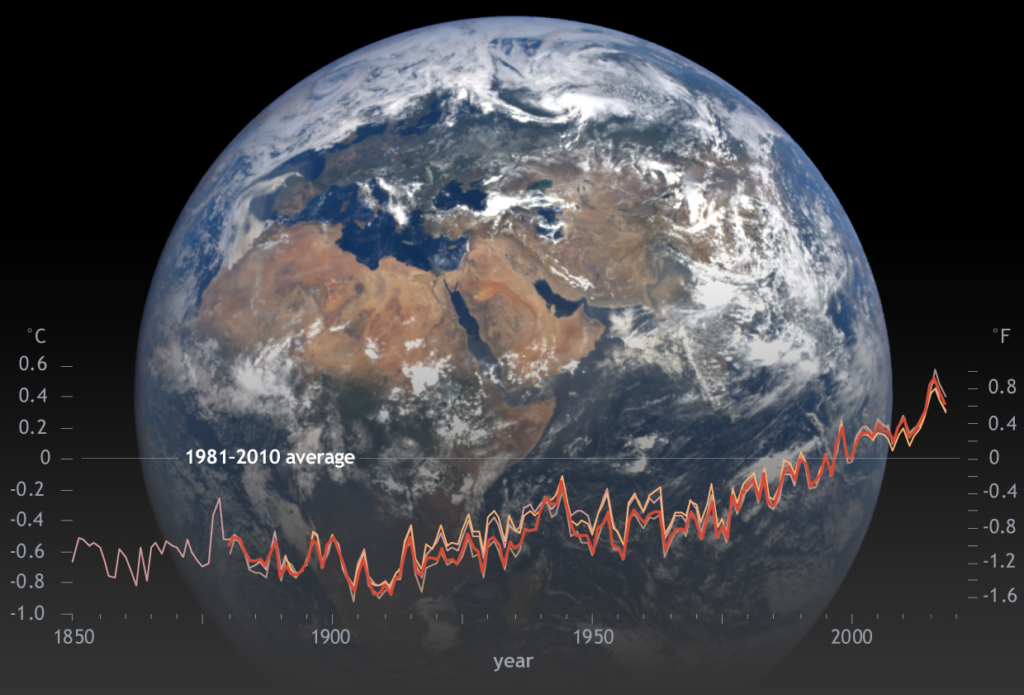
Global surface temperature was near-record high. The globally averaged surface temperature was 0.30°C to 0.40°C above the 1981–2010 average, depending upon the dataset used. This places 2018 as having the fourth warmest annual global temperature since records began in the mid- to late 1800s. The four warmest years on record have all occurred since 2015. There were also more high, and fewer low, temperature extremes than in nearly the entire 68-year extremes record.
Sea surface temperature was near-record high. The globally averaged sea surface temperature (SST) cooled slightly since the record El Niño year of 2016 but was still far above the 1981–2010 mean by 0.33° +/− 0.05°C in 2018. The deeper ocean continues to warm year after year.
![(a) Near-global (65°S–80°N, excluding continental shelves, the Indonesian seas, the Sea of Okhostk, the Caribbean Sea, and the Gulf of Mexico) integrals of monthly ocean temperature anomalies [°C; updated from Roemmich and Gilson (2009)] relative to record-length average monthly values, smoothed with a 5-month Hanning filter and contoured at odd 0.02°C intervals (see colorbar) vs. pressure and time. (b) Linear trend of temperature anomalies over time for the length of the record in (a) plotted vs. pressure in °C decade−1 (orange line), and trend with a Niño-3.4 regression removed (blue line) following Johnson and Birnbaum (2017). Graphic: AMS](https://desdemonadespair.net/wp-content/uploads/2019/08/Near-global-integrals-of-monthly-ocean-temperature-anomalies-AMS-970x1024.png)
Global lower tropospheric temperature was well above average. In the region of the atmosphere just above Earth’s surface, the globally averaged lower troposphere temperature was approximately third to seventh highest on record, depending on the dataset used.
The hydrological cycle over the ocean is increasing. Sea surface salinity patterns reinforce recent evidence that dry regions are becoming drier and saltier, and wet regions rainier and fresher. The top 2,000 feet (600 meters) of the Atlantic has steadily become saltier since 2005.
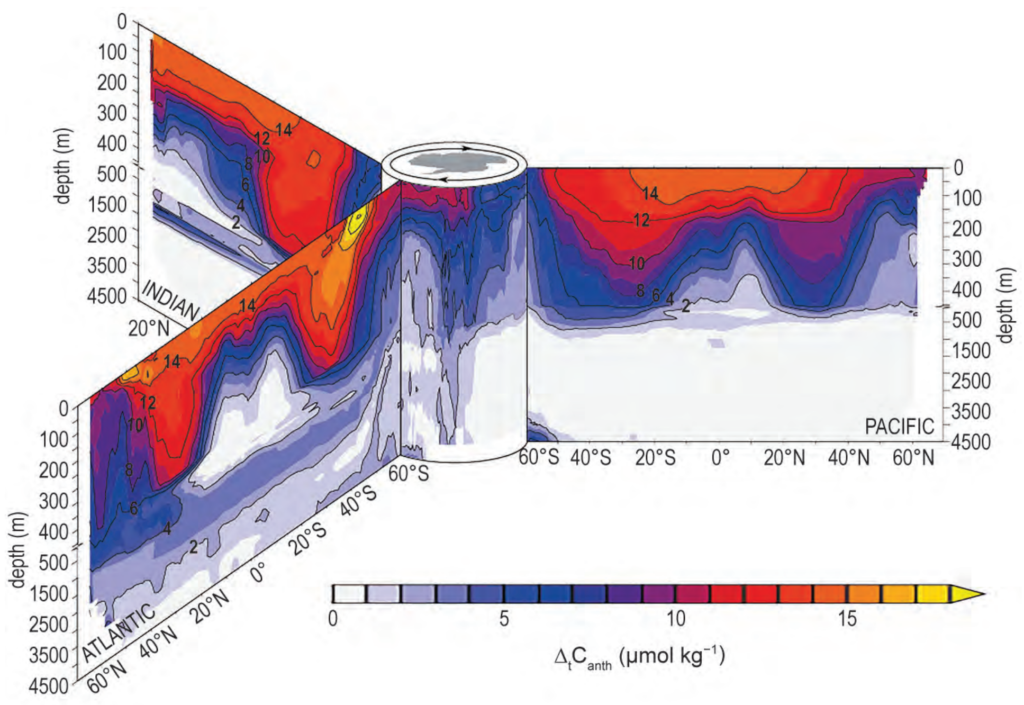
Global upper ocean heat content was record high. Globally, upper ocean heat content reached record highs in 2018, despite sea surface temperature cooling slightly since 2016, according to five of the six datasets analyzed. This record heat reflects the continuing accumulation of thermal energy in the top 2,300 feet (700 meters) of the ocean. Oceans absorb more than 90% of Earth’s excess heat from global warming.
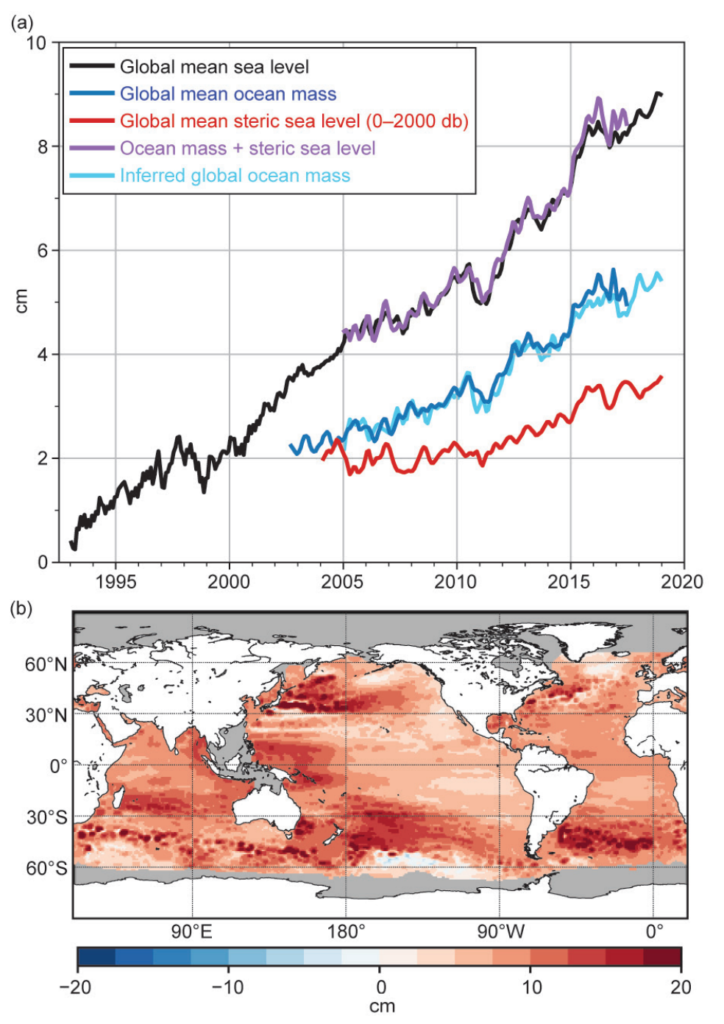
Global sea level was highest on record. For the seventh consecutive year, global average sea level rose to a new record high in 2018 and was about 3.2 inches (8.1 cm) higher than the 1993 average, the year that marks the beginning of the satellite altimeter record. Global sea level is rising at an average rate of 1.2 inches (3.1 cm) per decade.
The report also documents key regional climate and climate-related events.
Global fire activity was lowest on record. Globally, the levels of fire activity during 2018 were the lowest since the start of the record in 1997, with a combined burned area of about 1.2 billion acres (500 million hectares). The low fire year is consistent with the long-term downward trend in fire emissions, which has been driven primarily by the conversion of frequently burning savannas to agricultural areas. Regionally, South America and the Northern Hemisphere of Africa each experienced their lowest annual fire activities, while North America and Australia had fire emissions that were higher than normal.
The Arctic continued to warm; maximum sea ice extent was near-record low. The annual mean surface air temperature for the Arctic was the third highest since 1900, trailing only 2016 and 2017, at 2.2°F (1.2°C) above the 1981–2010 average. Sea ice extent continued to see low levels. On March 17, 2018, the 2018 maximum extent of Arctic sea ice measured by satellite was the second lowest in the 38-year period of record, behind only 2017. First-year ice now dominates the ice cover and composed ~77% of the March 2018 ice pack compared to about 55% during the 1980s. Because thinner, younger ice is more vulnerable to melting out in summer, this shift in sea ice age has contributed to the decreasing trend in minimum ice extent. The September 2018 sea ice minimum tied as the sixth lowest on record. Sea ice extent in September across the Arctic Ocean is now declining at a rate of −12.8% per decade. Over land, Arctic snow cover extent during June was almost half of what it was 35 years ago, a loss rate close to the decline of the September sea ice extent.
Antarctic was warmer than average and sees near-record low sea ice extent. In the Antarctic, 2018 was warmer than average for the continent as a whole. On the highest points of the Antarctic Plateau, the automatic weather station, named Relay, broke or tied six monthly high temperature records throughout the year, with the August record broken by nearly 14°F (8°C). Summer sea ice extent was the second lowest on record and was below the 1981–2010 average since mid-September 2016. Throughout 2018, 28 days of record low daily sea ice extent were observed, including 17 in December alone. The monthly mean sea ice area for December (2.1 million square miles; 5.5 million square km) was the lowest for that month in the 41-year satellite record.
Tropical cyclones were well above average overall. There were 95 named tropical cyclones across all ocean basins in 2018, well above the 1981–2010 average of 82. Eleven tropical cyclones reached the Saffir–Simpson scale Category 5 intensity level. This was only one less than the record of 12 Category 5 tropical cyclones in 1997.
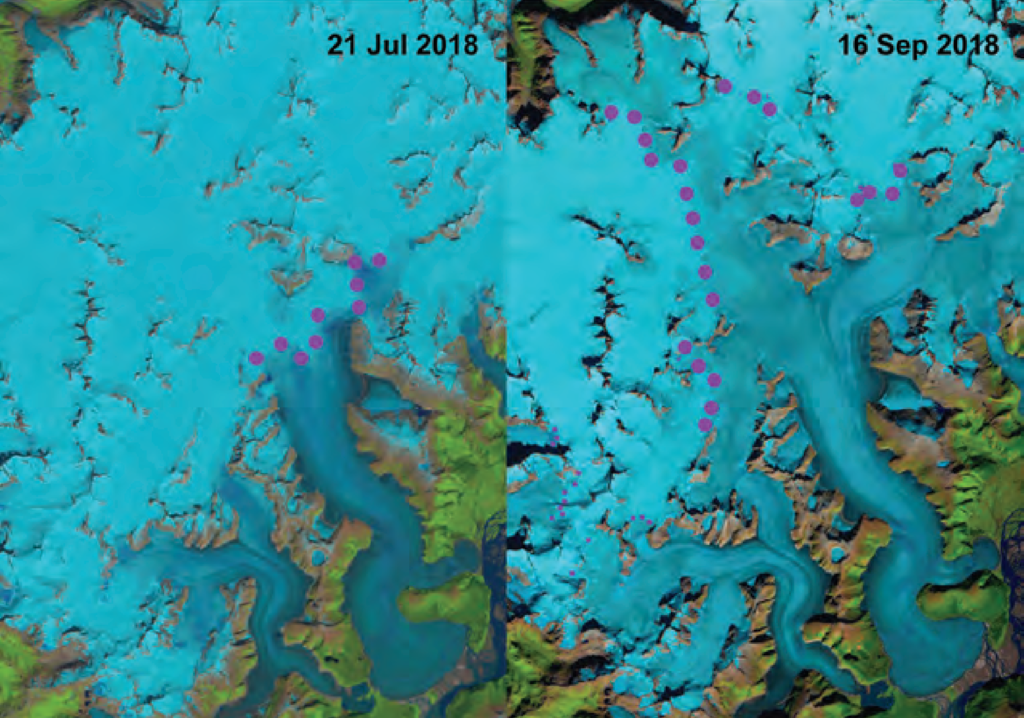
Glaciers melted around the world. Preliminary data indicate that the world’s most closely tracked glaciers lost mass for the 30th consecutive year. Since 1980, the cumulative loss is the equivalent of slicing 79 feet (24 meters) off the top of the average glacier. [more]