Media coverage creates false balance on climate science, study shows – “Climate change contrarians” receive 49 percent more media coverage than scientists
By Lorena Anderson
13 August 2019
(UC Merced) – The American media lends too much weight to people who dismiss climate change, giving them legitimacy they haven’t earned, posing serious danger to efforts aimed at raising public awareness and motivating rapid action, a new study shows.
While it is not uncommon for media outlets to interview climate change scientists and climate change deniers in the same interviews, the effort to offer a 360-degree view is creating a false balance between trained climate scientists and those who lack scientific training, such as politicians.
“It’s not just false balance; the numbers show that the media are ‘balancing’ experts — who represent the overwhelming majority of reputable scientists — with the views of a relative handful of non-experts,” UC Merced Professor LeRoy Westerling said. “Most of the contrarians are not scientists, and the ones who are have very thin credentials. They are not in the same league with top scientists. They aren’t even in the league of the average career climate scientist.”
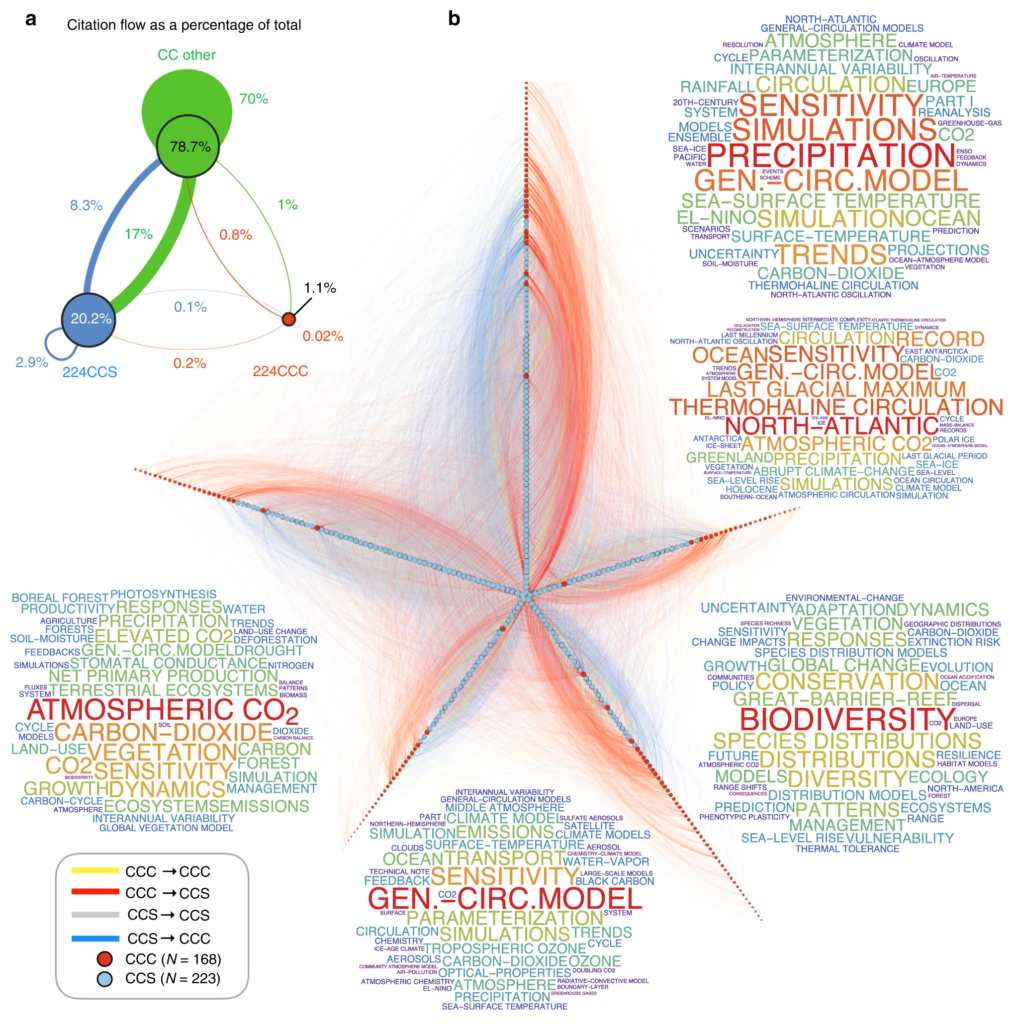
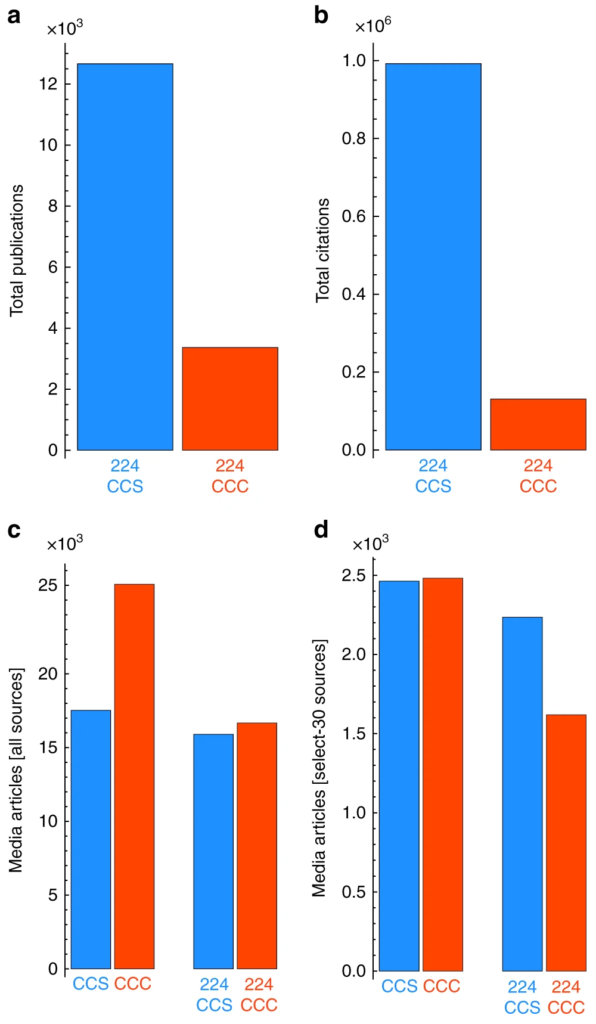
Westerling is one of three researchers from UC Merced who tracked the digital footprints of climate scientists and deniers across about 200,000 research publications and 100,000 digital and print media articles on climate change over the past few years. Their work is published in Nature Communications today .
Data shows that about half the mainstream media visibility goes to climate-change deniers, many of whom are not climate scientists. This proportion increases significantly when blogs and other “new media” outlets are included — pointing to the rising role of customized media in spreading disinformation.
“It’s time to stop giving these people visibility, which can be easily spun into false authority,” Professor Alex Petersen said. “By tracking the digital traces of specific individuals in vast troves of publicly available media data, we developed methods to hold people and media outlets accountable for their roles in the climate-change-denialism movement, which has given rise to climate change misinformation at scale.”
Amplified Misinformation
There are a variety of reasons people don’t accept the results of climate science even though the science is overwhelming. These include cognitive bias and “motivated reasoning” — the tendency of people to bias their judgements by personal and group-level values, even when faced with documented facts; and external influences, including political cues, ideological biases, cultural worldviews and even personal weather experiences.
But the media’s longstanding and dominant role in empowering cultural politics, the advent of “new media” and the nearly boundless scalability of content distribution across the Internet compound the problem and amplify misinformation, the researchers said.
Even when people have complete control in choosing their sources of information, they are still susceptible to significant disparities in content production and to media coverage.
Political reporting focuses its narrative around conflict and looks to highlight competing voices, rather than telling the story of the science.
UC Merced Professor LeRoy Westerling
The proper counterpoint to a climate scientist would be another legitimate scientist who could show competing data from the same experiments or show where the first climate scientist has made mistakes in his or her work. Having a non-expert oil lobbyist or politician respond to a peer-reviewed study or assessment by saying “climate change doesn’t exist” is not a credible argument or a means of balancing, Petersen said.
“These results show that false balance in the media is alive and well and the growing trend toward customized media that we access via the internet is feeding the disinformation trend,” said Katharine Hayhoe, a climate scientist at Texas Tech University and a lead author of the U.S. National Climate Assessment. “This study is a wake-up call for all media to do better: to check their sources in order to accurately communicate the reality of human-induced climate change, the relevance of its impacts and the urgency of action.”
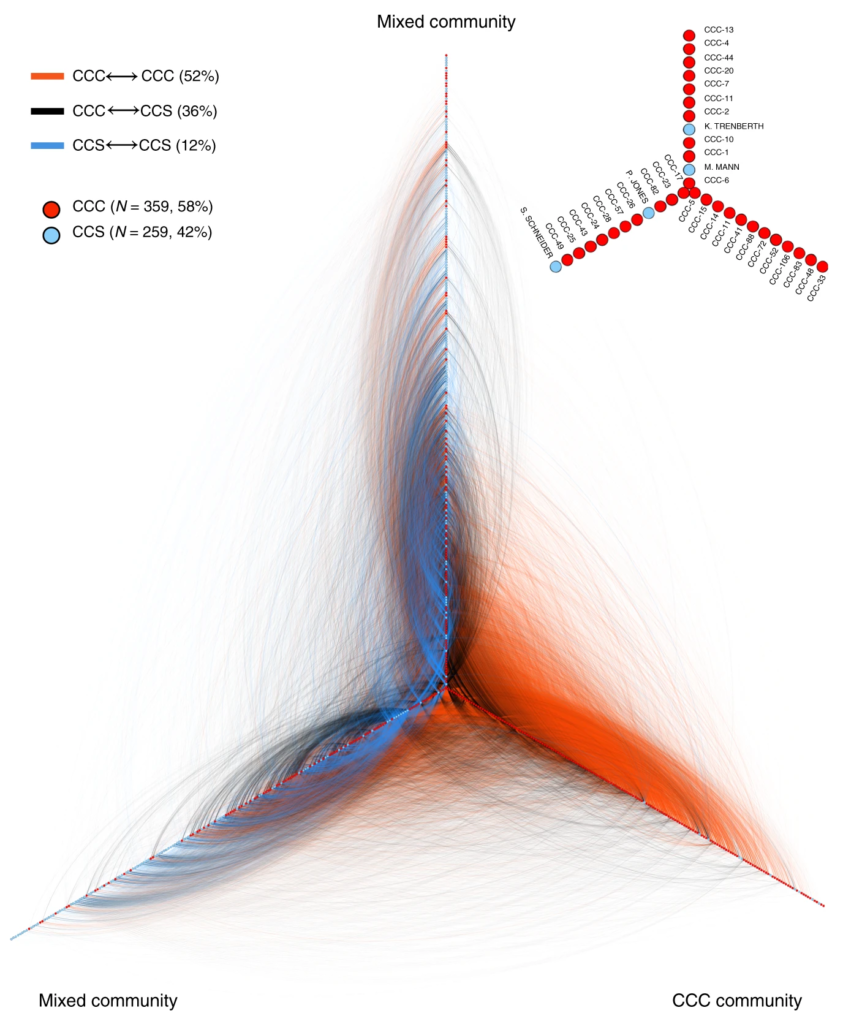
Petersen is a computational scientist who specializes in human analytics. He and Westerling, a climatologist known for his state-of-the-art modeling of climate-ecosystem-wildfire interactions, both with the Department of Management of Complex Systems in the School of Engineering, partnered with former UC Merced researcher Emmanuel Vincent to conduct a study of 386 prominent climate contrarians and 386 expert scientists’ public statements on climate change to compare the credibility given to those on each side.
“The acute misrepresentation of information aimed at misleading the public for political gain is a pressing problem that threatens various other domains in addition to climate change communication,” the team wrote in the new paper. “It requires a better understanding of the human, social and technological factors that facilitate widespread disinformation efforts.”
Disproportionate Visibility
Westerling put it more bluntly:
“It’s well known now that a well-financed propaganda campaign on behalf of conservative fossil fuel interests led mainstream media to frame reporting on climate change science as political reporting rather than science reporting,” he said. “Political reporting focuses its narrative around conflict and looks to highlight competing voices, rather than telling the story of the science.”
This, he said, has led to the false balance between scientists and a handful of climate deniers who have become regular commenters.
Besides the scientists who have published work denying or downplaying climate change, many people will recognize some of the other people who are often called upon to present “balance:” Scott Pruitt, the former head of the EPA; Steve Bannon, former advisor to President Donald Trump’s campaign; Oklahoma Sen. James Inhofe; White House Chief of Staff Mick Mulvaney; former Secretary of State Rex Tillerson.
By featuring them as the counterpoints to legitimate, experienced and disciplined climate scientists, the media gives them a measure of credibility they do not deserve, the researchers said.
“Such disproportionate media visibility of contrarian arguments and actors not only misrepresents the distribution of expert-based beliefs, it also manifestly undermines the credible authority of career climate-change experts, and reinforces the trend of non-experts presiding over public scientific discourse, which all together hinders prospects for rapid public action on climate change,” they wrote.
Contact
Lorena Anderson, Senior Writer and Public Information Representative, Office: (209) 228-4406, Mobile: (209) 201-6255, landerson4@ucmerced.edu
Media Creates False Balance on Climate Science, Study Shows
Discrepancy in scientific authority and media visibility of climate change scientists and contrarians
ABSTRACT: We juxtapose 386 prominent contrarians with 386 expert scientists by tracking their digital footprints across ∼200,000 research publications and ∼100,000 English-language digital and print media articles on climate change. Projecting these individuals across the same backdrop facilitates quantifying disparities in media visibility and scientific authority, and identifying organization patterns within their association networks. Here we show via direct comparison that contrarians are featured in 49% more media articles than scientists. Yet when comparing visibility in mainstream media sources only, we observe just a 1% excess visibility, which objectively demonstrates the crowding out of professional mainstream sources by the proliferation of new media sources, many of which contribute to the production and consumption of climate change disinformation at scale. These results demonstrate why climate scientists should increasingly exert their authority in scientific and public discourse, and why professional journalists and editors should adjust the disproportionate attention given to contrarians.