September 10, 2015
Status of polar bear populations for 2014
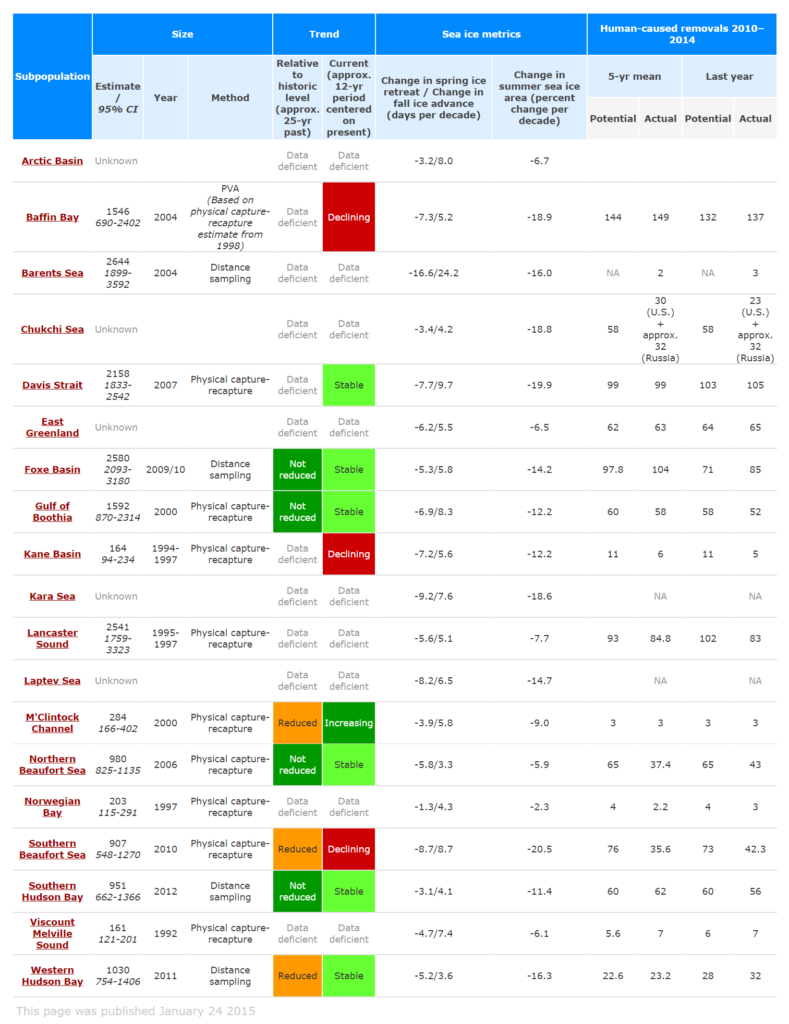
24 January 2015 (Polar Bear Specialist Group) – The present table was discussed during late fall and early winter 2014, and agreed upon by the group on 20 January 2015. This status table will be updated whenever there is new information available that is considered credible and valid by the group. This year’s status table includes two new columns with metrics for sea ice change:
- Change in date of spring sea ice retreat and change in date of fall sea ice advance (days per decade) over the period 1979-2014. Each year the area of sea ice reaches a maximum in March and a minimum in September. In order to measure the timing of the seasonal change in sea ice, we find the date each spring when the area of sea ice has dropped to a specific threshold and the date each fall when the area has grown back to that same threshold. The region-specific threshold is halfway (50%) between the mean March sea-ice area and the mean September sea-ice area over the period 1979-1988 for each subpopulation region.
- Change in summer sea ice area (percent change/decade, June 1 – October 31) relative to the average summer sea ice area during 1979-1988. Sea ice area was calculated as the sum, over all grid cells with >15% sea ice concentration, of the grid cell area multiplied by the grid cell sea ice concentration.
Click the subpopulation hyperlink and more information will appear. Download the status table (PDF 98.7 kB)