Map showing surface temperatures in Southeast Asia on 6 May 2023. Laos and Vietnam both experienced record-breaking temperatures. Graphic: MetDesk

Extreme heat smashes records in Asia in “one of the most brutal heat events the world has ever witnessed” – Laos, Thailand, Cambodia, and Vietnam all experience temperature spikes, in some places topping 43°C (110°F)

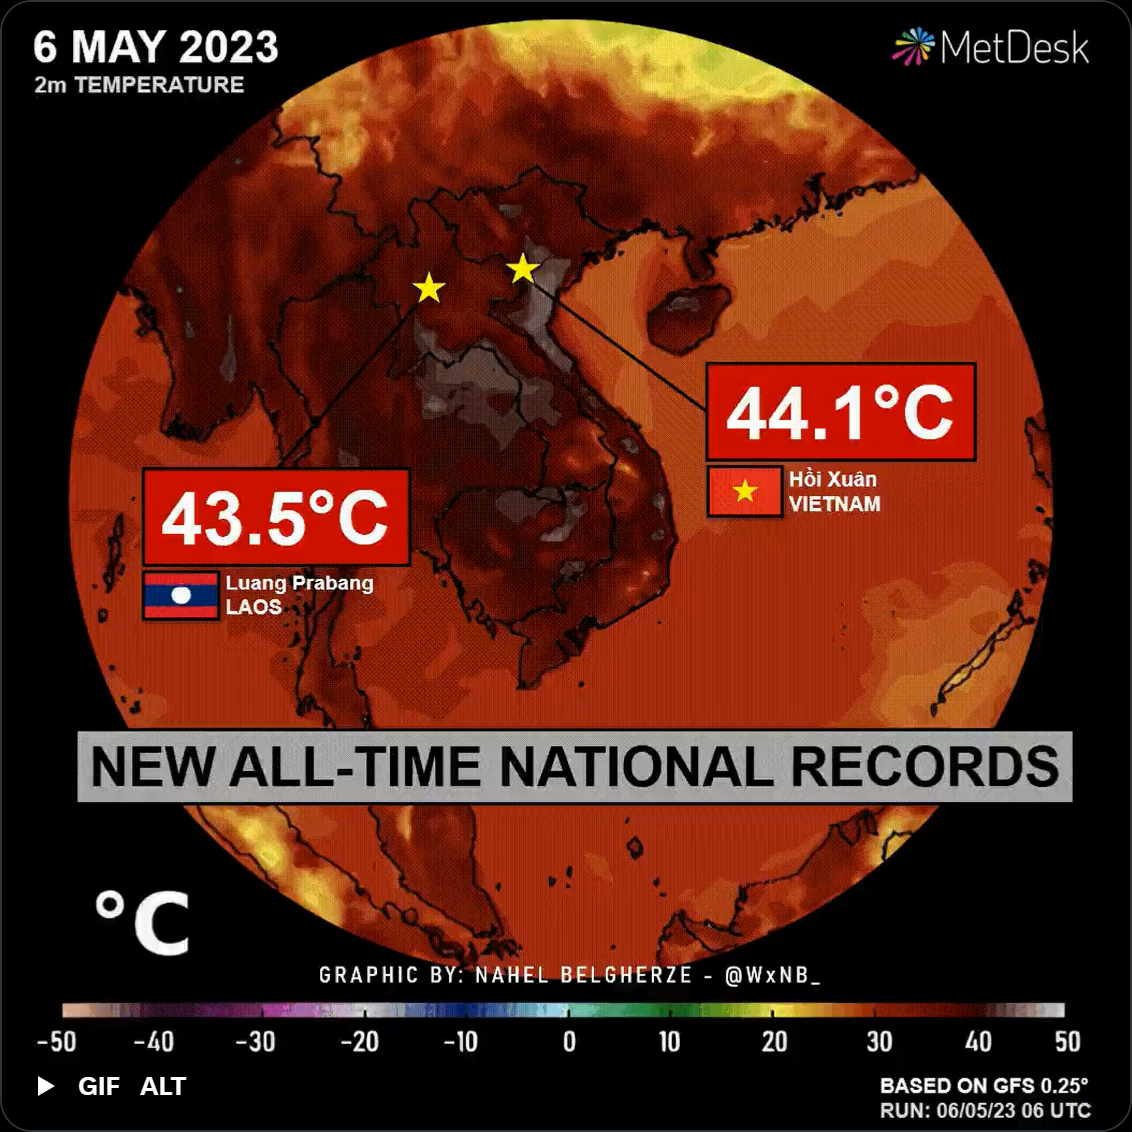
By Matthew Cappucci 8 May 2023 (The Washington Post) – A historic heat wave is bringing largely unprecedented temperatures to Southeast Asia, delivering a dangerous heat stress that could pose grave threats to vulnerable populations and smashing all-time records. Both Vietnam and Laos have recorded their hottest temperatures ever observed, in some places topping 110 […]

Map of air pollution in Thailand on 30 April 2023. Graphic: PlumeLabs

Thailand air pollution leads millions to seek medical help – “Today is so smoggy. I cough so much.”

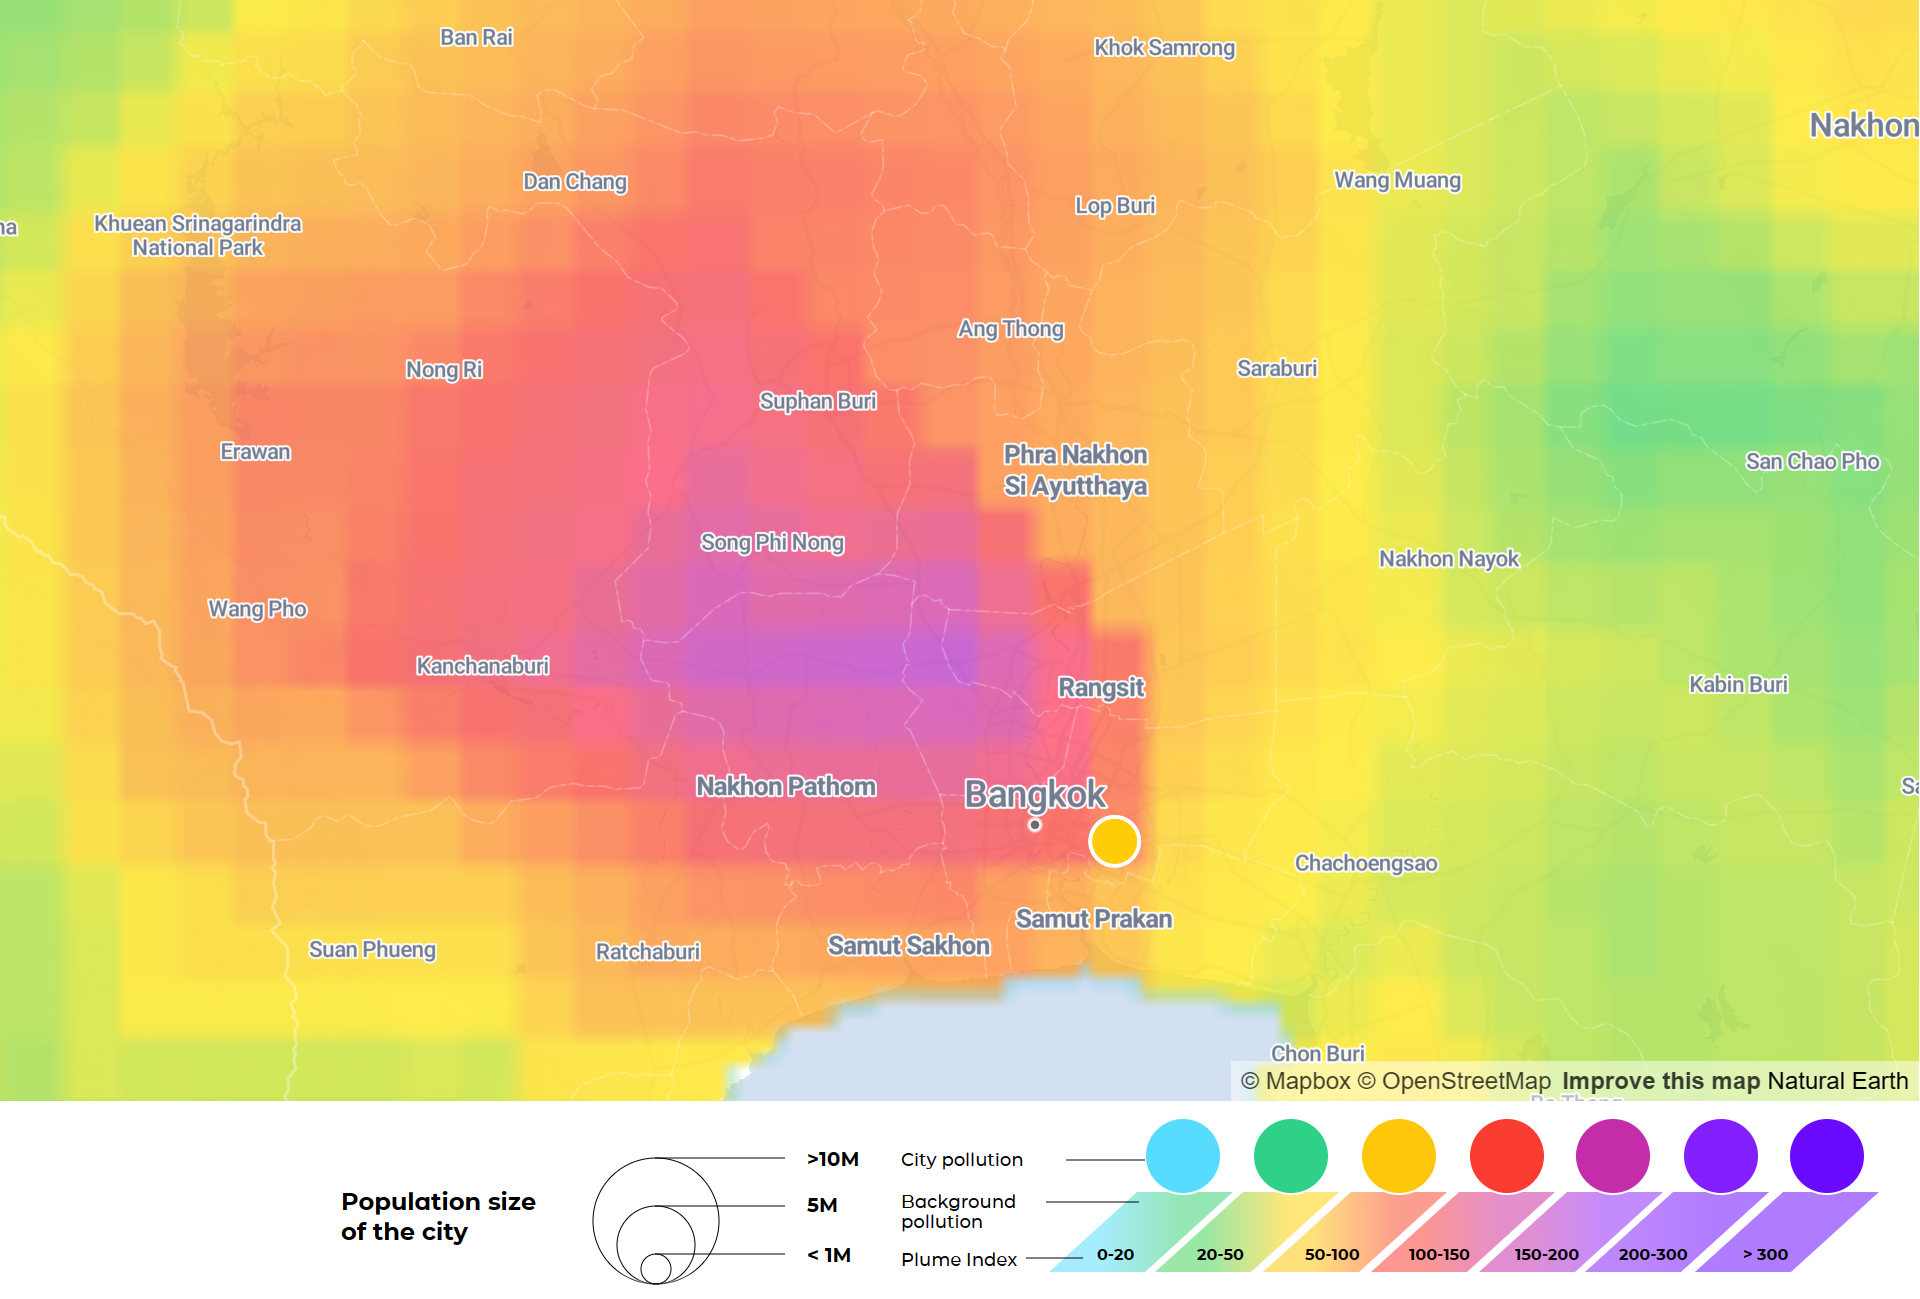
Bangkok, 20 April 2023 (AFP) – About 2.4 million people in Thailand have sought hospital treatment for medical problems linked to air pollution since the start of the year, health officials said, as toxic smog chokes parts of the country. Bangkok and the northern city of Chiang Mai were among the most polluted cities in […]

Gail Zawacki at the Occupy Wall Street protest in New York City, 23 September 2011. She carries a sign that reads, “Industrial civilization is murdering our Earth”. Photo: Gail Zawacki

The Diva of Doom: Remembering the late, great Gail Zawacki – “In the end, what matters more than time?”

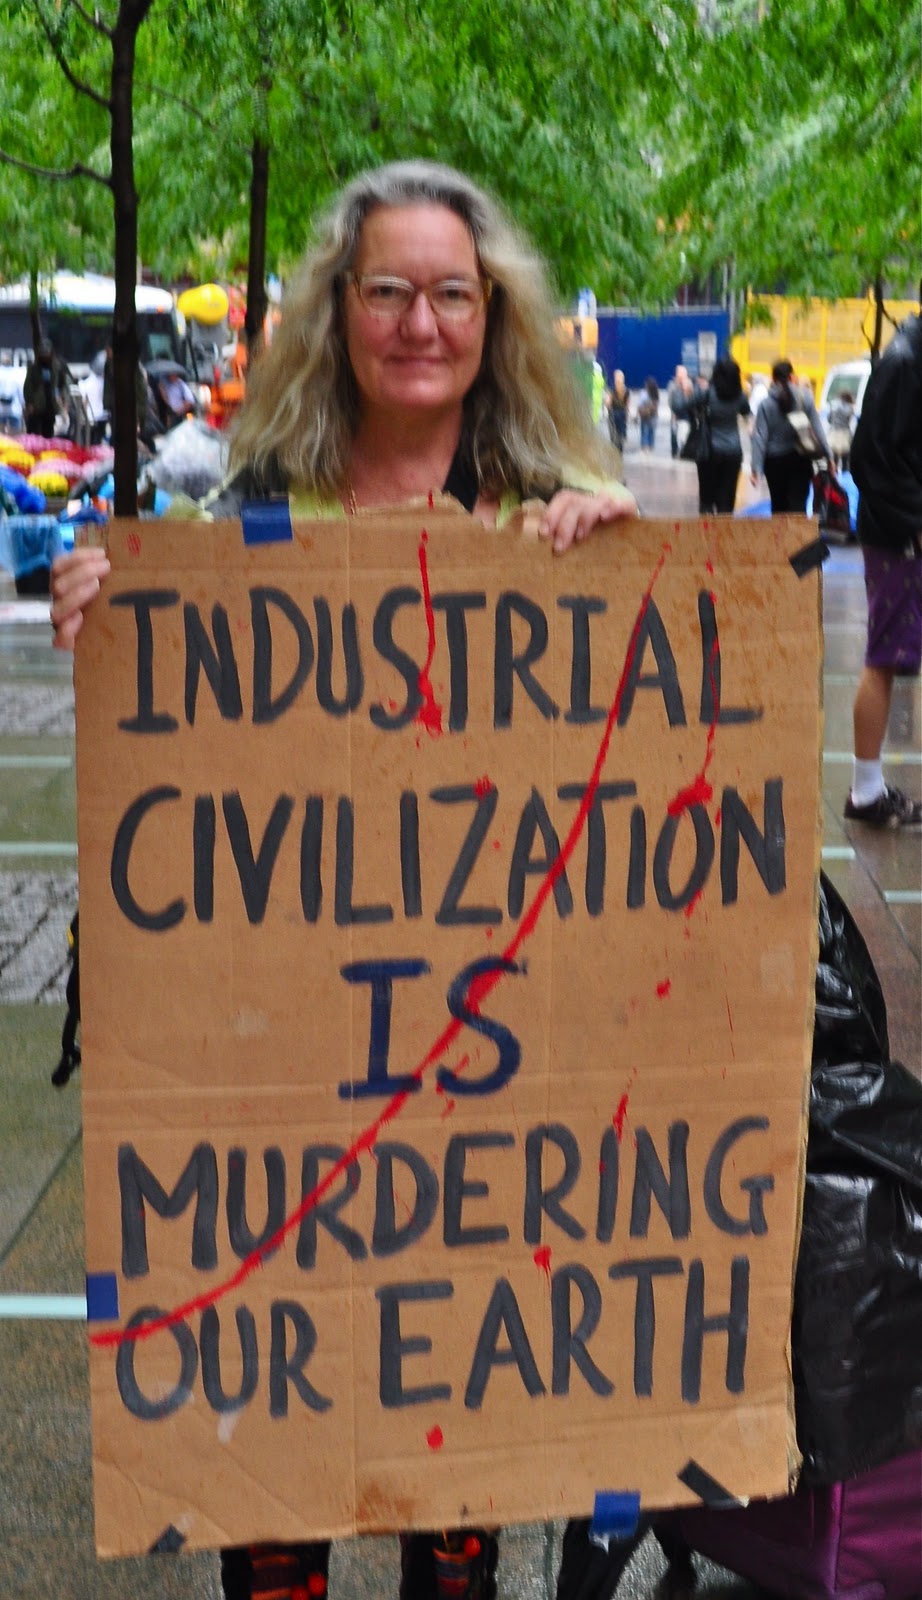
By James Galasyn 18 June 2022 (Desdemona Despair) – I was greatly saddened this week to read an email from climate activist Richard Pauli informing me that Gail Zawacki, the “Diva of Doom”, passed away on 9 June 2022. The community of environmental activists has lost one of its most eloquent and entertaining voices. She […]

Global map showing the highest marine heatwave (MHW) category experienced at each pixel in 2021 (reference period 1982–2011). Light grey indicates that no MHW occurred in a pixel over the entire year. (b) Stacked bar plot showing the percentage of the surface of the ocean experiencing an MHW on any given day of the year. (c) Stacked bar plot showing the cumulative percentage of the surface of the ocean that experienced an MHW over the year. Note: These values are based on when in the year a pixel first experienced its highest MHW category, so no pixel is counted twice. Horizontal lines in this figure show the final percentages for each category of MHW. (d) Stacked bar plot showing the cumulative number of MHW days averaged over the surface of the ocean. Note: This average is calculated by dividing the cumulative sum of MHW days per pixel weighted by the surface area of those pixels. Data: National Oceanic and Atmospheric Administration Optimum Interpolation Sea Surface Temperature (NOAA OISST). Graphic: Robert Schlegel

WMO: Four key climate change indicators broke records in 2021 – Past seven years have been the warmest seven years on record – “A dismal litany of humanity’s failure to tackle climate disruption”

GENEVA, 18 May 2022 (WMO) – Four key climate change indicators – greenhouse gas concentrations, sea level rise, ocean heat and ocean acidification – set new records in 2021. This is yet another clear sign that human activities are causing planetary scale changes on land, in the ocean, and in the atmosphere, with harmful and […]

Sateliite data showing the 2021 Antarctic ozone hole, which reached its maximum area on 7 October 2021 and ranked as the 13th-largest such feature since 1979. This view, from a NASA video, shows its current extent based on satellite data. Data: Paul Newman and Eric Nash / NASA / Ozone Watch. Graphic: Joshua Stevens

Video: Larger-than-average ozone hole over Antarctica in 2021 – Ozone layer recovery slower than anticipated, will be no earlier than 2070

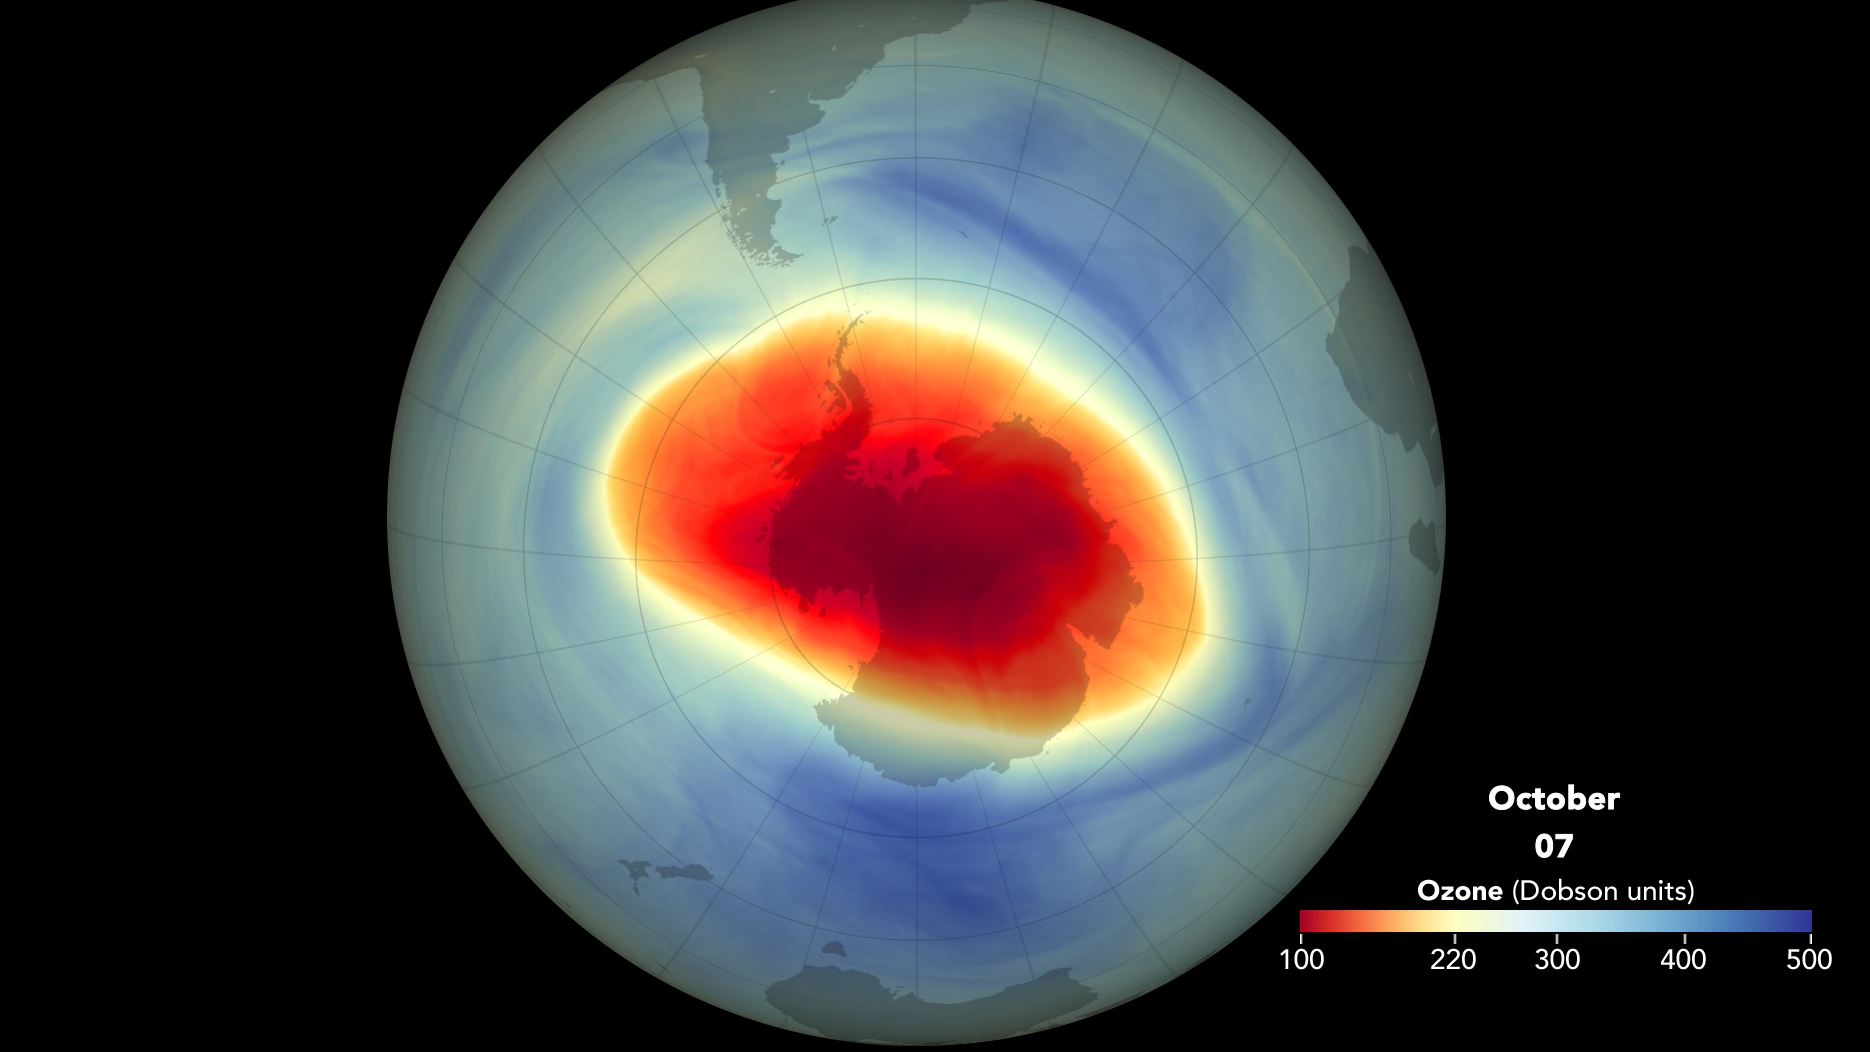
By Elizabeth Howell 5 November 2021 (Space.com) – A new NASA video highlights the giant ozone hole that opened over Antarctica this year. A cold Southern Hemisphere winter, and possible effects of global warming, have caused the hole to grow to its 13th-largest extent since 1979. The ozone depletion you see in the NASA video is monitored by three […]

Risk levels for climate-sensitive health outcomes based on different greenhouse gas emissions and adaptation scenarios. Graphic: IPCC WG 2 Sixth Assessment Report / AFP

Hunger, drought, disease: UN climate report reveals dire health threats – “The basis for our health is sustained by three pillars: the food we eat, access to water, and shelter. These pillars are totally vulnerable and about to collapse.”

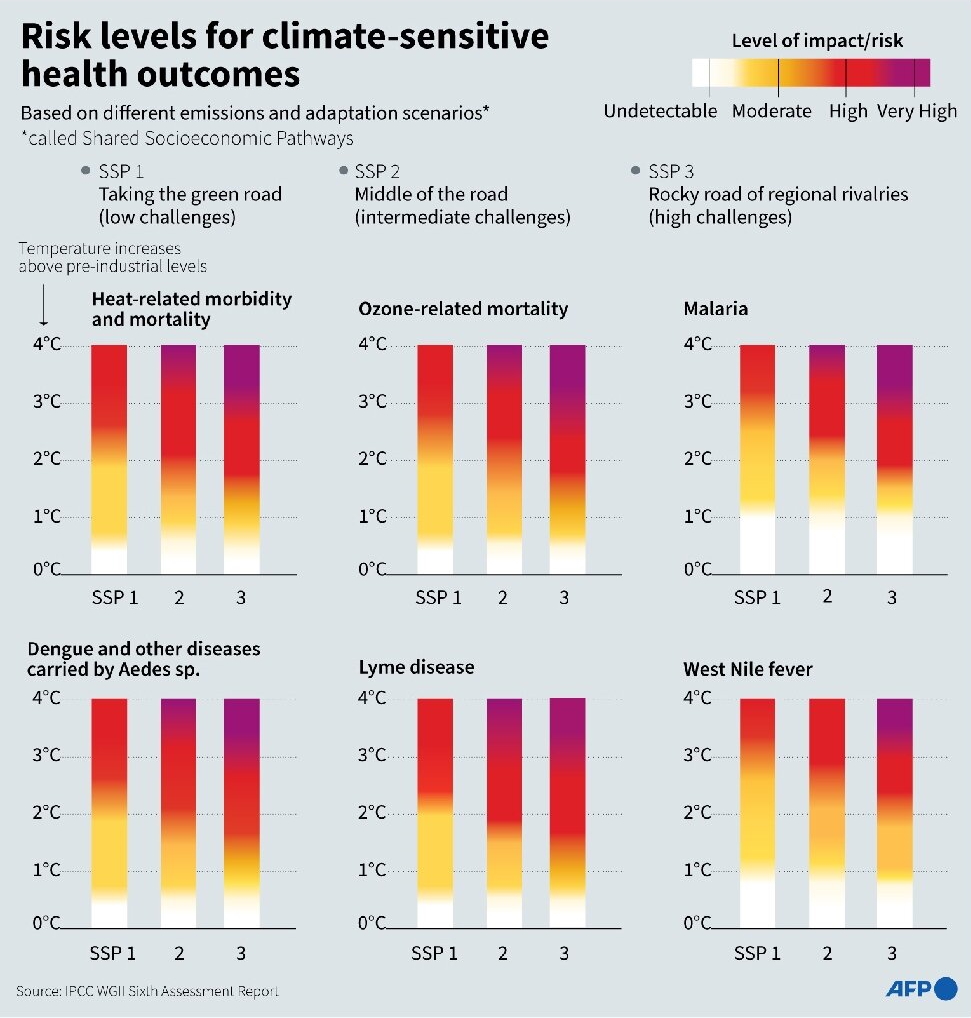
By Patrick Galey 23 June 2021 (AFP) – Hunger, drought and disease will afflict tens of millions more people within decades, according to a draft UN assessment that lays bare the dire human health consequences of a warming planet. After a pandemic year that saw the world turned on its head, a forthcoming report by […]

Total column ozone field (in Dobson Units) from CAMS, 1 April 2020 - 6 April 2020, showing values below 250 DU over large parts of the Arctic. Video: Copernicus Atmosphere Monitoring Service / ECMWF

Arctic ozone depletion tracks at record levels in Spring 2020

9 April 2020 (WMO) – Depletion of the ozone layer, ­ the shield that protects life on Earth from harmful levels of ultraviolet radiation, ­is at an unprecedented level over large parts of the Arctic this spring . This phenomenon is caused by the continuing presence of ozone­-depleting substances in the atmosphere and a very […]

Landsat 8 images from 21 July 2018 (left) and 16 September 2018 (right) illustrating the Taku Glacier transient snowline. The 21 July 2018 snowline is at 975 m and the 16 September 2018 snowline is at 1400 m. Average end-of-summer snowline is 975 m; the 2018 end-of-summer snowline was the highest observed in the 73-year record. Graphic: AMS

State of the Climate in 2018: 2018 was the fourth-hottest year on record, behind 2016, 2015, and 2017

12 August 2019 (NCEI) – A new State of the Climate report [pdf] confirmed that 2018 was the fourth warmest year in records dating to the mid-1800s. Last year was the fourth warmest year on record despite La Niña conditions early in the year and the lack of a short-term warming El Niño influence until […]

25th anniversary edition of WMO’s State of the Climate report shows accelerating global warming impacts – “The data released in this report give cause for great concern”

28 March 2019 (WMO) – The physical signs and socio-economic impacts of climate change are accelerating as record greenhouse gas concentrations drive global temperatures toward increasingly dangerous levels, according to a new report from the World Meteorological Organization. The WMO Statement on the State of the Global Climate in 2018, its 25th anniversary edition, highlights […]

The hottest 15 places in the world today are all in Australia as record heatwave rages on – Thousands of flying foxes dead – “One of the worst things is in the aftermath and you hear the mums calling out for their pups”

16 January 2019 (The Journal) – The top 15 hottest places in the world today are all in Australia as a severe heatwave continues to roast the southeast of the continent. The Australian Bureau of Meteorology said the past four days were among the country’s top 10 warmest on record, with temperatures nearing 50 degrees […]

Social media & sharing icons powered by UltimatelySocial