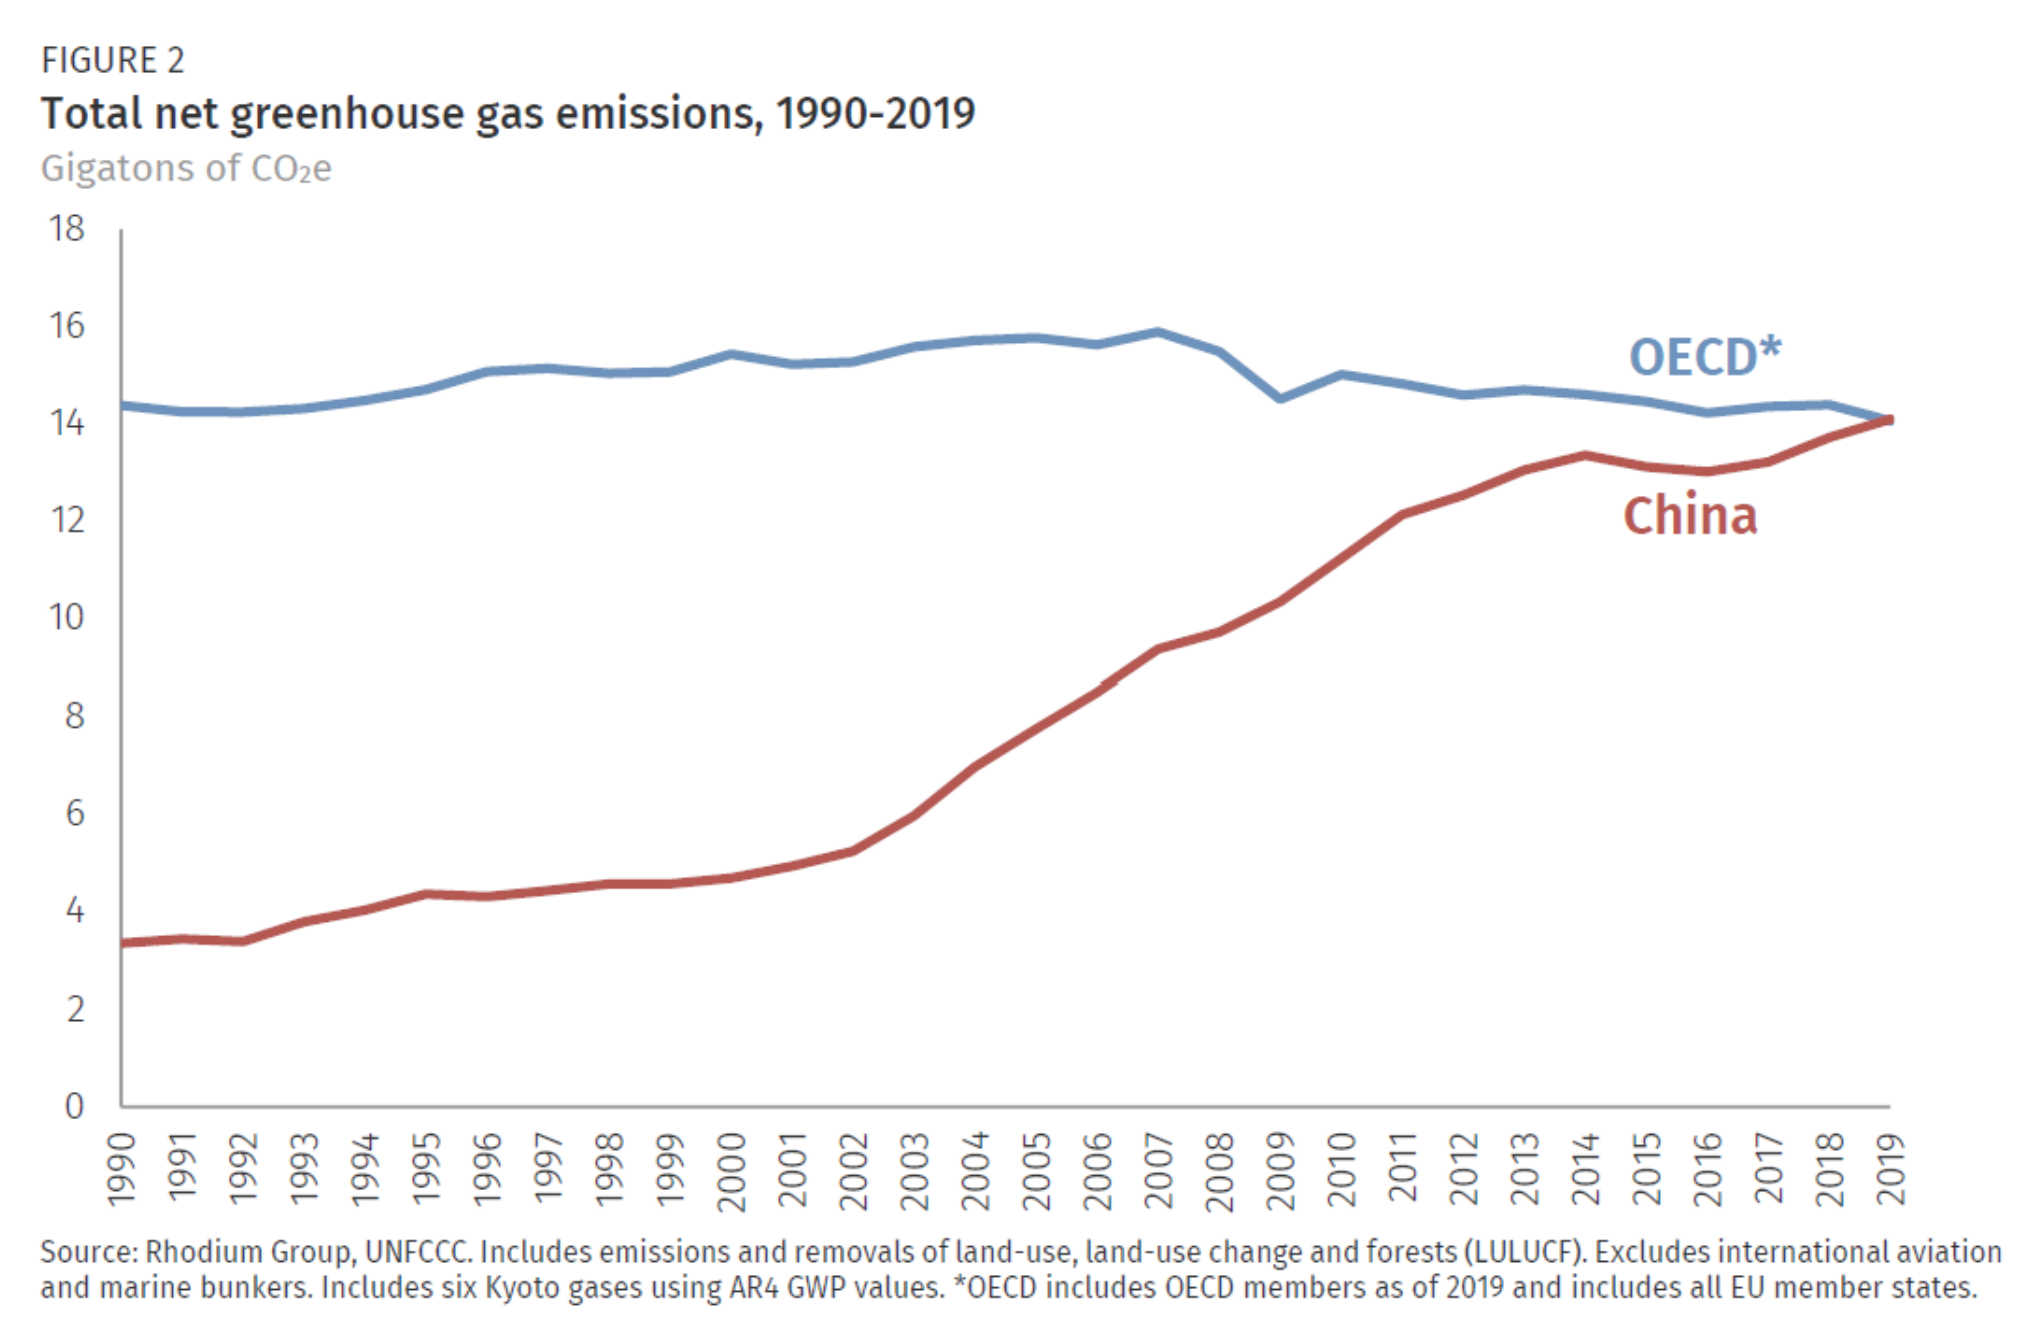
By Kate Larsen, Hannah Pitt, Mikhail Grant, and Trevor Houser 6 May 2021 (Rhodium Group) – Each year Rhodium Group provides the most up-to-date global and country-level greenhouse gas (GHG) emissions estimates through the ClimateDeck (a partnership with Breakthrough Energy). In addition to our preliminary US and China GHG estimates for 2020, Rhodium provides annual estimates of economy-wide emissions—including all […]
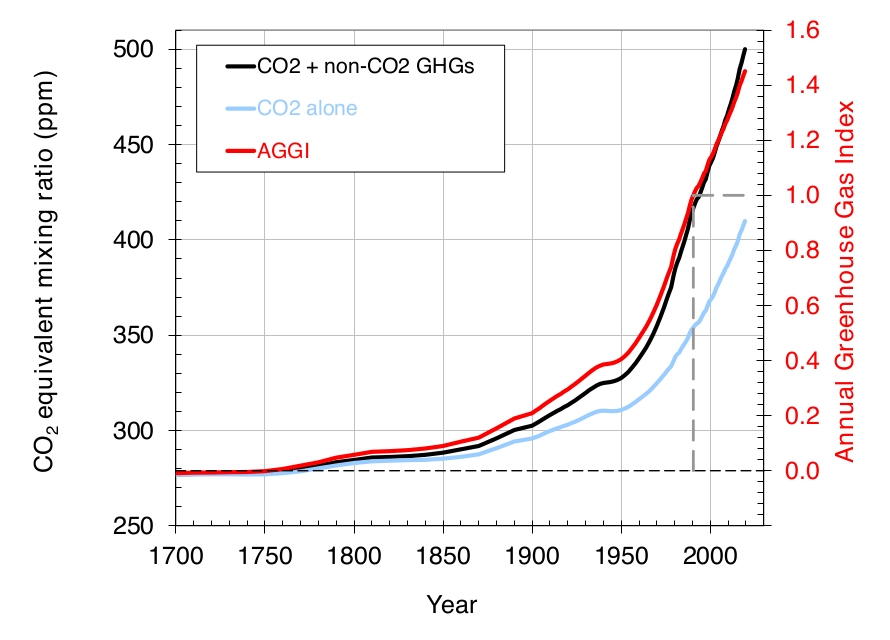
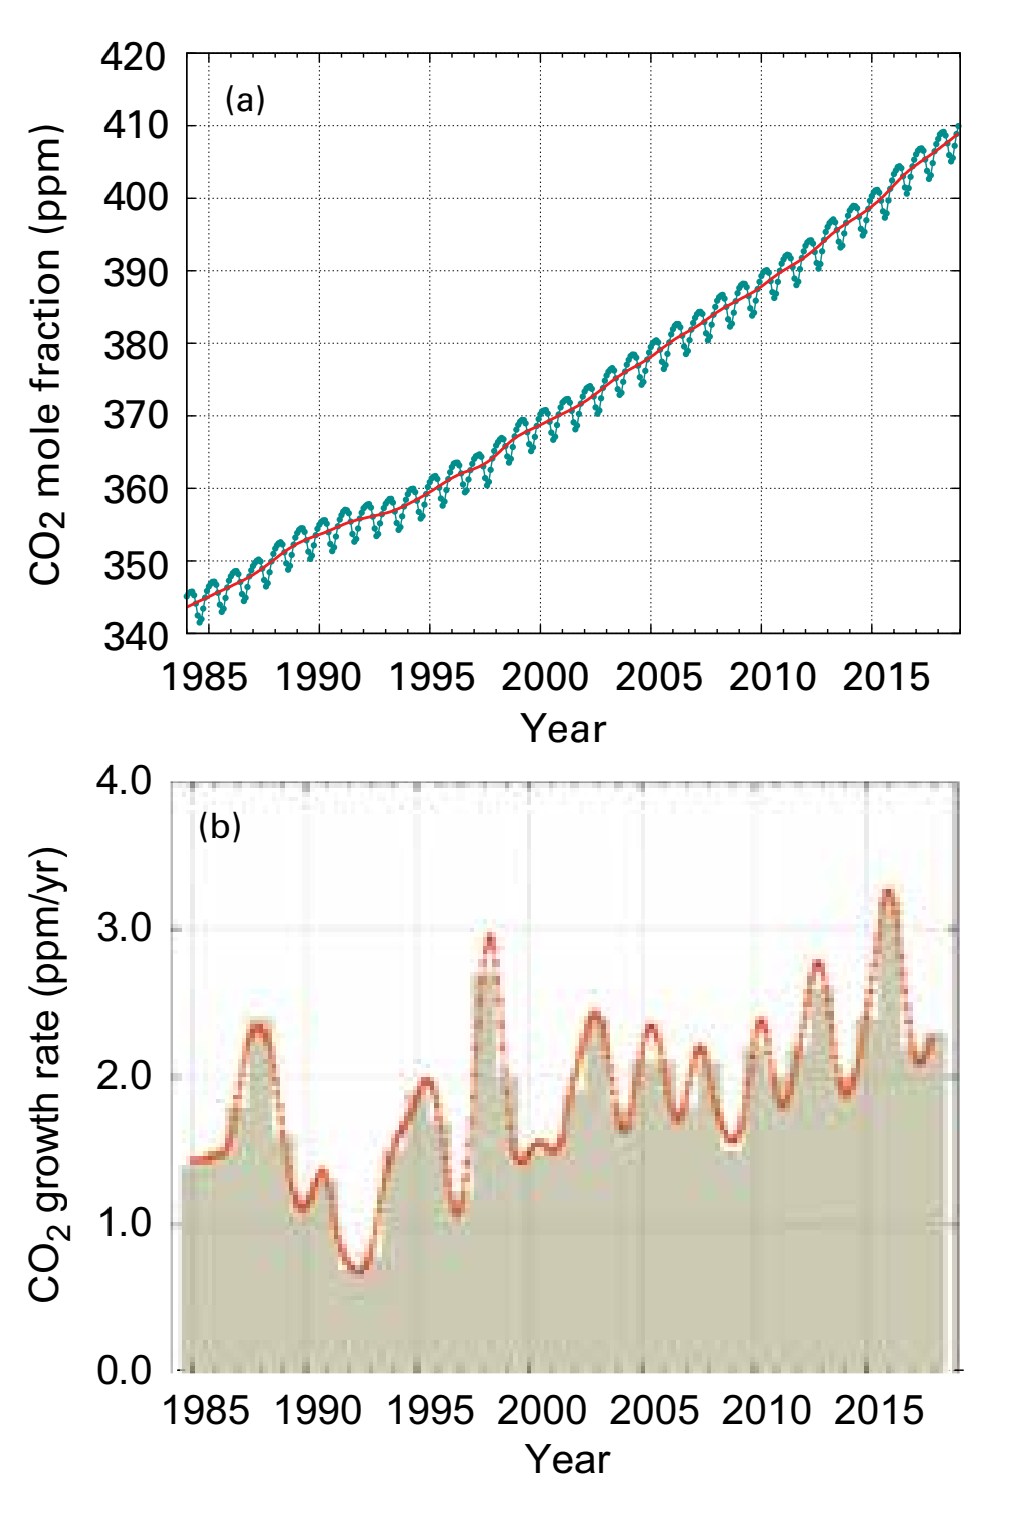
26 May 2021 (NOAA) – […] The atmospheric abundance of CO2 has increased by an average of 1.85 ppm per year over the past 41 years (1979-2020). This increase in CO2 is accelerating — while it averaged about 1.6 ppm per year in the 1980s and 1.5 ppm per year in the 1990s, the growth rate increased to […]
14 May 2020 (NOAA) – […] The NOAA monitoring program provides high-precision measurements of the global abundance and distribution of long-lived greenhouse gases that are used to calculate changes in radiative climate forcing. Air samples are collected through the NOAA/GML global air sampling network, including a cooperative program for the carbon gases which provides samples […]
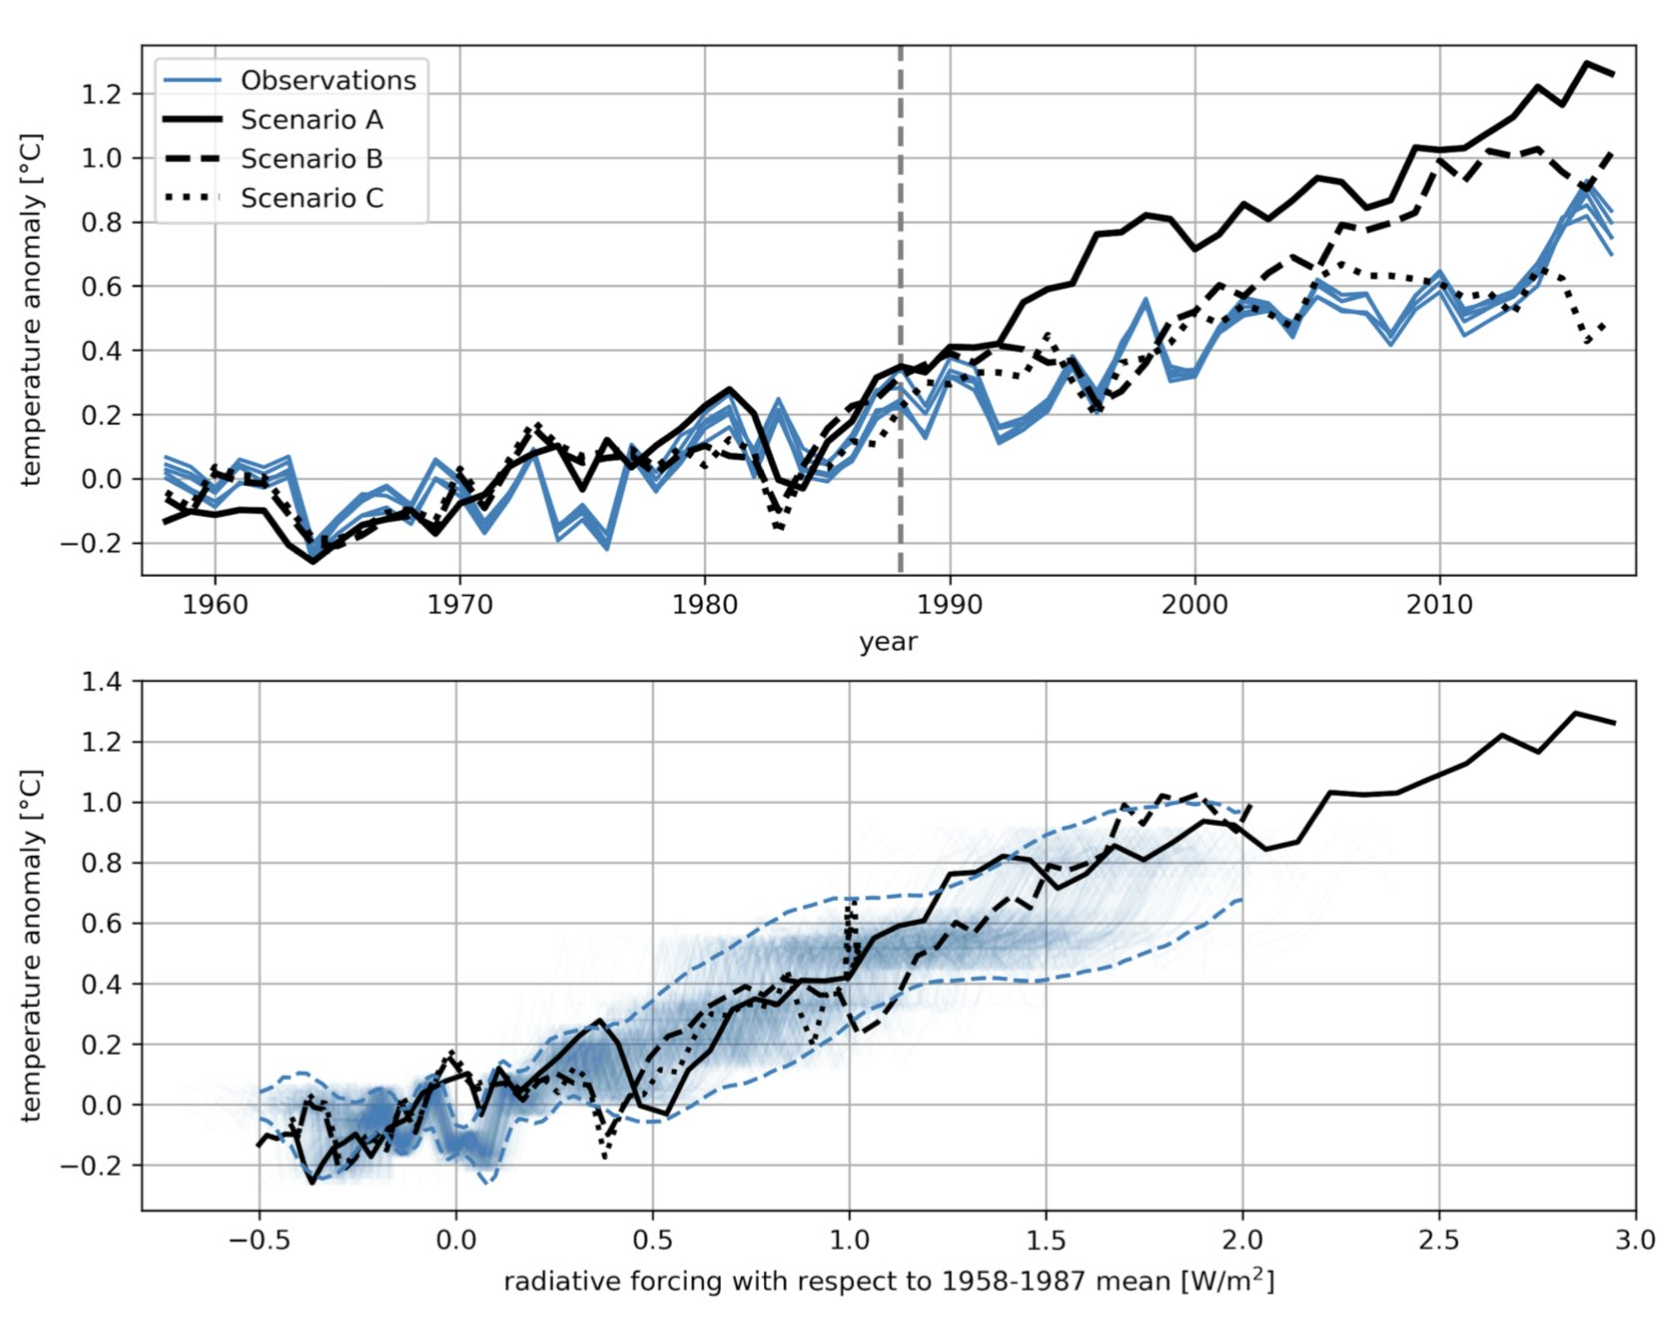
By Robert Sanders 4 December 2019 (Berkeley News) – Climate skeptics have long raised doubts about the accuracy of computer models that predict global warming, but it turns out that most of the early climate models were spot-on, according to a look-back by climate scientists at the University of California, Berkeley, Massachusetts Institute of Technology […]
GENEVA, 25 November 2019 (WMO) – Levels of heat-trapping greenhouse gases in the atmosphere have reached another new record high, according to the World Meteorological Organization. This continuing long-term trend means that future generations will be confronted with increasingly severe impacts of climate change, including rising temperatures, more extreme weather, water stress, sea level rise […]
5 November 2019 (BioScience) – Scientists have a moral obligation to clearly warn humanity of any catastrophic threat and to “tell it like it is.” On the basis of this obligation and the graphical indicators presented below, we declare, with more than 11,000 scientist signatories from around the world, clearly and unequivocally that planet Earth […]
By Sudarshan Varadhan 15 November 2019 NEW DELHI (Reuters) – More than half of India’s coal-fired power plants ordered to retrofit equipment to curb air pollution are set to miss the deadline, private industry estimates and a Reuters analysis show, as millions in the country wake up to toxic air each day. Thermal power companies, […]
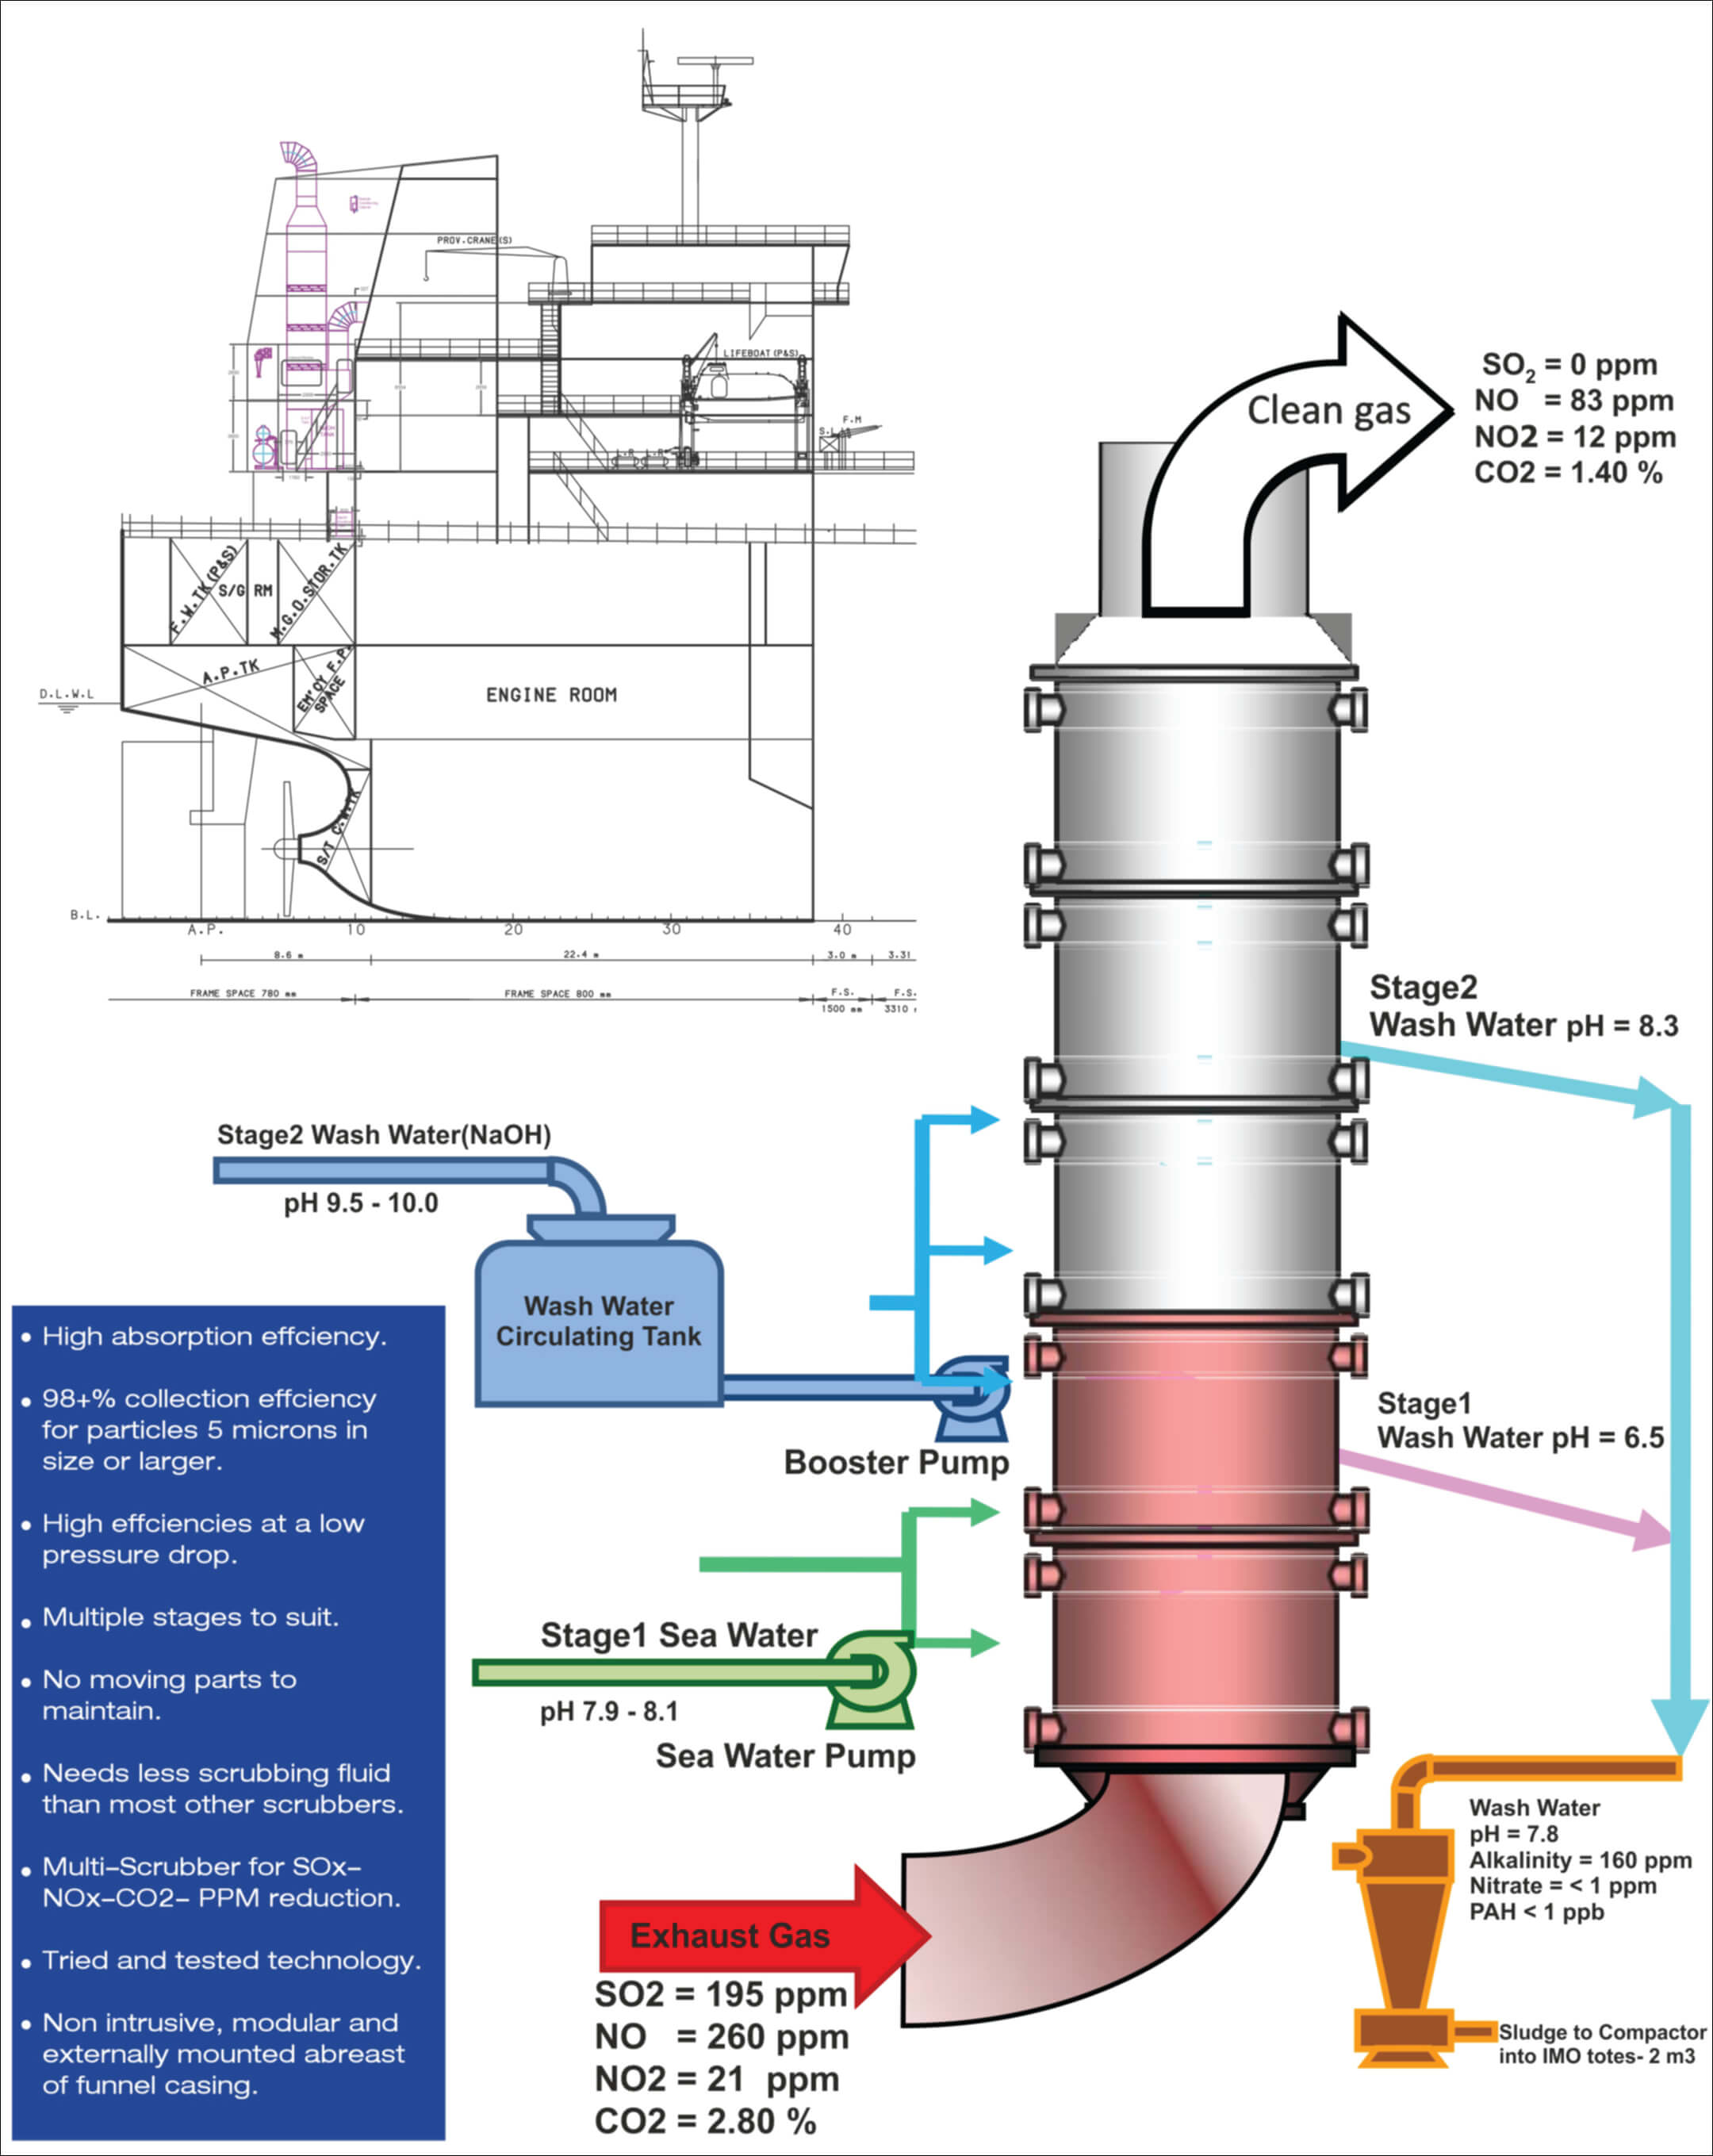
By Wil Crisp 30 September 2019 (The Independent) – Global shipping companies have spent billions rigging vessels with “cheat devices” that circumvent new environmental legislation by dumping pollution into the sea instead of the air, The Independent can reveal. More than $12bn (£9.7bn) has been spent on the devices, known as open-loop scrubbers, which extract […]
NEW YORK, 22 September 2019 (WMO) – The world’s leading climate science organizations have joined forces to produce a landmark new report [pdf] for the United Nations Climate Action Summit, underlining the glaring – and growing – gap between agreed targets to tackle global warming and the actual reality. The report, United in Science, includes details on the […]
8 August 2019 (UN News) – More than 500 million people today live in areas affected by erosion linked to climate change, the UN warned on Thursday, before urging all countries to commit to sustainable land use to help limit greenhouse gas emissions before it is too late. Speaking at the launch of a Special […]
![Annual Greenhouse Gas Index (AGGI), 1750-2020. For 2020, the AGGI was a record high 1.47, representing an increase in total direct radiative forcing of 47 percent since 1990. This increase in CO2 is accelerating — while it averaged about 1.6 ppm per year in the 1980s and 1.5 ppm per year in the 1990s, the growth rate increased to 2.4 ppm per year during the last decade (2009-2020). Pre-1978 changes in the CO2-equivalent abundance and AGGI based on the ongoing measurements of all greenhouse gases reported here, measurements of CO2 going back to the 1950s from C.D. Keeling [Keeling et al., 1958], and atmospheric changes derived from air trapped in ice and snow above glaciers [Machida et al., 1995, Battle et al., 1996, Etheridge, et al., 1996; Butler, et al., 1999]. Equivalent CO2 atmospheric amounts (in ppm) are derived with the relationship between CO2 concentrations and radiative forcing from all long-lived greenhouse gases. Graphic: Butler and Montzka, 2021 / NOAA](https://desdemonadespair.net/wp-content/uploads/2021/05/AGGI-1750-2020-Butler-and-Montzka-2021-NOAA.png)