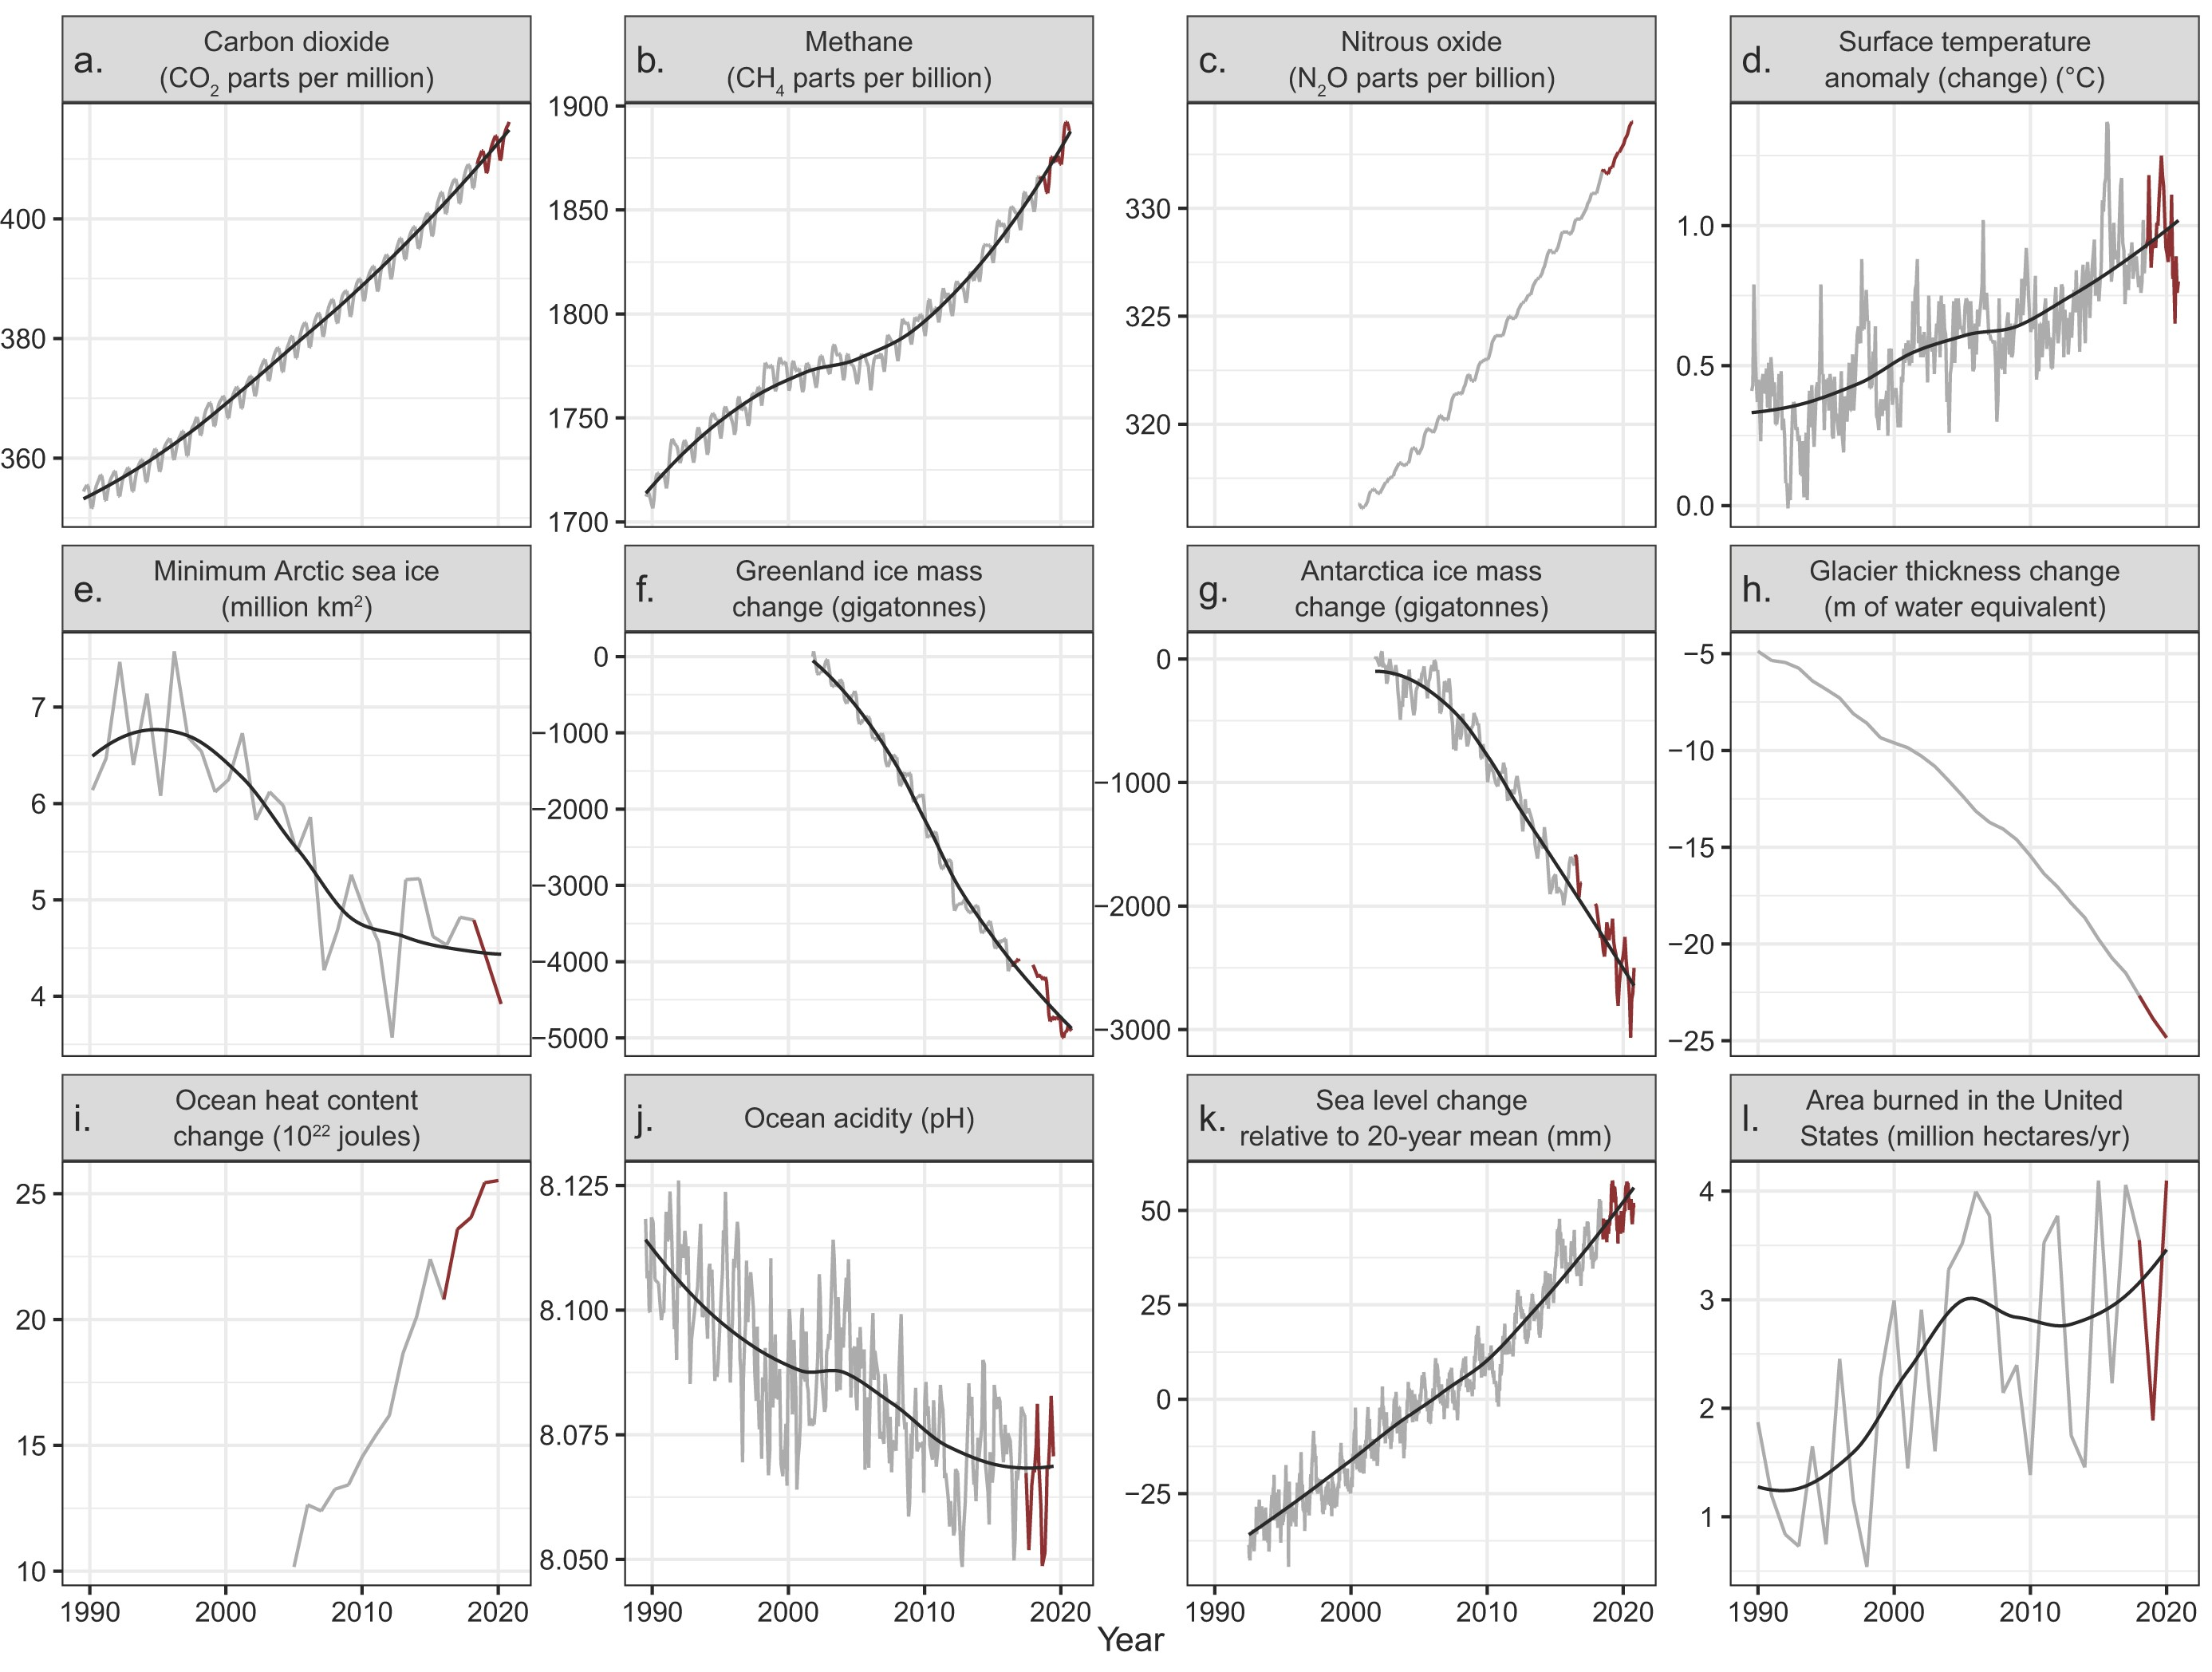
28 July 2021 (BioScience) – In 2019, Ripple and colleagues (2020) warned of untold suffering and declared a climate emergency together with more than 11,000 scientist signatories from 153 countries. They presented graphs of planetary vital signs indicating very troubling trends, along with little progress by humanity to address climate change. On the basis of […]
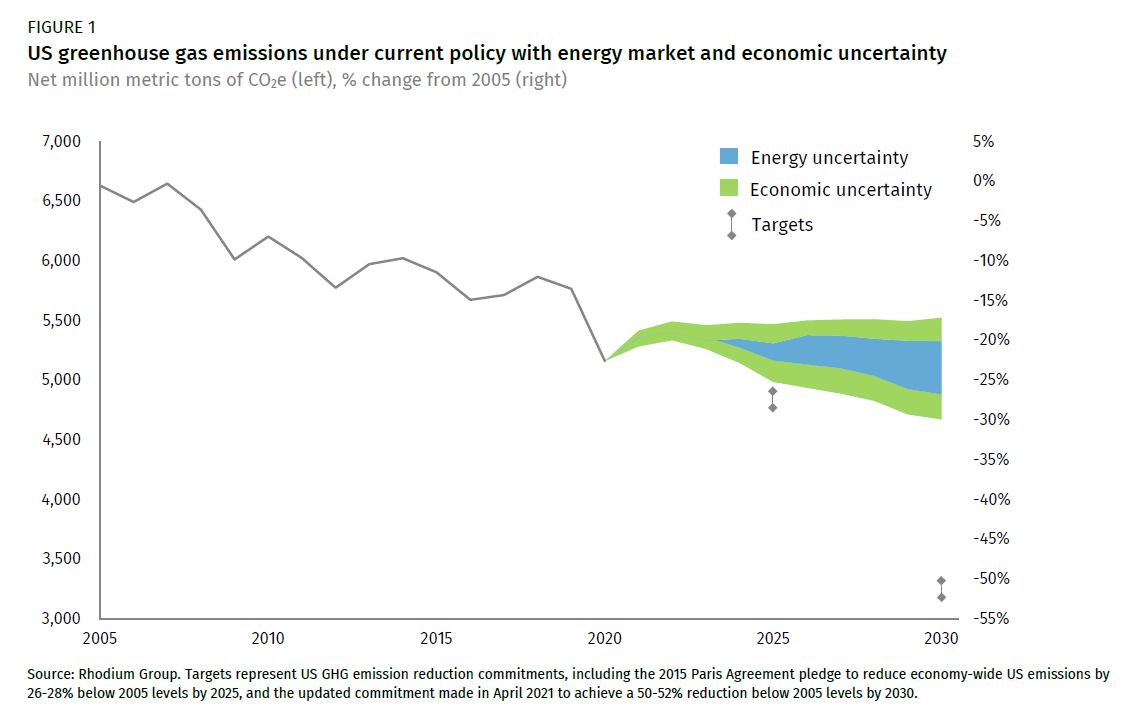
By Hannah Pitt, Kate Larsen, Hannah Kolus, Ben King, Alfredo Rivera, Emily Wimberger, Whitney Herndon, John Larsen, and Galen Hiltbrand 15 July 2021 (Rhodium Group) – For the past seven years, Rhodium Group has provided an independent annual outlook for US greenhouse gas (GHG) emissions under current federal and state policy. This current policy baseline […]
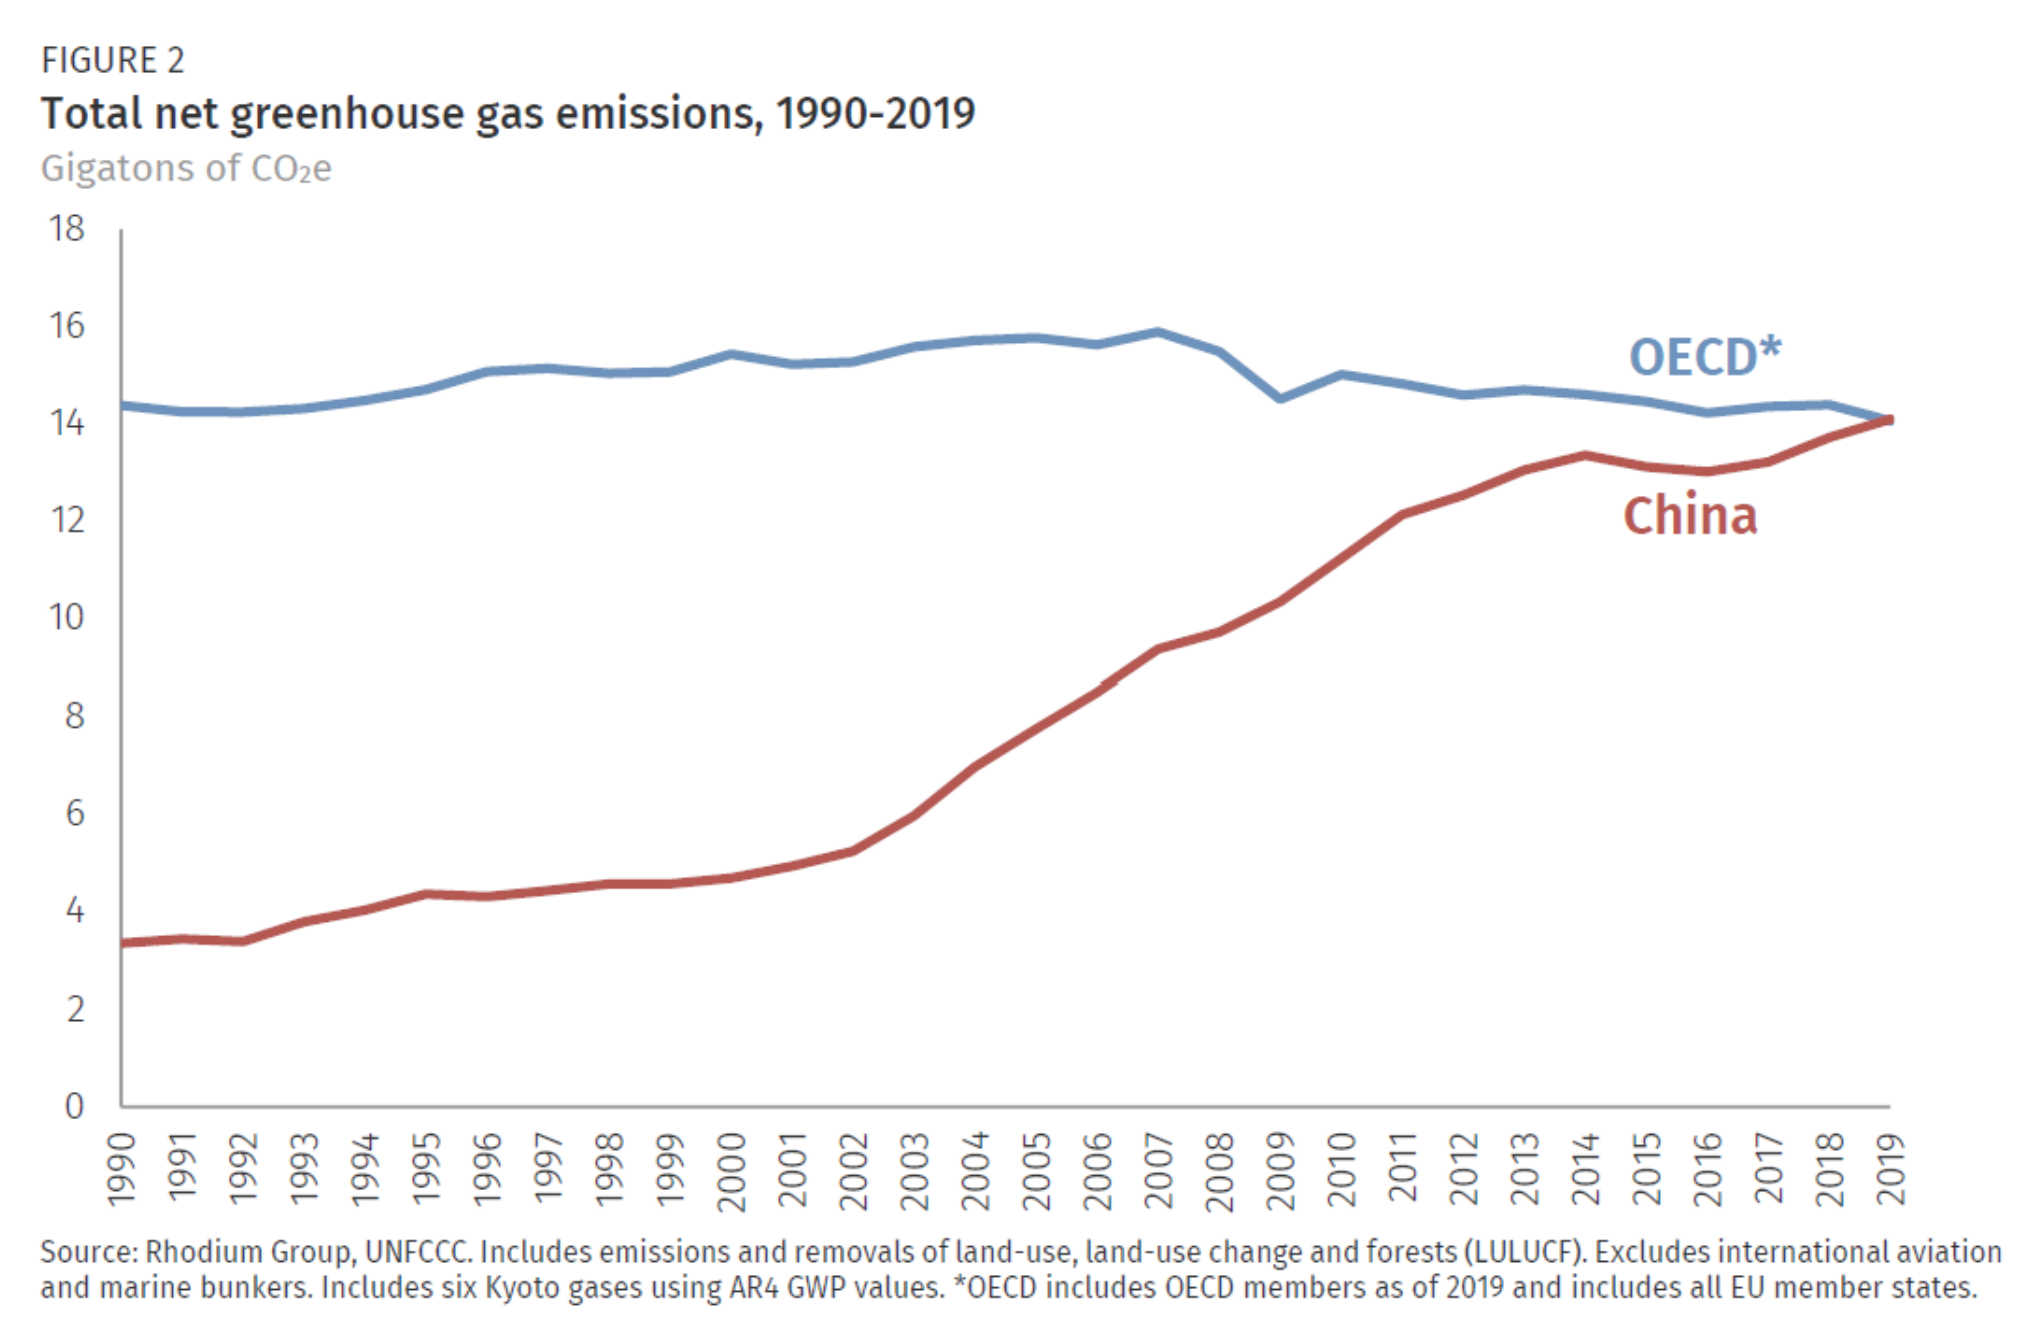
By Kate Larsen, Hannah Pitt, Mikhail Grant, and Trevor Houser 6 May 2021 (Rhodium Group) – Each year Rhodium Group provides the most up-to-date global and country-level greenhouse gas (GHG) emissions estimates through the ClimateDeck (a partnership with Breakthrough Energy). In addition to our preliminary US and China GHG estimates for 2020, Rhodium provides annual estimates of economy-wide emissions—including all […]
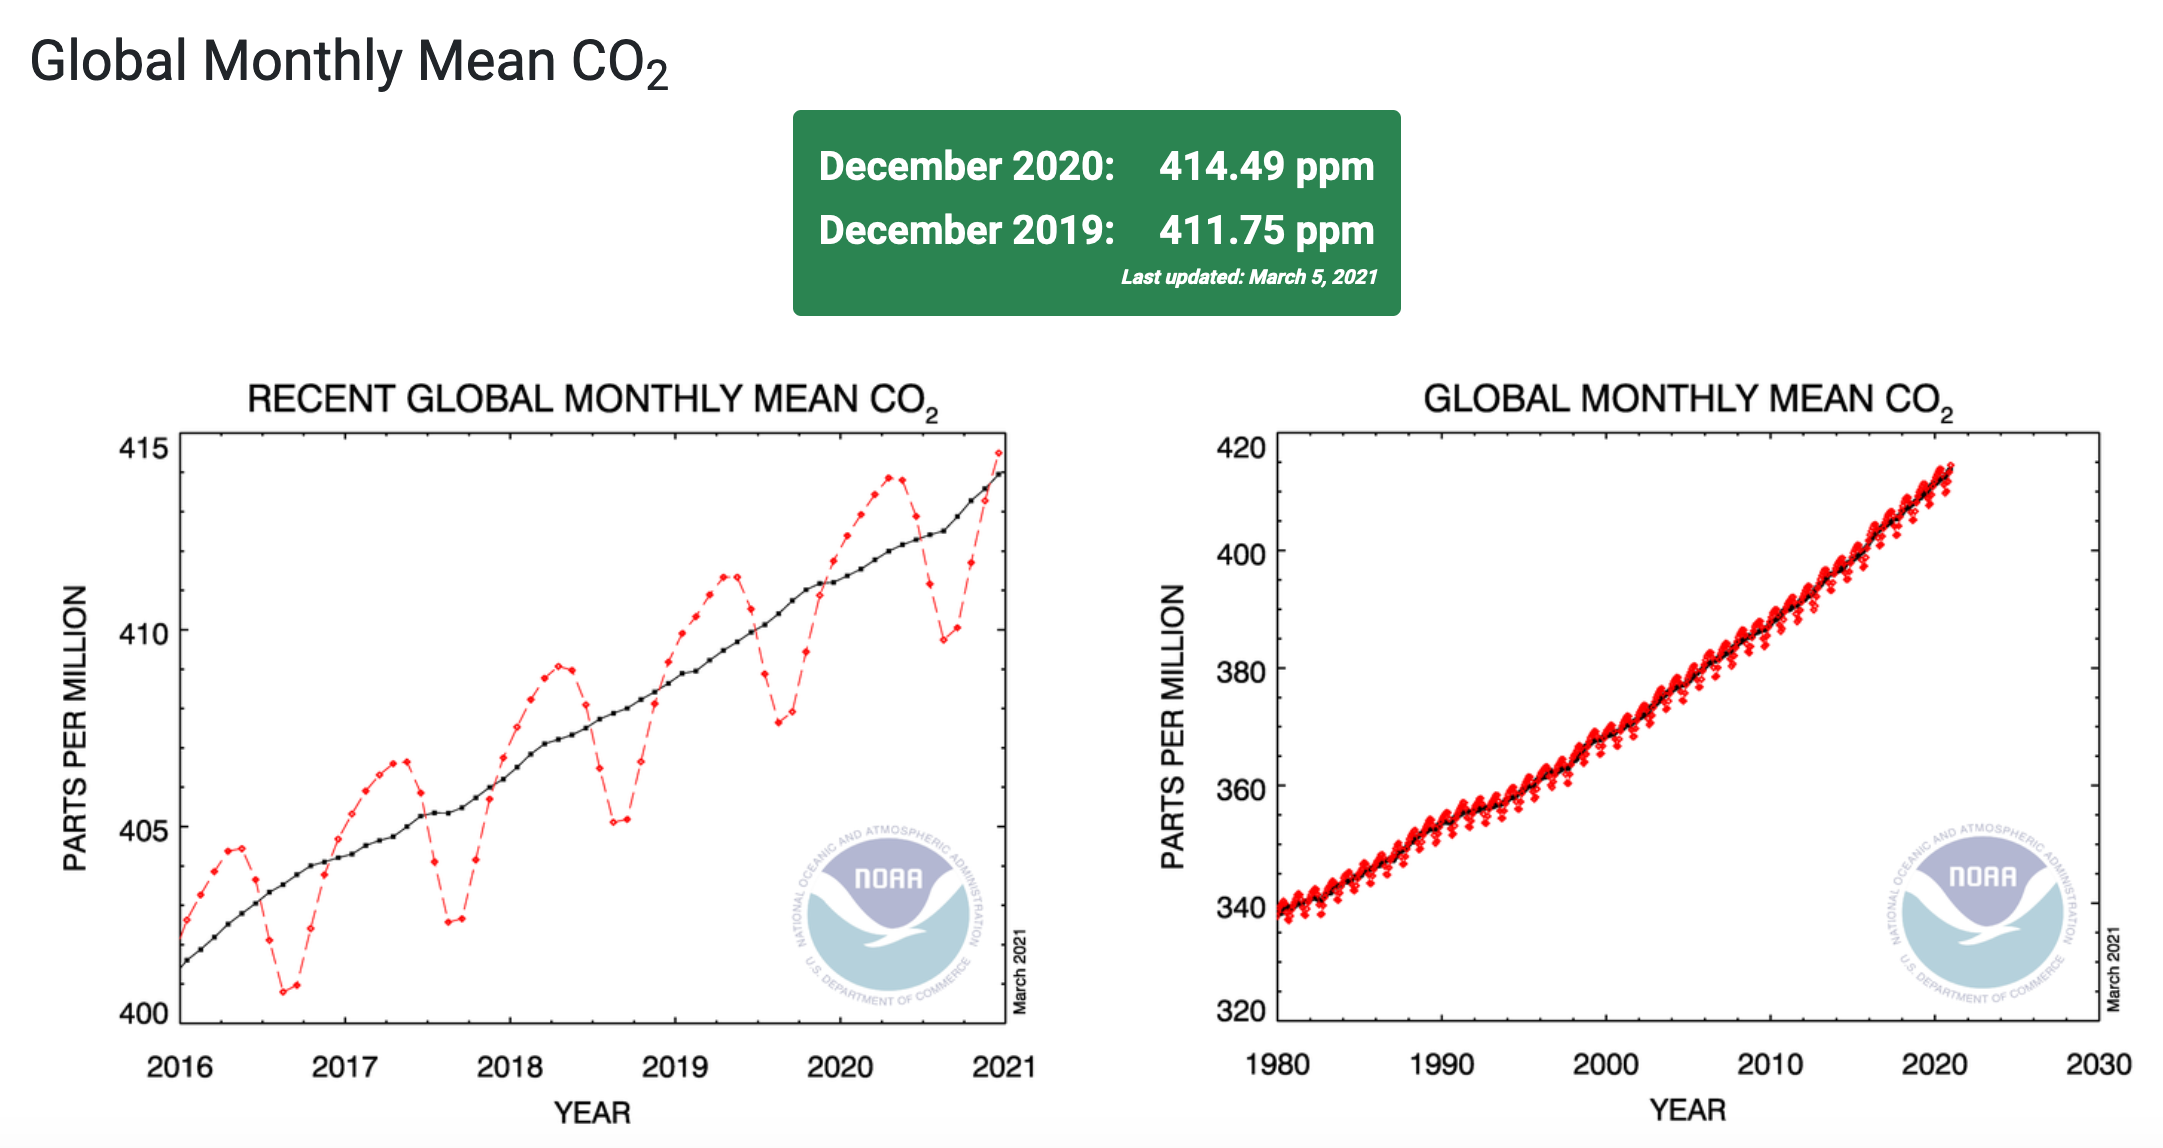
26 May 2021 (NOAA) – […] The atmospheric abundance of CO2 has increased by an average of 1.85 ppm per year over the past 41 years (1979-2020). This increase in CO2 is accelerating — while it averaged about 1.6 ppm per year in the 1980s and 1.5 ppm per year in the 1990s, the growth rate increased to […]
7 April 2021 (NOAA) – Levels of the two most important anthropogenic greenhouse gases, carbon dioxide and methane, continued their unrelenting rise in 2020 despite the economic slowdown caused by the coronavirus pandemic response, NOAA announced today. The global surface average for carbon dioxide (CO2), calculated from measurements collected at NOAA’s remote sampling locations, was […]
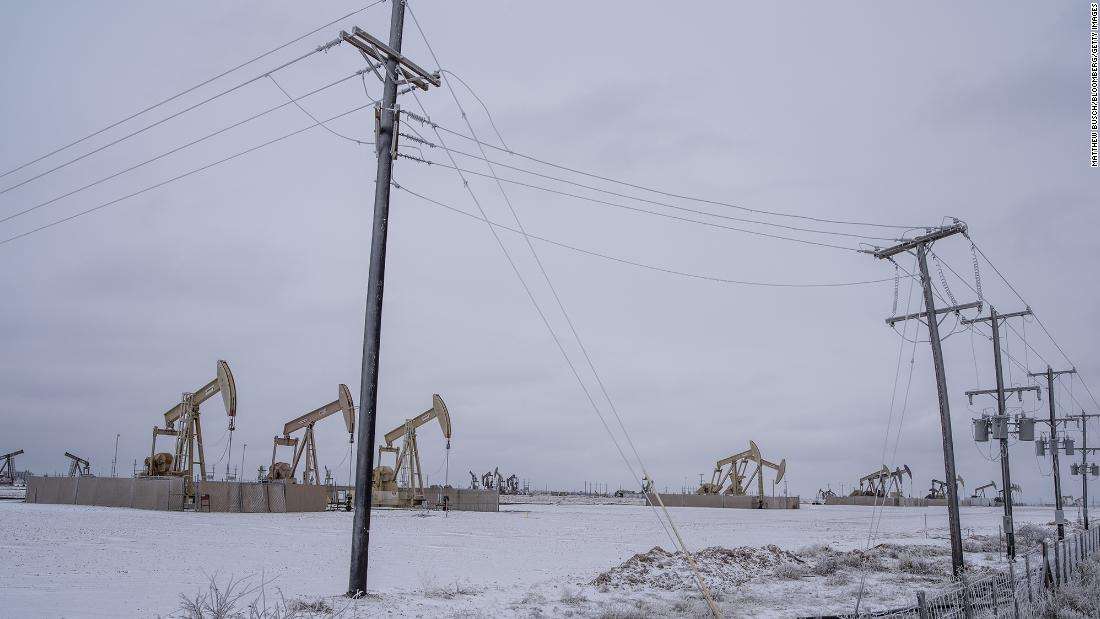
By Laura Sanicola and Erwin Seba 21 February 2021 NEW YORK/HOUSTON (Reuters) – The largest U.S. oil refiners released tons of air pollutants into the skies over Texas this past week, according to figures provided to the state, as refineries and petrochemical plants in the region scrambled to shut production during frigid weather. An arctic […]
GENEVA, 23 November 2020 (WMO) – The industrial slowdown due to the COVID-19 pandemic has not curbed record levels of greenhouse gases which are trapping heat in the atmosphere, increasing temperatures, and driving more extreme weather, ice melt, sea-level rise, and ocean acidification, according to the World Meteorological Organization (WMO). The lockdown has cut emissions […]
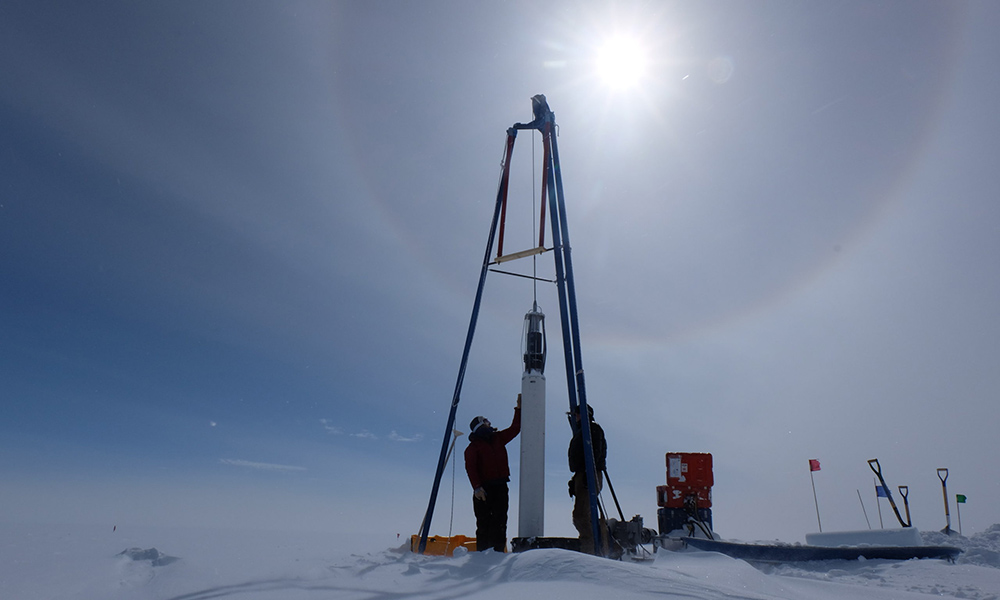
14 May 2020 (NOAA) – […] The NOAA monitoring program provides high-precision measurements of the global abundance and distribution of long-lived greenhouse gases that are used to calculate changes in radiative climate forcing. Air samples are collected through the NOAA/GML global air sampling network, including a cooperative program for the carbon gases which provides samples […]
By Lindsey Valich 19 February 2020 (University of Rochester) – Methane is a powerful greenhouse gas and large contributor to global warming. Methane emissions to the atmosphere have increased by approximately 150 percent over the past three centuries, but it has been difficult for researchers to determine exactly where these emissions originate; heat-trapping gases like […]
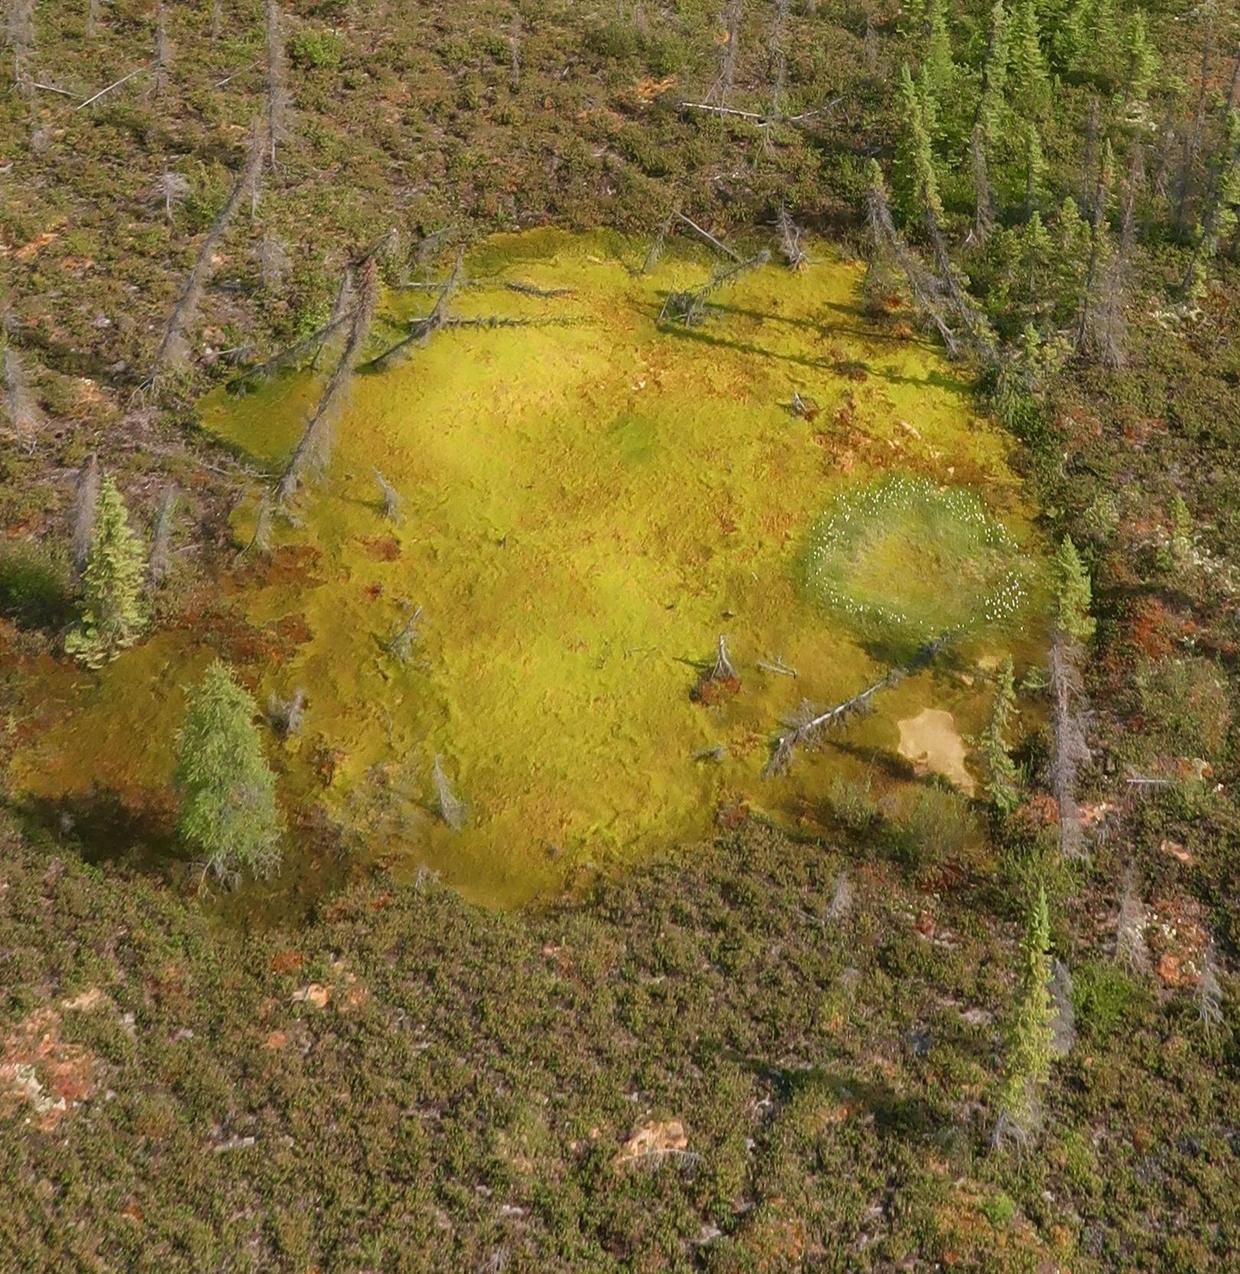
By Natacha Larnaud 4 February 2020 (CBS News) – Rapidly thawing permafrost in the Arctic has scientists worried. According to a new study published Monday in the journal Nature Geoscience, the ice that holds the soil together is melting, causing hillsides to collapse and massive sinkholes to open up as a result. And that dramatic disruption to […]
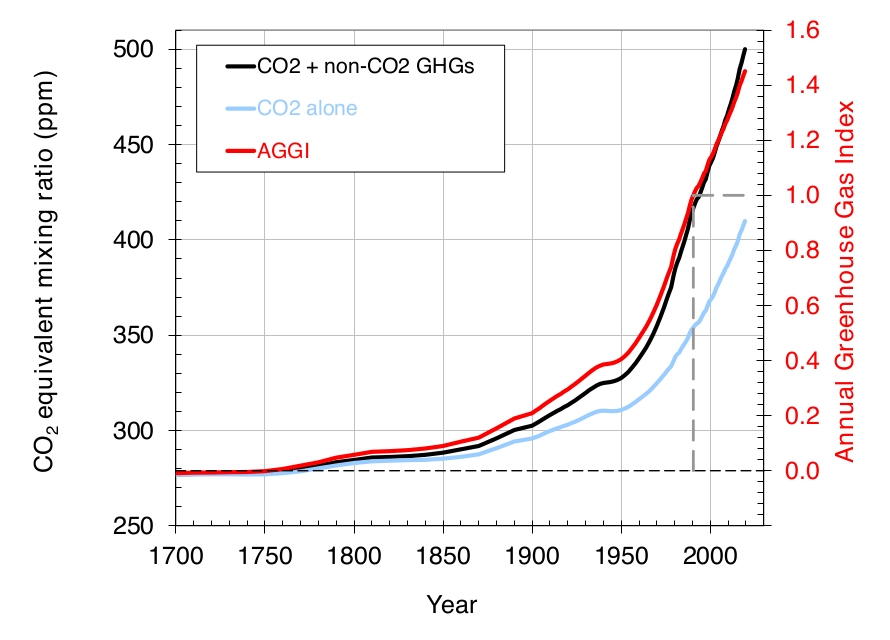
![Annual Greenhouse Gas Index (AGGI), 1750-2020. For 2020, the AGGI was a record high 1.47, representing an increase in total direct radiative forcing of 47 percent since 1990. This increase in CO2 is accelerating — while it averaged about 1.6 ppm per year in the 1980s and 1.5 ppm per year in the 1990s, the growth rate increased to 2.4 ppm per year during the last decade (2009-2020). Pre-1978 changes in the CO2-equivalent abundance and AGGI based on the ongoing measurements of all greenhouse gases reported here, measurements of CO2 going back to the 1950s from C.D. Keeling [Keeling et al., 1958], and atmospheric changes derived from air trapped in ice and snow above glaciers [Machida et al., 1995, Battle et al., 1996, Etheridge, et al., 1996; Butler, et al., 1999]. Equivalent CO2 atmospheric amounts (in ppm) are derived with the relationship between CO2 concentrations and radiative forcing from all long-lived greenhouse gases. Graphic: Butler and Montzka, 2021 / NOAA](https://desdemonadespair.net/wp-content/uploads/2021/05/AGGI-1750-2020-Butler-and-Montzka-2021-NOAA.png)